QQD - Oh No Another Top Is Here
Summary
- It's been a while since we've seen a meaningful top in this bear market.
- Incidentally, 4,200 in the S&P 500 is the 20% bear market bounce many market participants have eyed as a plausible near-term top.
- The Fed, inflation, worsening economic readings, the consumer, an earnings recession, and the labor market are among the primary factors that trouble me.
- We likely reached another near-term high, the market should become more volatile, and we may see another drop soon.
The recent S&P 500/SPX ( SP500 ) rally has taken the major stock market average from 3,500 - 4,200. It's been an epic rebound since I called a significant bottom in mid October. The rebound has been epic, now equating to 20%, with many individual stocks appreciating much more in this time frame. The $64,000 question is whether this is the end of a textbook 20% bear market rally or the beginning of a new bull run. The answer is complicated because some stocks likely hit their lows (specific quality tech stocks and others). However, SPX, and many stocks, in general, could go substantially lower from here, especially after the significant rally we've just seen.
S&P 500 - Not Another Top
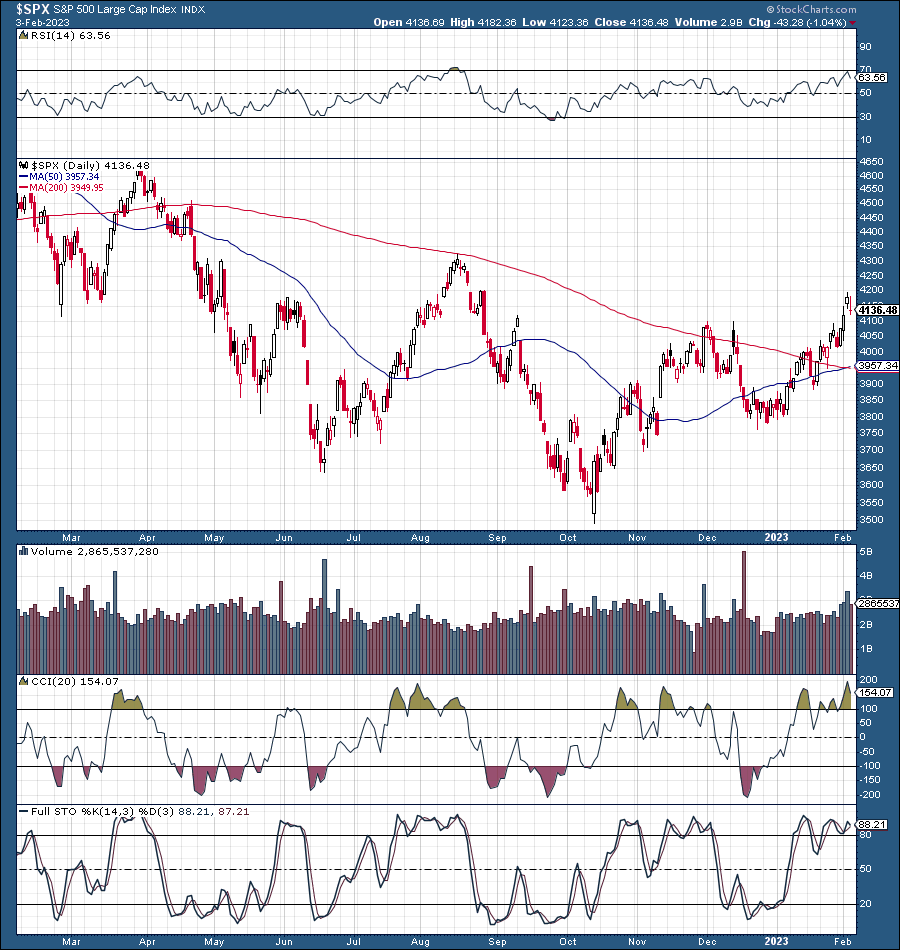
SPX (StockCharts.com)
We identified the bottom when the sharp reversal occurred in October. I even provided the 4,000-4,200 as the likely range for the next top back in my October piece . So, we've hit 4,200. Now what? The market may have come up too quickly and is probably due for a correction. We have heavy resistance at 4,200-4,300, and the RSI is around 30 now, illustrating overbought technical conditions. I'm also not crazy about so many people being bullish suddenly. It makes me cautious, and there's still a probability that the bottom hasn't been achieved. How deep the drop will be from here isn't exactly clear, but we have several possible scenarios brewing.
The Bullish Case
My most optimistic near-term case is that the bottom may correct to about the 4,000 level, consolidate and proceed higher into the 4,200-4,300. Nevertheless, I don't see a high probability of substantial gains beyond the upper price range limit in the near term.
The Base Case
The base case is that volatility will pick up here, and we could see a drop below 4,000 support. Then, we can look for support around 3,800 or a bit lower. However, this would imply further volatility and possibly more downside as the market advances.
The Bearish Case
The bearish case is simple, and it involves the market falling through 4,000 support, 3,800 support, and 3,500 support. Ultimately, we could see the SPX bottom around the 3,000-3,300 range. There is a more bearish case scenario, but we will save that for next time.
The Takeaway
So, which case is likeliest? First, none of these scenarios are particularly bullish in the near term. Even the bullish case has a limited upside of several percent. However, there's the risk to the downside while the negative technical and fundamental factors persist. We will probably see a rockier and more volatile stock market in the coming months. We could see the SPX remain relatively rangebound between 3,800-4,200 for some time. Of course, we may even see new lows because if 3,800 breaks down, 3,500 isn't safe, and panic selling coupled with a margin call and other harmful factors could cause stocks to head lower.
Several Factors That Concern Me
Number One - The Fed
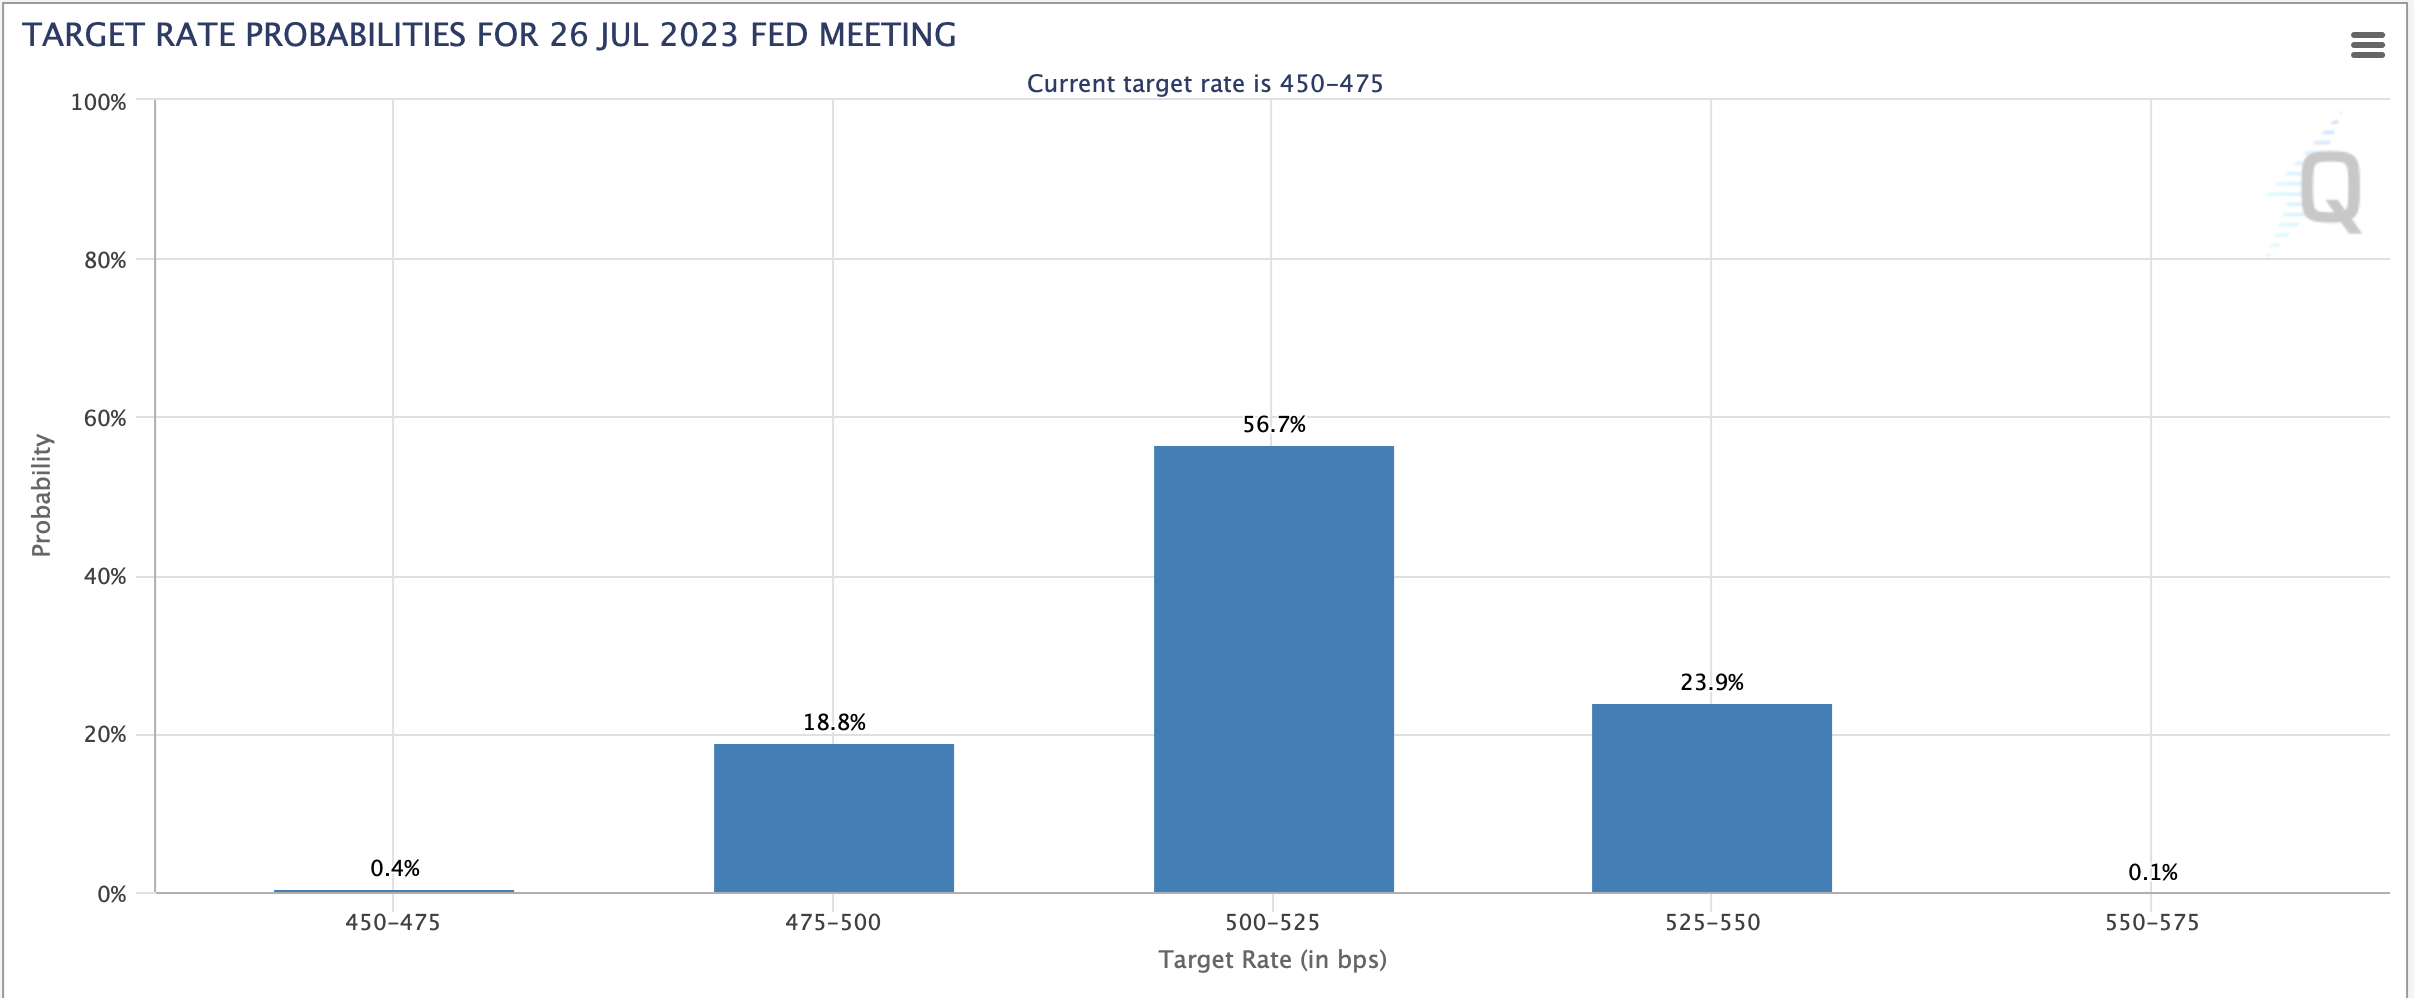
Rate probabilities (CMEGroup.com)
The market expects Fed funds rate to be about 5-5.5% by mid-year. Despite the recent incremental increases, 5% is exceptionally high for the American economy. The cost of borrowing is rising significantly and will continue increasing as the actual effects of tighter monetary policy take time to filter through the system. However, the consequences are coming, and they should affect consumer borrowing and corporate credit lines negatively, leading to a slowdown in spending, GDP, and corporate profits.
Number Two - Inflation
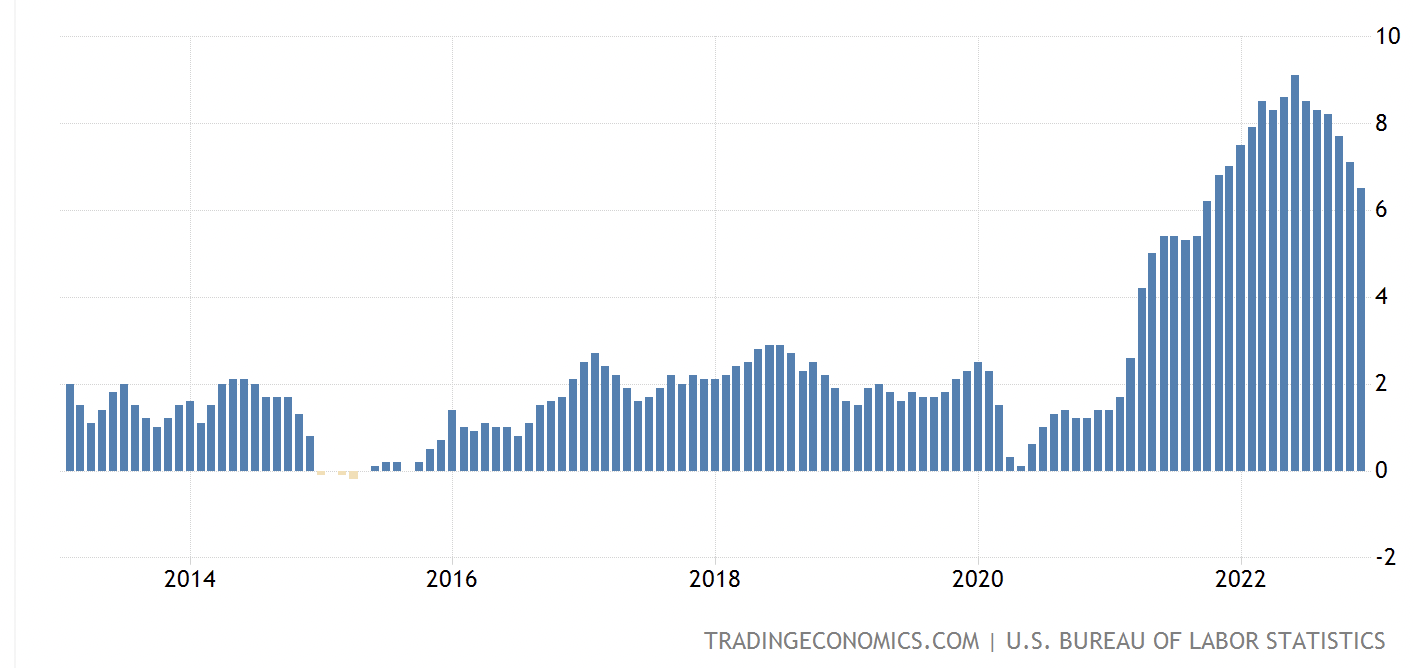
CPI inflation (TradingEconomics )
Yes, inflation is off its highs of more than 9% , and yes, the Fed's plan is working for now. However, it will likely be a challenging ride down to low inflation. On the contrary, we could see some volatility in the upcoming inflation readings, leading to more volatility in the stock market.
Number Three - Worsening Economic Readings
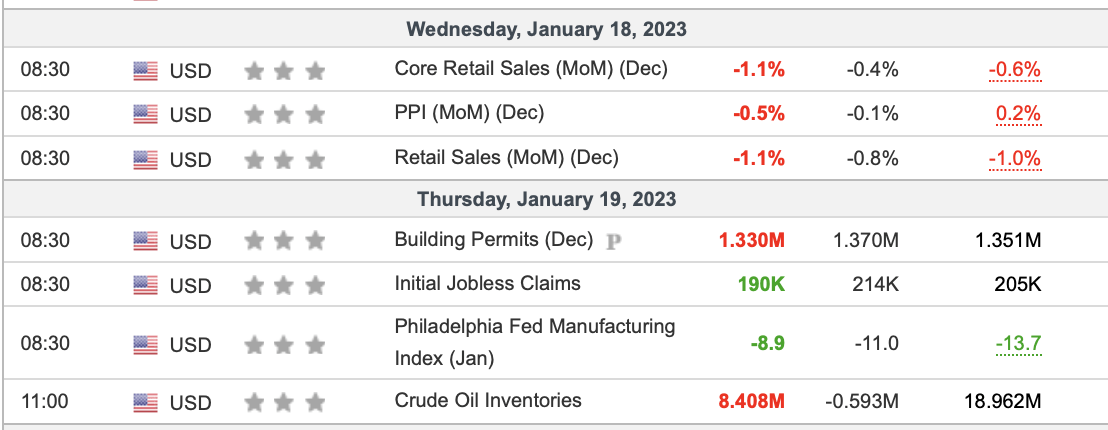
Economic readings (Investing.com )
We've seen manufacturing and service numbers going into contracting recently. Also, recent retail sales could have been better and better than the estimates. Moreover, housing and other critical economic data show some signs of deteriorating, often missing already significantly lowered estimates.
Number Four - The Consumer
We're witnessing lower retail sales numbers materialize. Moreover, consumer sentiment and confidence have been poorly damaged during the recent downturn. Additionally, higher borrowing costs and high inflation should continue pressuring consumer spending, leading to problems with corporate margins and bottom lines.
Number Five - An Earnings Recession
Many top corporations are going through earnings recessions , and we can see the trend continuing in the coming months. Moreover, higher borrowing costs are causing consumers to cut back on spending, and higher labor and other expenses are squeezing corporate margins significantly now. Therefore, we should see the lower earnings trend continue for longer than expected, and the market may not be pricing in this phenomenon.
Number Six - The Labor Market
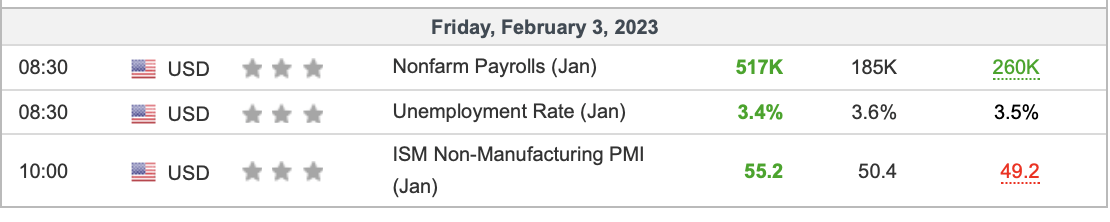
Jobs numbers (Investing.com )
Yes, we saw a strong labor report for December. However, the labor market is typically one of the last economic dominoes to fall. We have unemployment at rock bottom, so how much lower can it go? We've seen extremely low unemployment rates in other instances throughout recent history, most prominently around 2,000, 2,007, and 2019. Also, the Fed's own Jerome Powell said there would be pain down the line for the labor market, which means more pain is ahead for Main Street and Wall Street.
The Bottom Line - Where We're Heading From Here
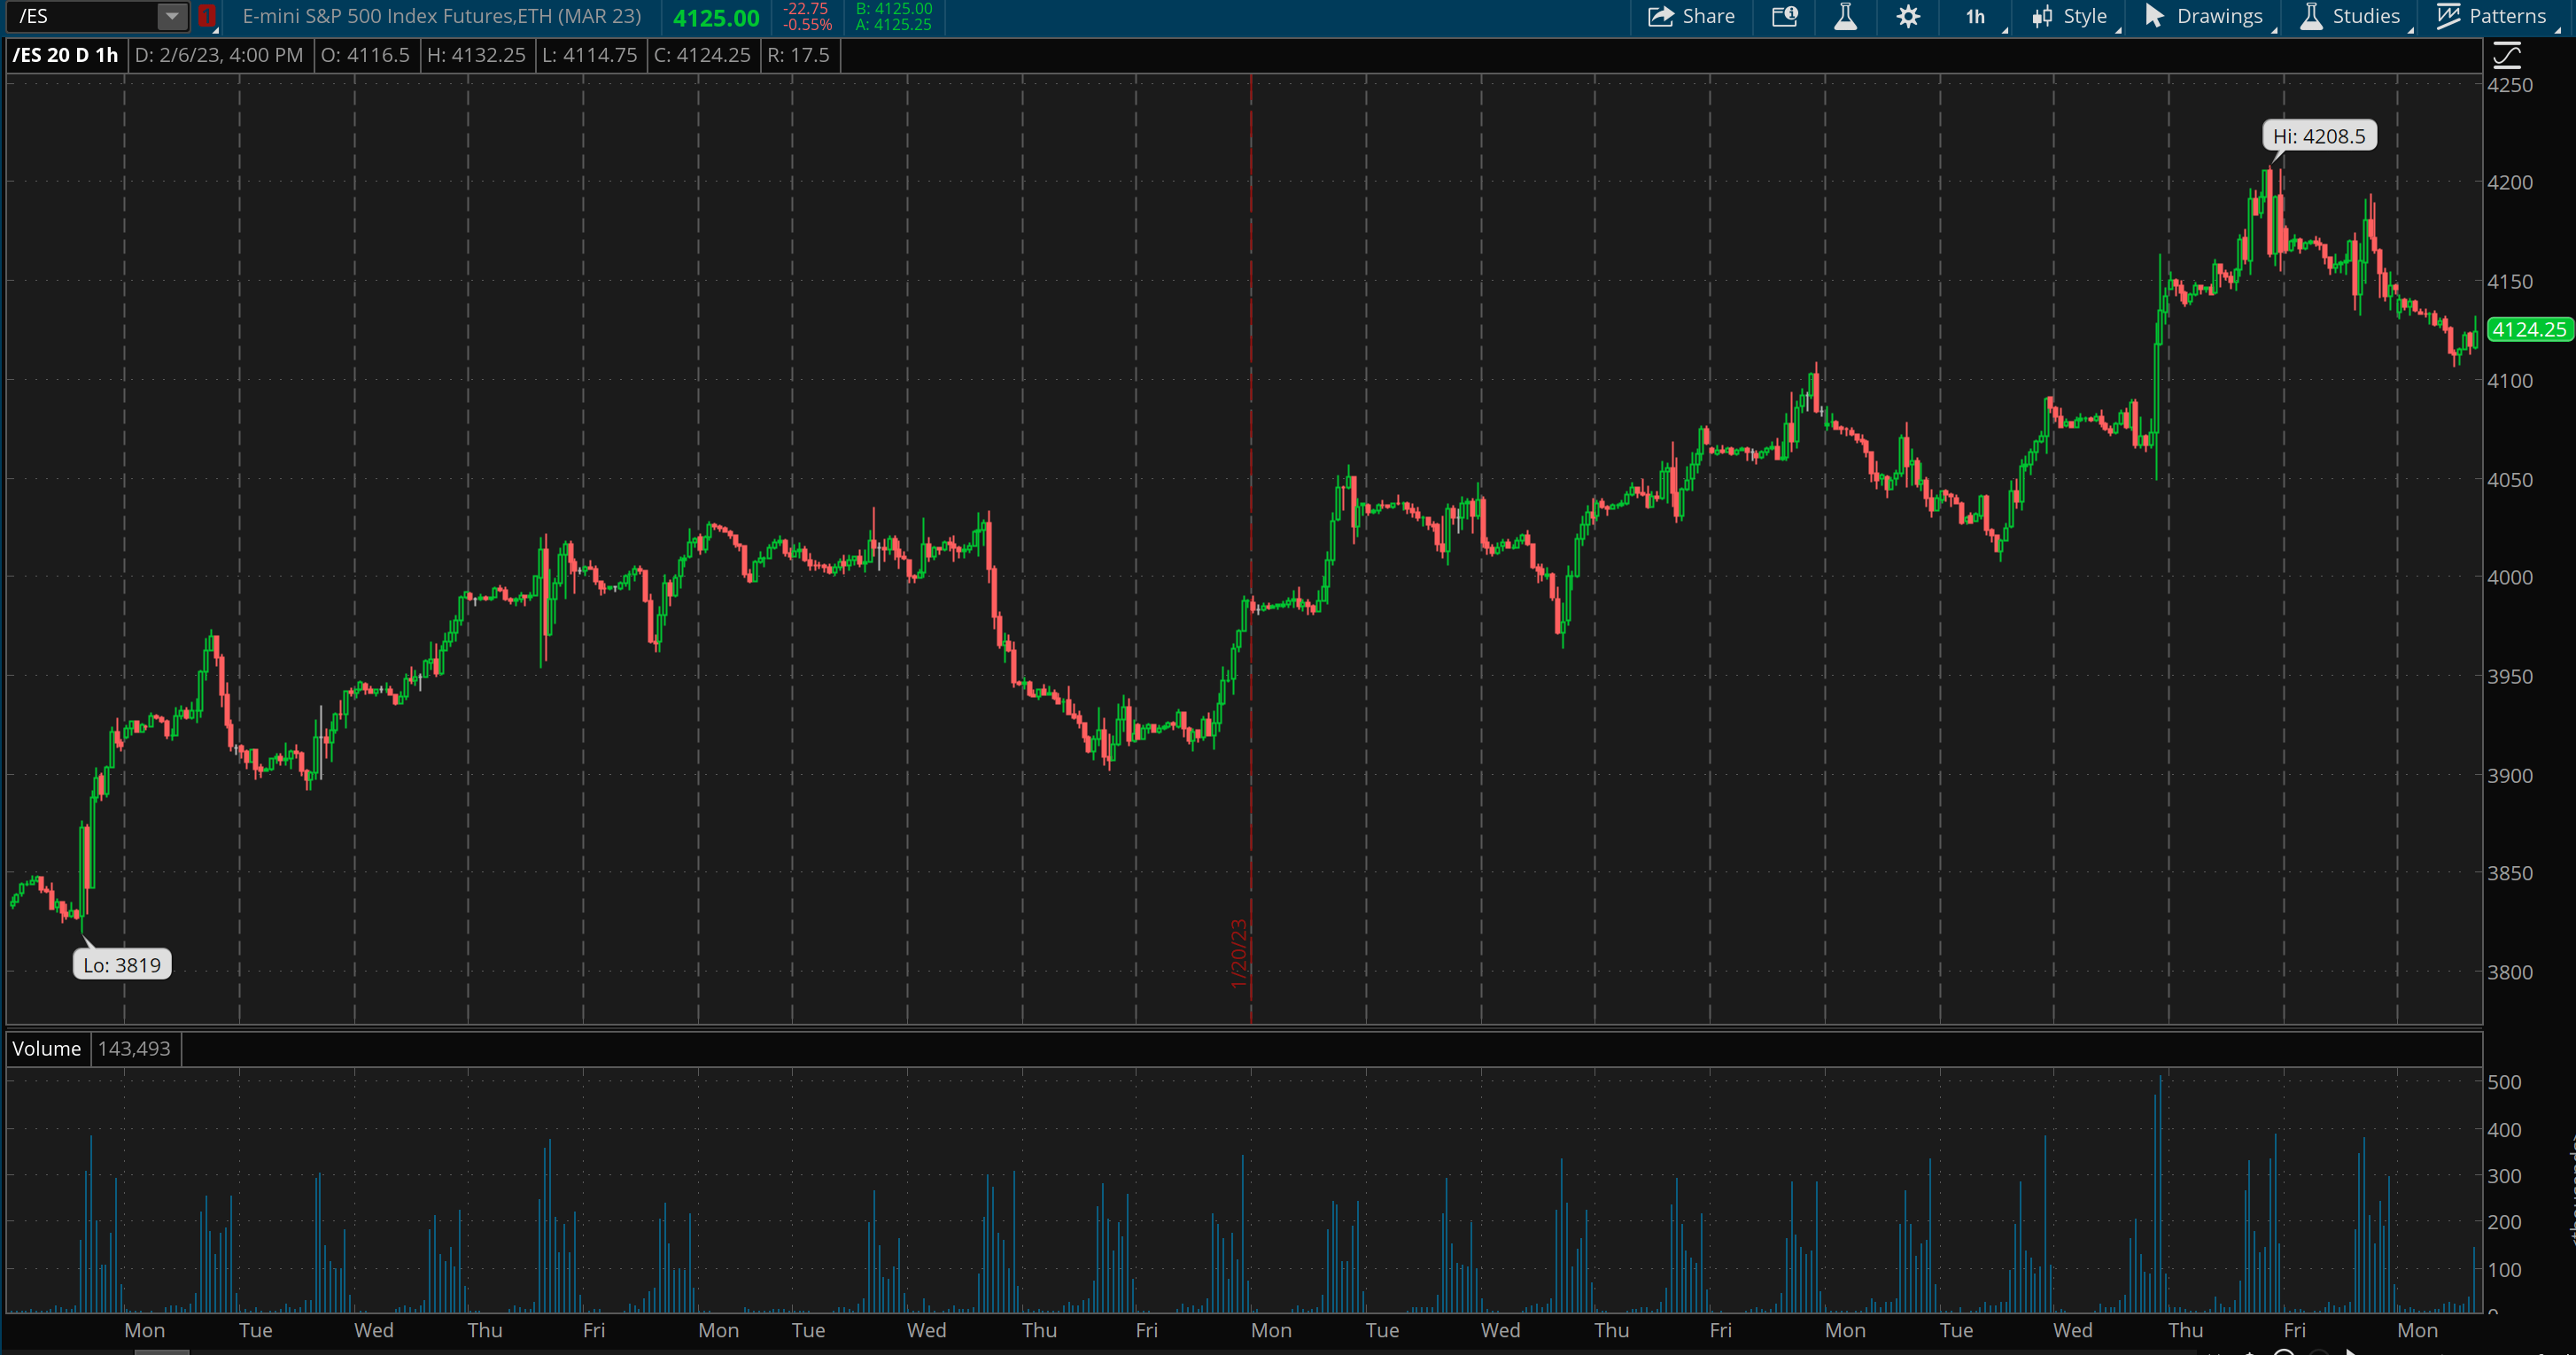
SPX (thinkorswim.com)
SPX had a nice smooth run from 3,800-4,200 in this second stage of the rally. Now, we need some critical levels to hold. 4,100-4,000 is the zone I am most concerned within the near term. Moreover, I already started taking preemptive profits in the AWP as SPX flirted with the recent peak at 4,200. If price action worsens, I will reduce more risk and initiate additional hedges. In a worse level scenario, we will see a breakdown of 4,000 and a retracement to at least 3,800, possibly 3,500 or lower after that. Much of the price action will depend on fundamental developments from the Fed, economic indicators, the consumer, inflation, the labor market, and other areas. Nevertheless, if the economy slows down and worsens more than expected, we can see the SPX bottom at 3,000-3,300 or lower in a worst-case outcome.
For further details see:
Oh No, Another Top Is Here