FBRT - Opportunity For Mortgage REITs
Summary
- In Q1 and Q2 spreads increased significantly, which contributed to a decline in book value.
- These are Treasury to MBS spreads, which are not the same as the Net Interest Spread.
- When the spreads are already this wide, it puts the mortgage REITs in a better position for protecting book value. The losses happen while the spreads are widening.
- The impact of wider spreads is positive for potential future earnings, but it doesn't flow through to net interest spreads right away.
- In the short term, investors may see growth in borrowing costs eating into earnings.
Get ready for charts, images, and tables because they are better than words. The ratings and outlooks we highlight here come after Scott Kennedy’s weekly updates in the REIT Forum. Your continued feedback is greatly appreciated, so please leave a comment with suggestions.
Last time, we discussed the spreads between MBS and Treasuries . These spreads are important because this is at the heart of how mortgage REITs aim to produce net interest income. They have three primary tools. They can take on credit risk, take on duration risk (hedging less duration exposure) or take on negative convexity risk (hurt by large movements in rates). Those are the three major types of risk that a mortgage REIT can use to generate income. No income is free or risk.
Whichever option the mortgage REIT chooses, they will also be taking on some risk to book value from spreads. Over time, we would normally see gains and losses in book value. We model book values on a weekly basis, so those changes rarely take us by surprise.
Net Interest Spread
Before we really dive into this article, I need to address that the increasing spreads today do not automatically translate into a higher value for NIS (Net Interest Spreads) tomorrow. A mortgage REIT won’t overhaul their portfolio every quarter or even every year. Due to the flattening of the yield curve and the way historical data feeds into interest income and interest expense, there can be a dramatic lag between when these conditions develop and when they flow through net interest spread. We are absolutely not making a prediction of mortgage REITs reporting higher NIS in the immediate future. Further, we are not suggesting that all dividends are safe. We see several with a significant chance of being reduced within the next few quarters.
The spreads we’re going to talk about today are the ones that can rapidly impact book value and determine the future income levels a mortgage REIT could generate using today’s book value.
It will be a pleasant surprise if no one jumped to the comment section already to misquote me and declare that “the author is wrong”.
MBS Spreads
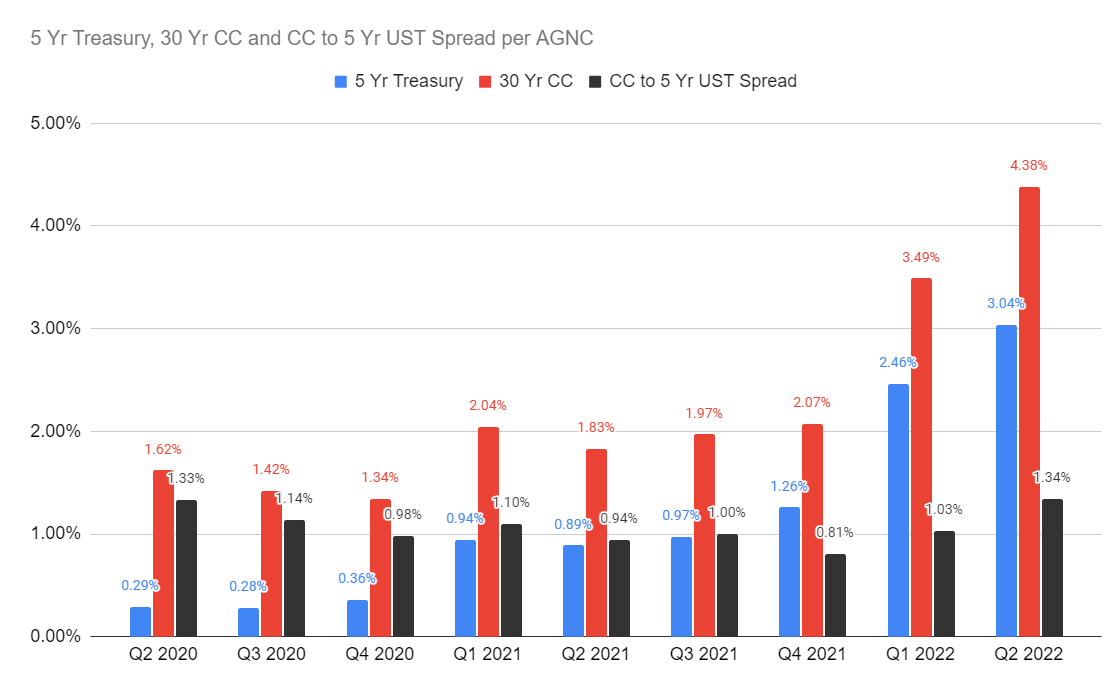
In the prior article, we used tables AGNC provided to contrast the spreads between Treasuries and fixed-rate MBS (mortgage-backed securities).
Using values from those slides, I built the following chart:
Note: Since the slides occasionally included conflicting data between Q4 2021 and Q2 2021, I used the Q4 2021 values.
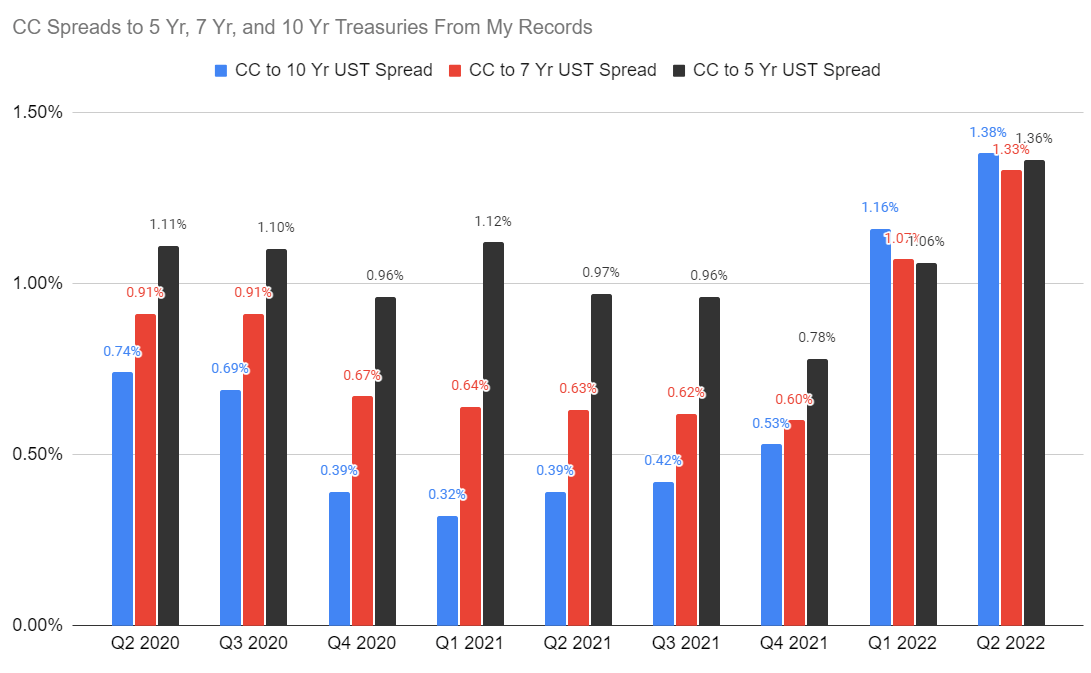
This chart gives you a feel for the spread (black line) between Treasury rates (blue line) and MBS rates (red line) at the end of each quarter. At the end of Q2 2022, the spread was comparable to the spread at the end of Q2 2020. By historical measurements, that’s big. I’ve often ran these spreads using the 10-year Treasury rate instead as well as the 5-year and 7-year rates. Here are the values I calculated:
The only material difference is Q2 2020. So why is that one so difficult? The lowest 30-year fixed-rate MBS pools we could find data on had a coupon rate of 2% and were trading at $102.2969. Since we did not have a single pool trading below $100, or even very close to it, finding a hypothetical price required extrapolating. The further we have to extrapolate, the less precise the results will become. I don’t think a guide on how to extrapolate in those scenarios would enhance this article, so I’ll leave it there.
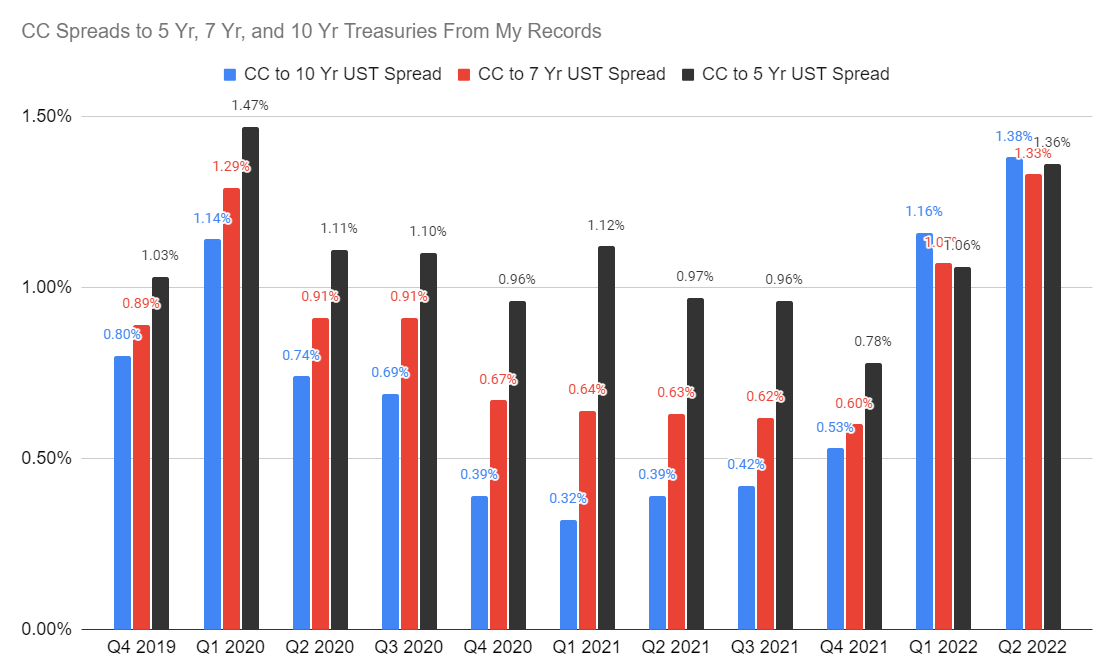
However, I do think it helps to expand the chart to include the spreads I calculated for Q4 2019 and Q1 2020:
The values for Q4 2019 and Q1 2020 provide some valuable historical context. We can clearly see that at the end of Q1 2020, spreads between the 5-year Treasury and the 30-year current coupon fixed-rate MBS were wider. Yet the spreads using the 7-year and 10-year Treasuries were actually thinner. What happened? The yield curve became severely inverted. Discount rates in the next few years are materially higher than discount rates further out. For instance, the 5-year Treasury yields 3.261% and the 10-year Treasury yields 3.114%.
Just using some back-of-the-envelope math suggests that the implied rate between 5-years and 10-years must be 2.97%. That’s actually pretty simple. The yield for the first 5 years (3.26%) is 15 basis points higher than the average over 10 years (3.11%). To offset the first 5 years being 15 basis points higher, the next 5 years must be 15 basis points lower. Adjusted for a rounding error, that give us 2.97%.
Why Did You Make Me Do Math?
This actually matters!
There are a few things I want you to understand:
- These spreads are very relevant to understanding how much income a mortgage REIT can generate income.
- When these spreads are tightening (black bar getting shorter), book value usually goes up.
- When these spreads are widening (black bars getting taller), book value usually goes down.
The sample period we’re using includes periods where the spreads were wide and periods where the spreads were tight. When spreads were wide, it was a better environment for investing. As spreads tightened, investors saw some material increases in book value per share. That created leveraged gains for investors buying in at bargain prices. They achieved a significant discount to book value (which would eventually narrow) and the book value was lower due to wider spreads. In the same manner, investors buying in at the top were often buying at a premium to book value while spreads were tight. Those investors experienced leveraged losses. In my experience, those investors tend to be more bitter about the experience.
While elevated short-term rates may push up borrowing costs due to incomplete hedging, investors shouldn't put too much emphasis on it. It's only one small part of the picture. I'll go into greater depth with comparisons between REITs in another article. For now, I think it is time to get onto mentioning a few picks.
A Few High Yield Picks
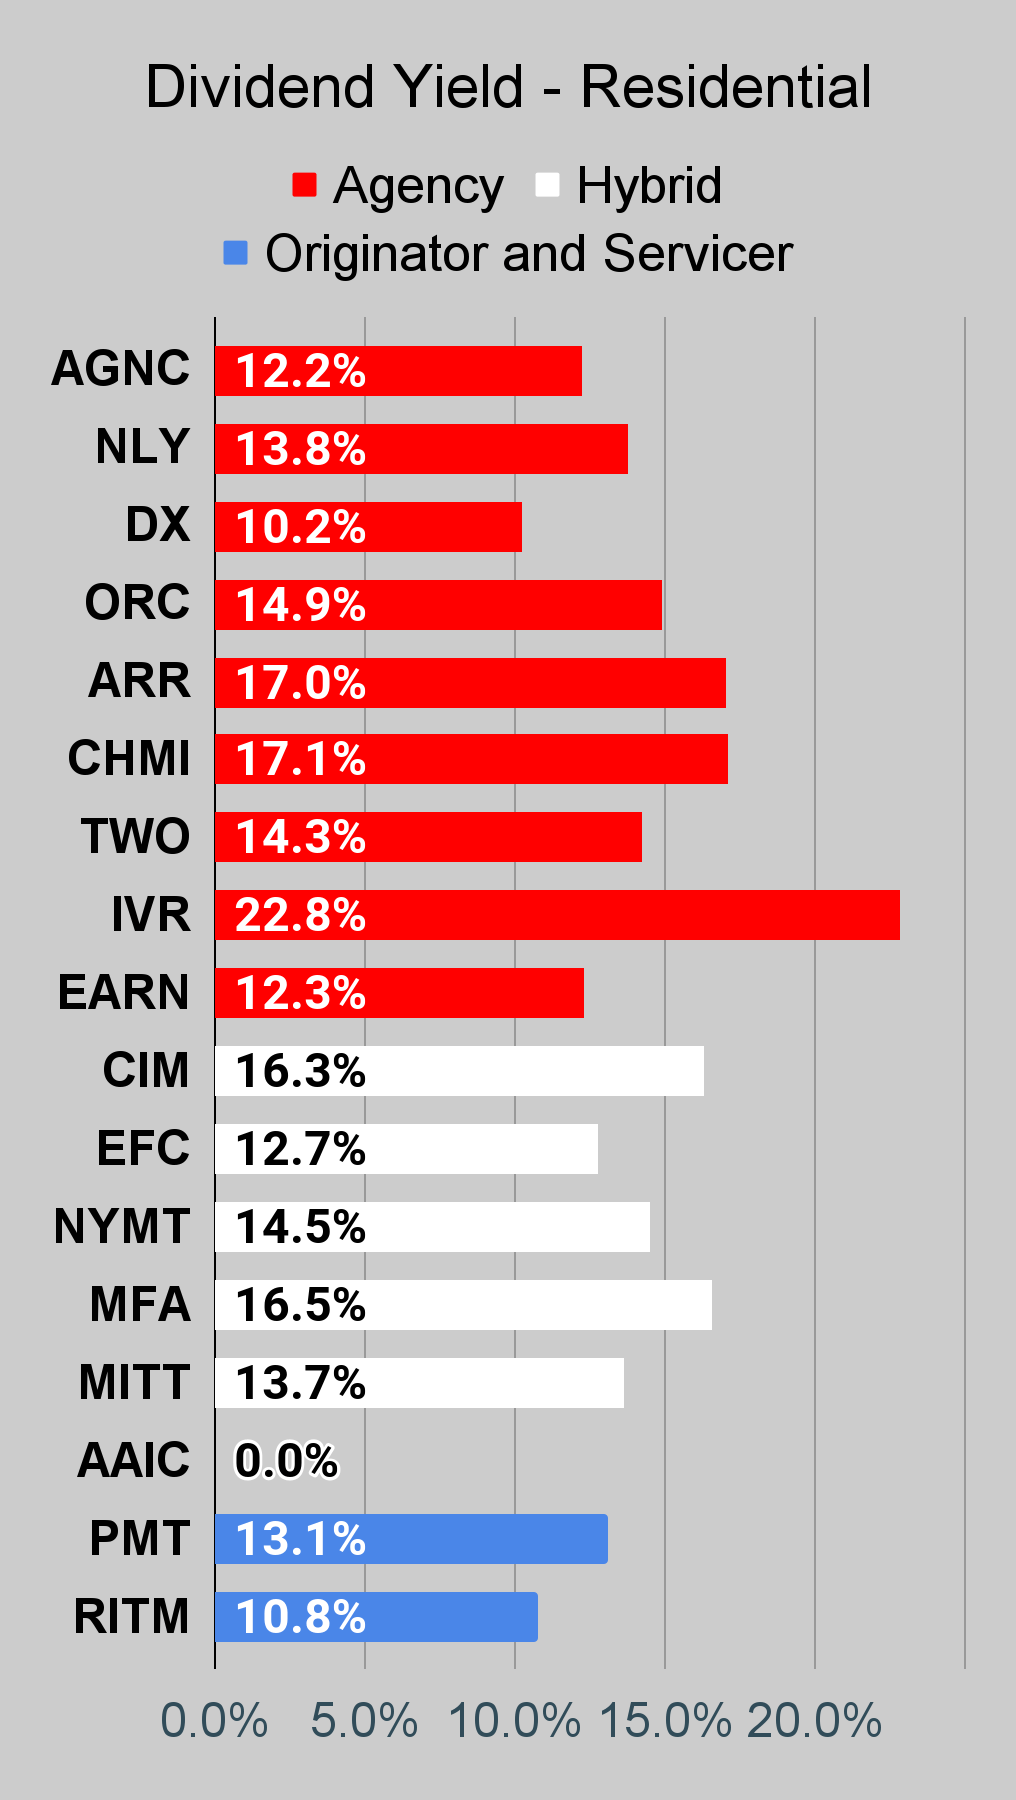
Investors always want at least a few picks, so I’ll give you a few I’m bullish on. I'm not listing the dividend yields, but you can find them in the charts below.
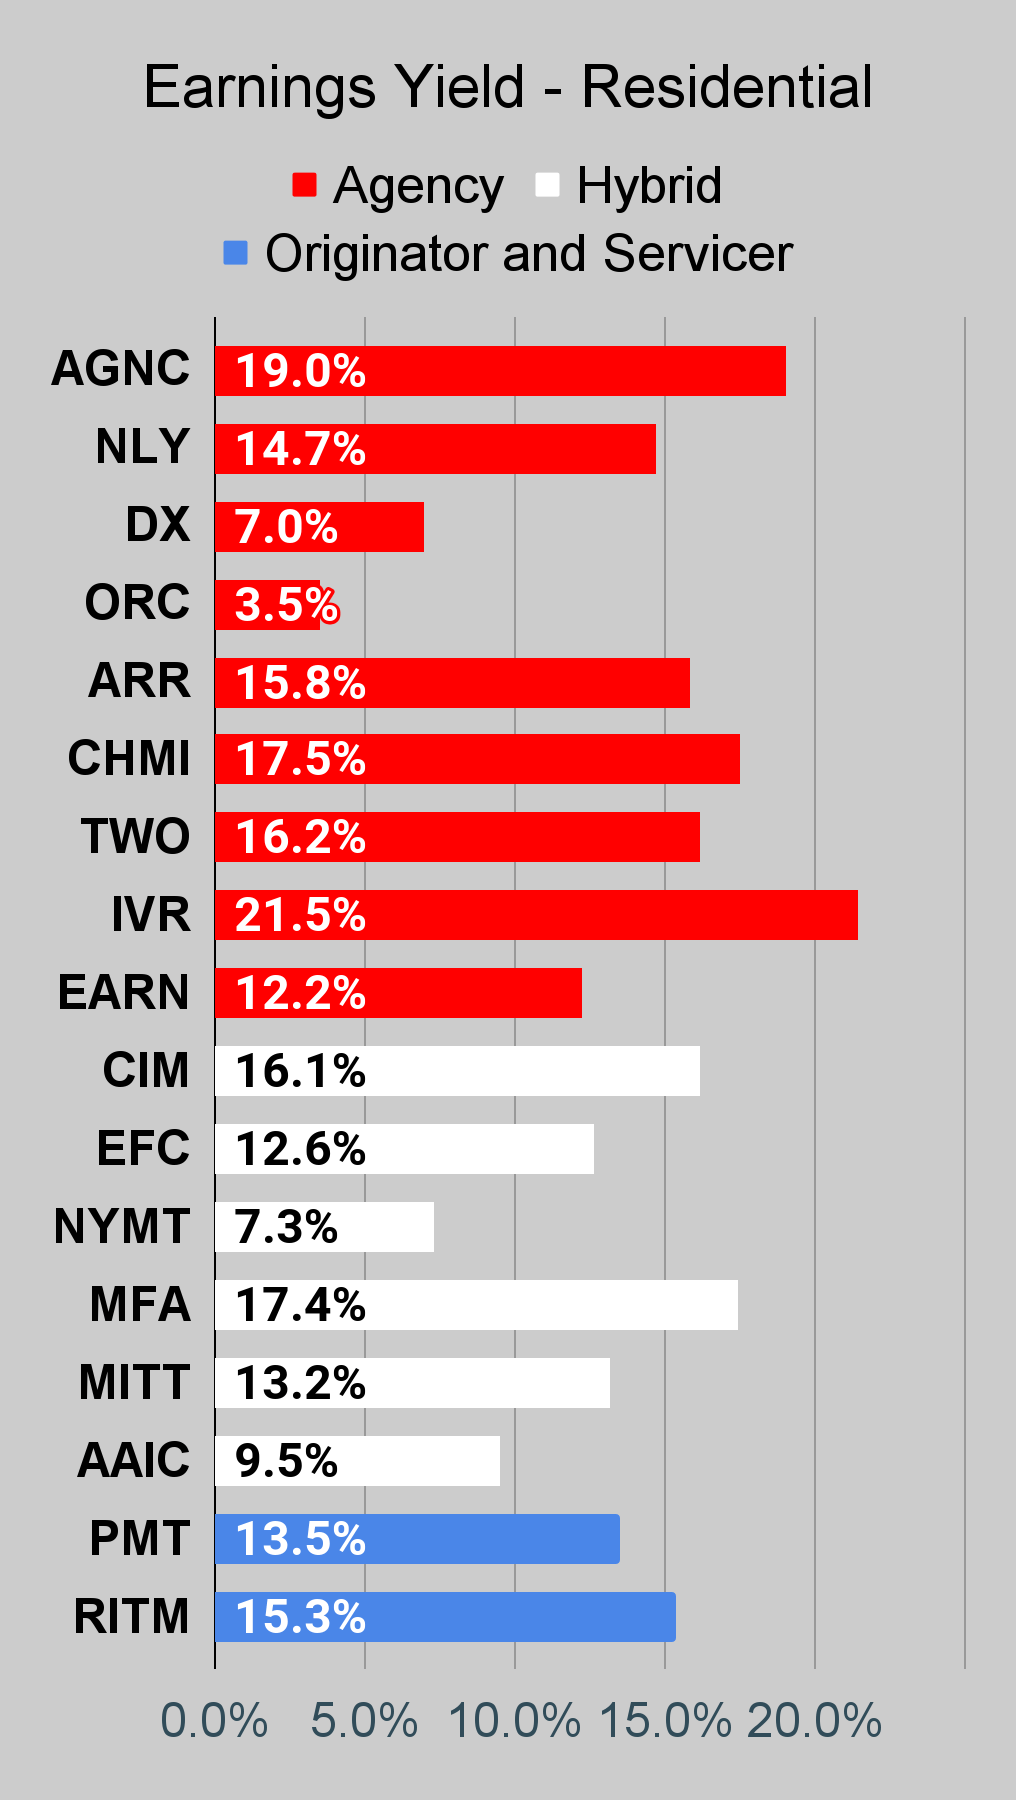
- I continue to like Dynex Capital ( DX ) as one of the best mortgage REITs. It’s a smaller agency mortgage REIT that smashed peers over many years due to superior portfolio management. The biggest mortgage REITs will be much slower in adjusting positions. However, DX, can be quicker (due to the smaller portfolio) to take advantage of a shift in the risk/reward profile.
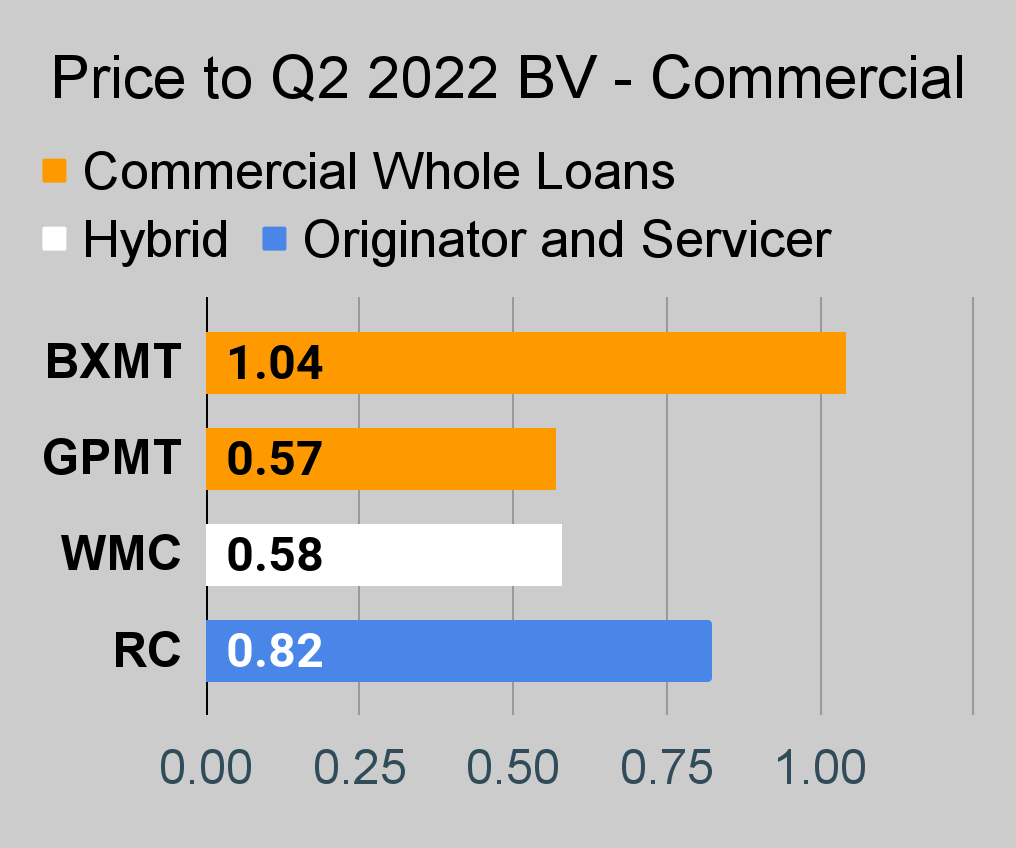
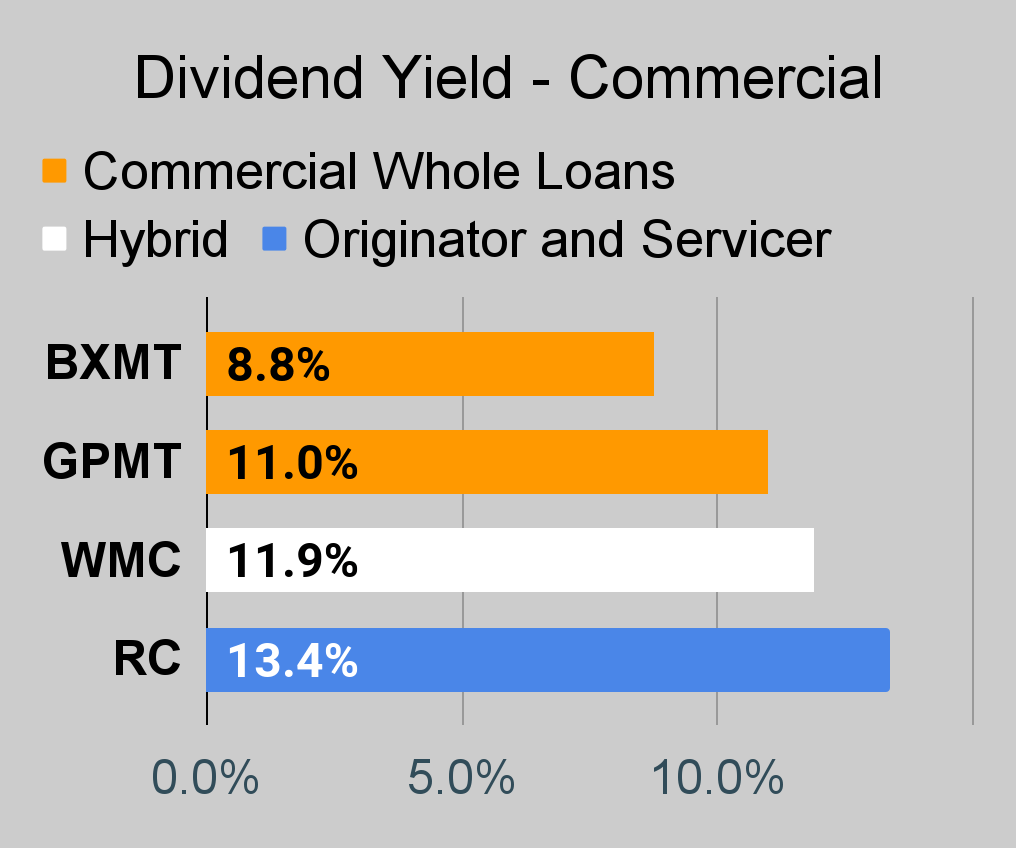
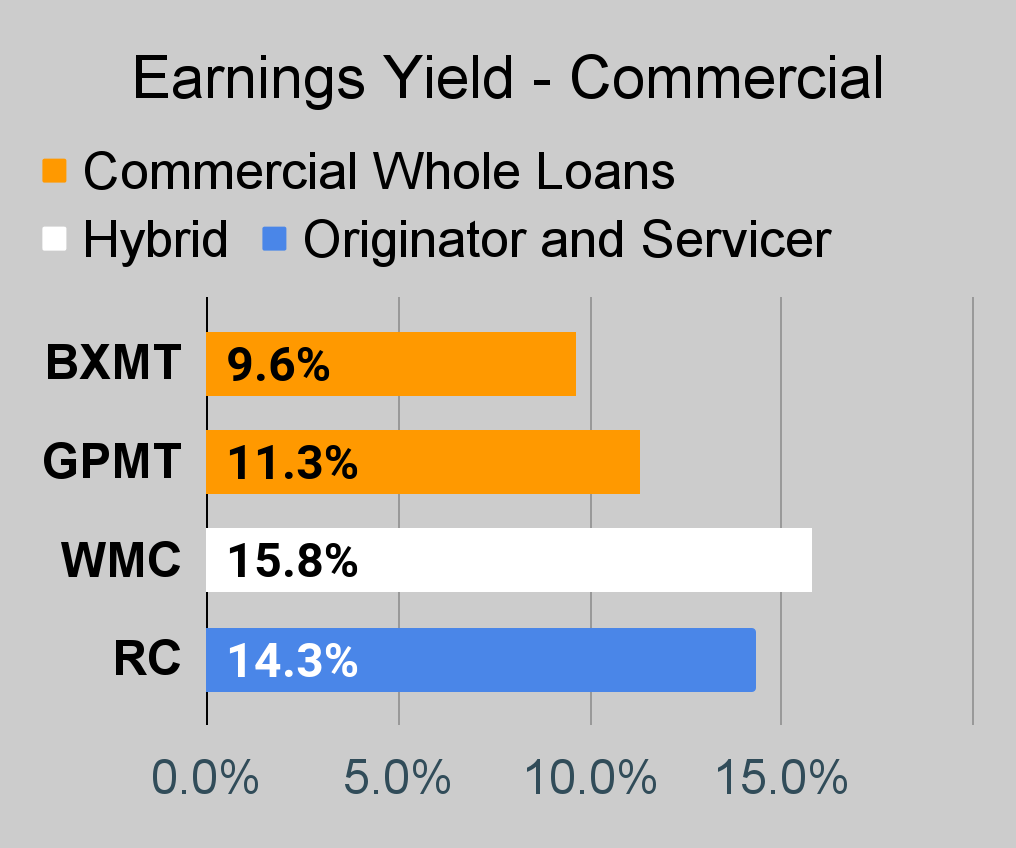
- Ready Capital ( RC ) looks great as well. They’ve done quite well and withstood some difficult environments with relatively minor damage to book value. Shares offer plenty of upside to be attractive.
- Rithm ( RITM ) gets mentioned yet again for the substantial discount. I recognize that mortgage origination isn’t attractive, though RITM is introducing 40-year interest only mortgages . Personally, I don’t love the existence of these products because I think high leverage for homeowners creates a potential incentive to default if home values fall significantly. However, this may enhance their origination activity and if inflation continues to increase the cost of building new housing, it creates support for home values (replacement cost) despite higher rates.
- MFA Financial ( MFA ) is still a good pick for investors willing to take on some credit risk. The upside in this pick is dramatic as shares trade at a huge discount to projected book value and to our targets.
The rest of the charts in this article may be self-explanatory to some investors. However, if you’d like to know more about them, you’re encouraged to see our notes for the series .
Stock Table
We will close out the rest of the article with the tables and charts we provide for readers to help them track the sector for both common shares and preferred shares.
We’re including a quick table for the common shares that will be shown in our tables:
| Type of REIT or BDC |
| Residential Agency |
| Residential Hybrid |
| Residential Originator and Servicer |
| Commercial |
| BDC |
Let the images begin!
Residential Mortgage REIT Charts
Note: The chart for our public articles uses the book value per share from the latest earnings release. Current estimated book value per share is used in reaching our targets and trading decisions. It is available in our service, but those estimates are not included in the charts below.
Commercial Mortgage REIT Charts
BDC Charts
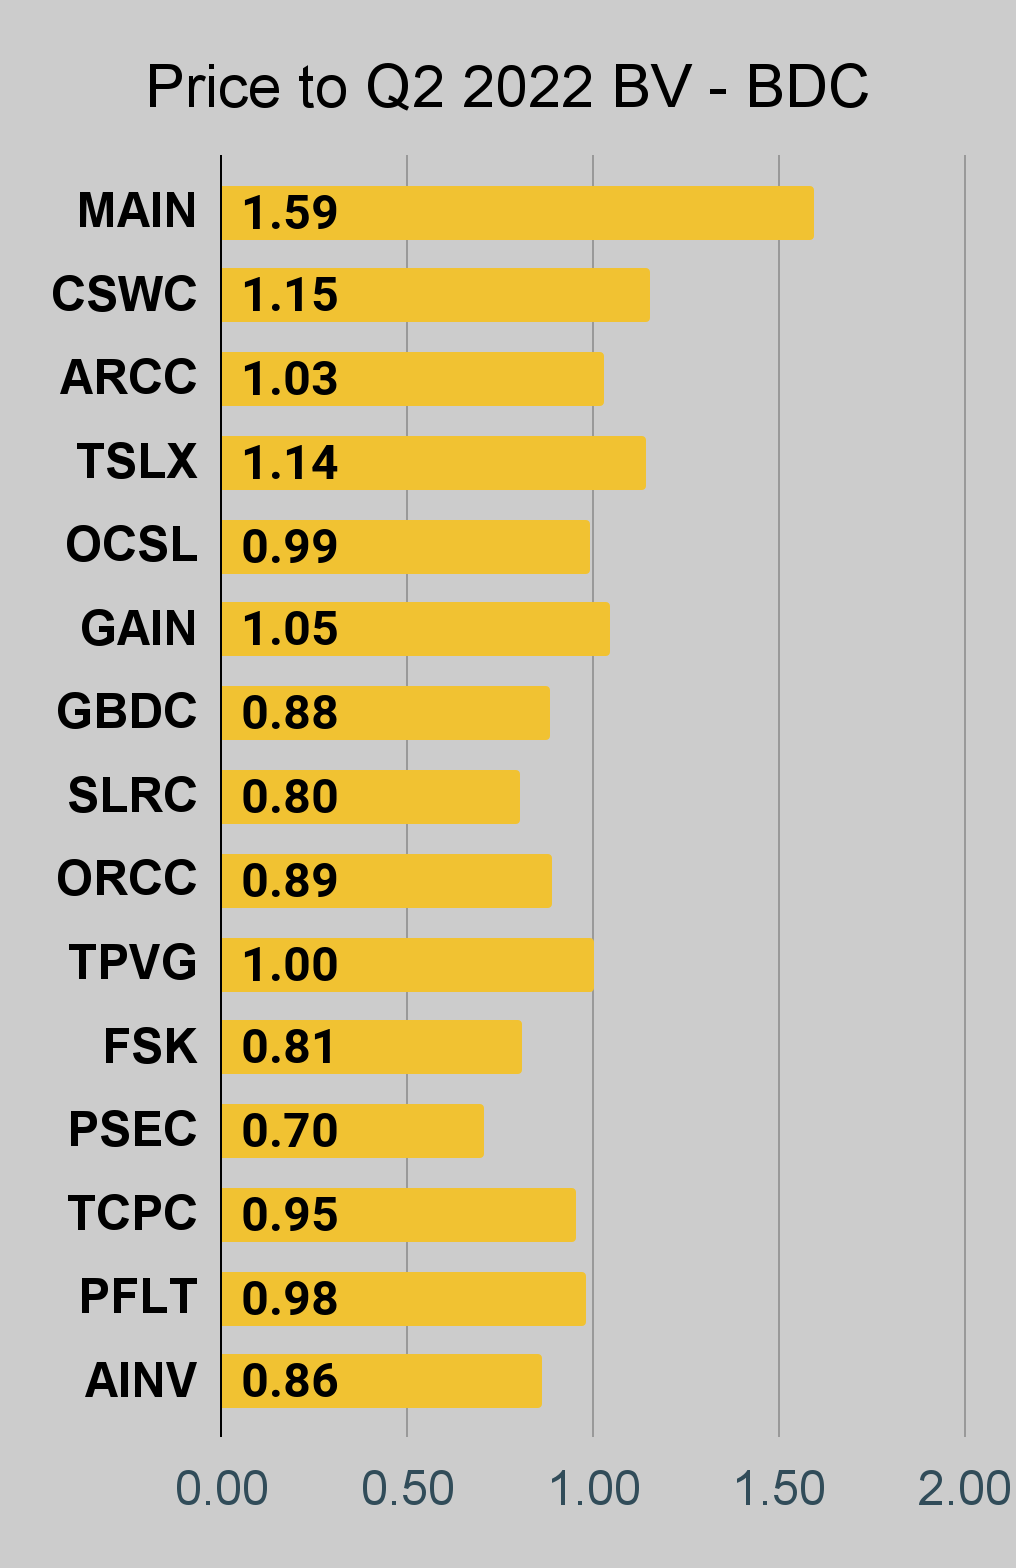
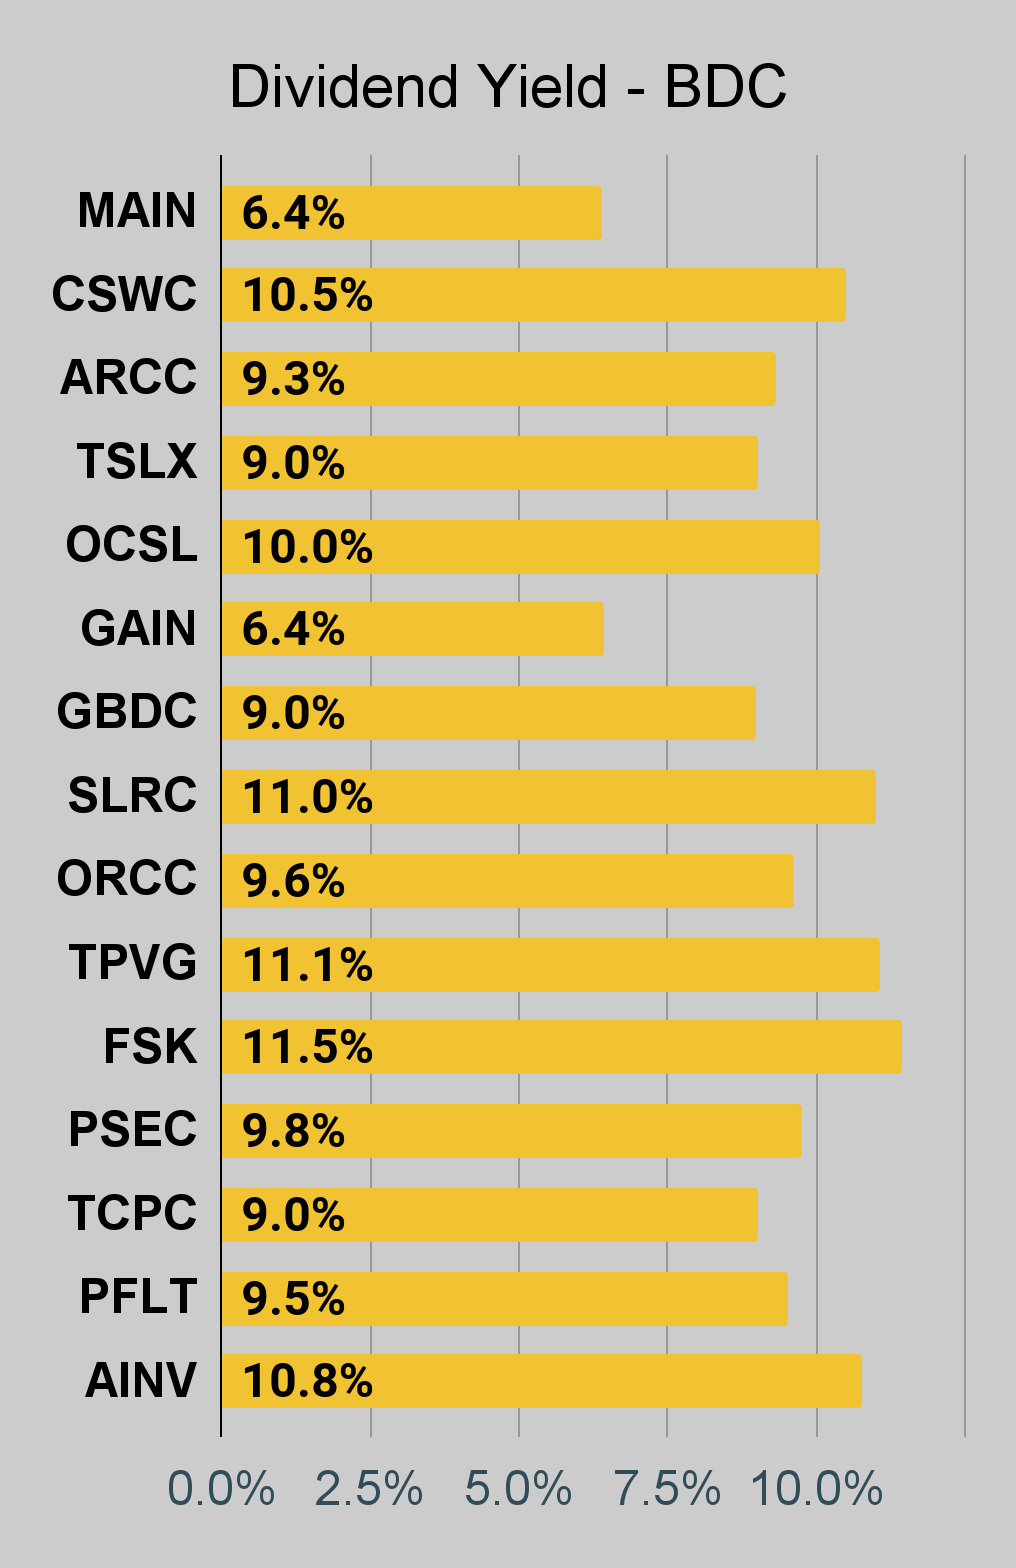
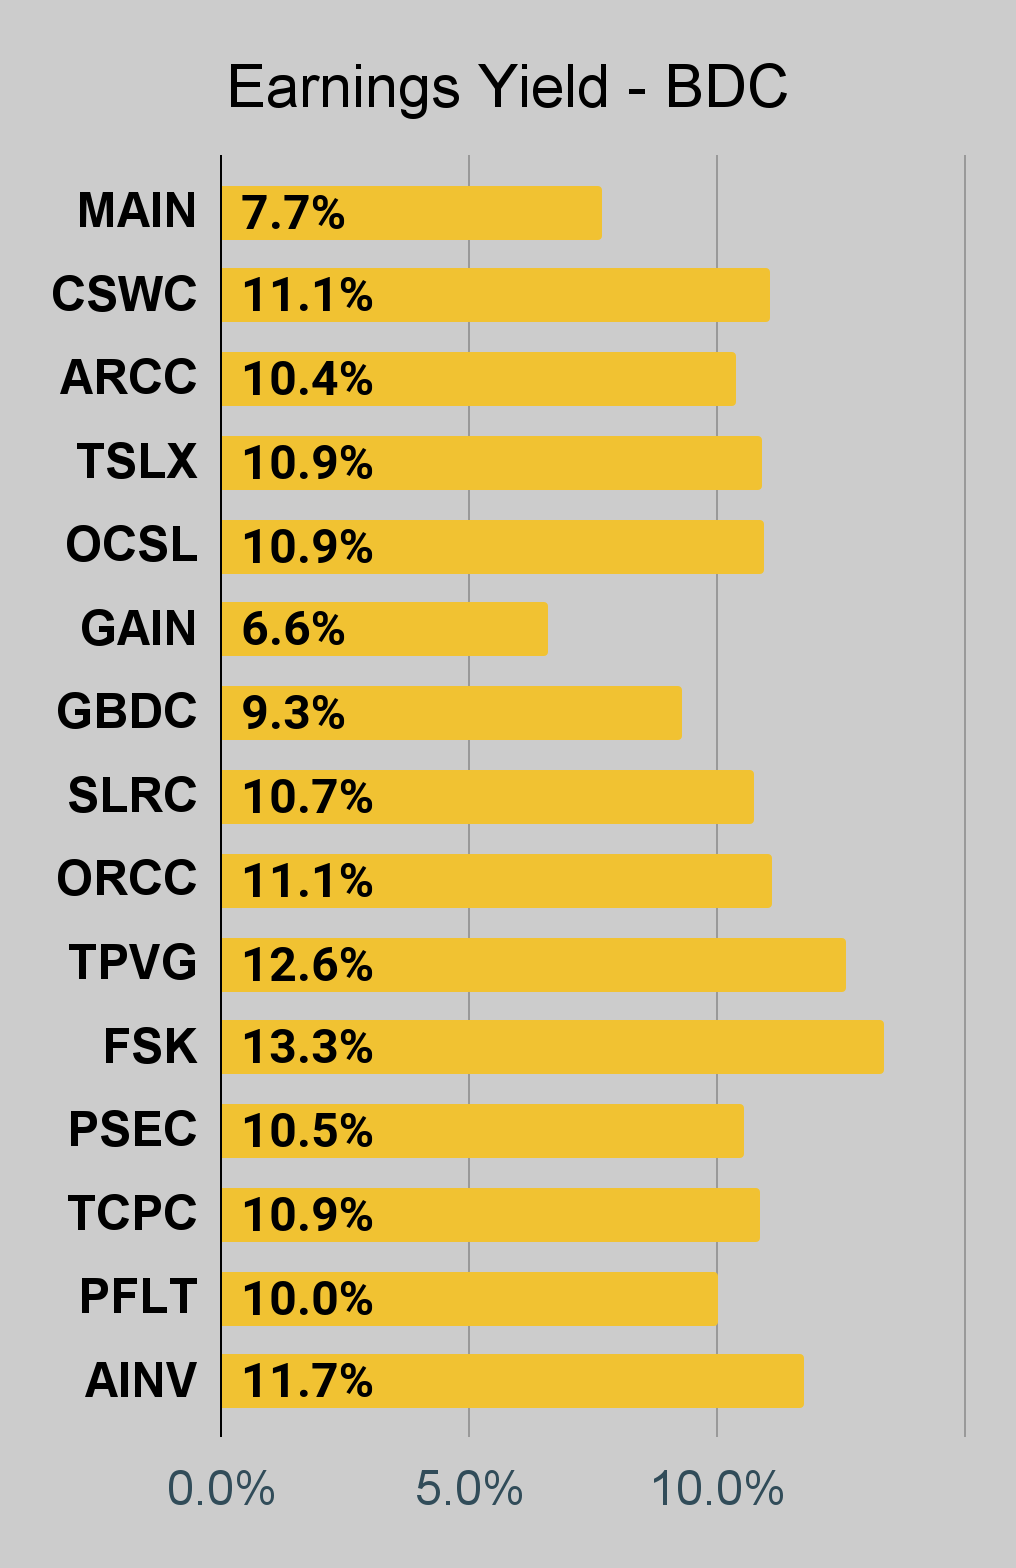
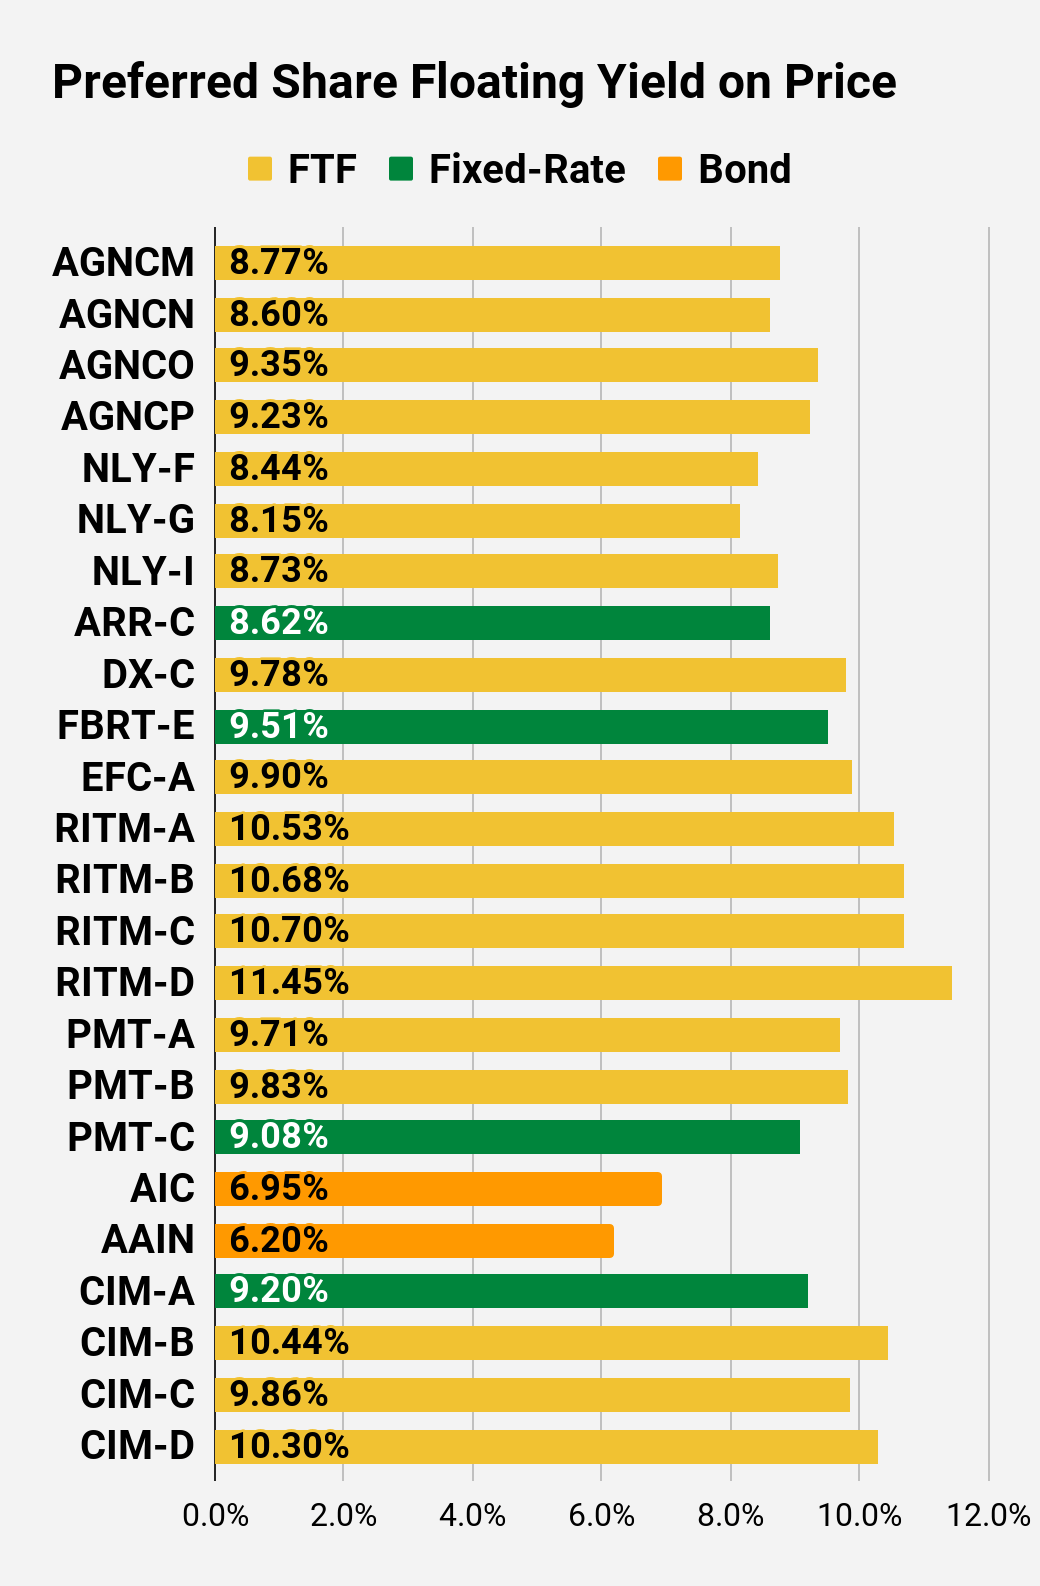
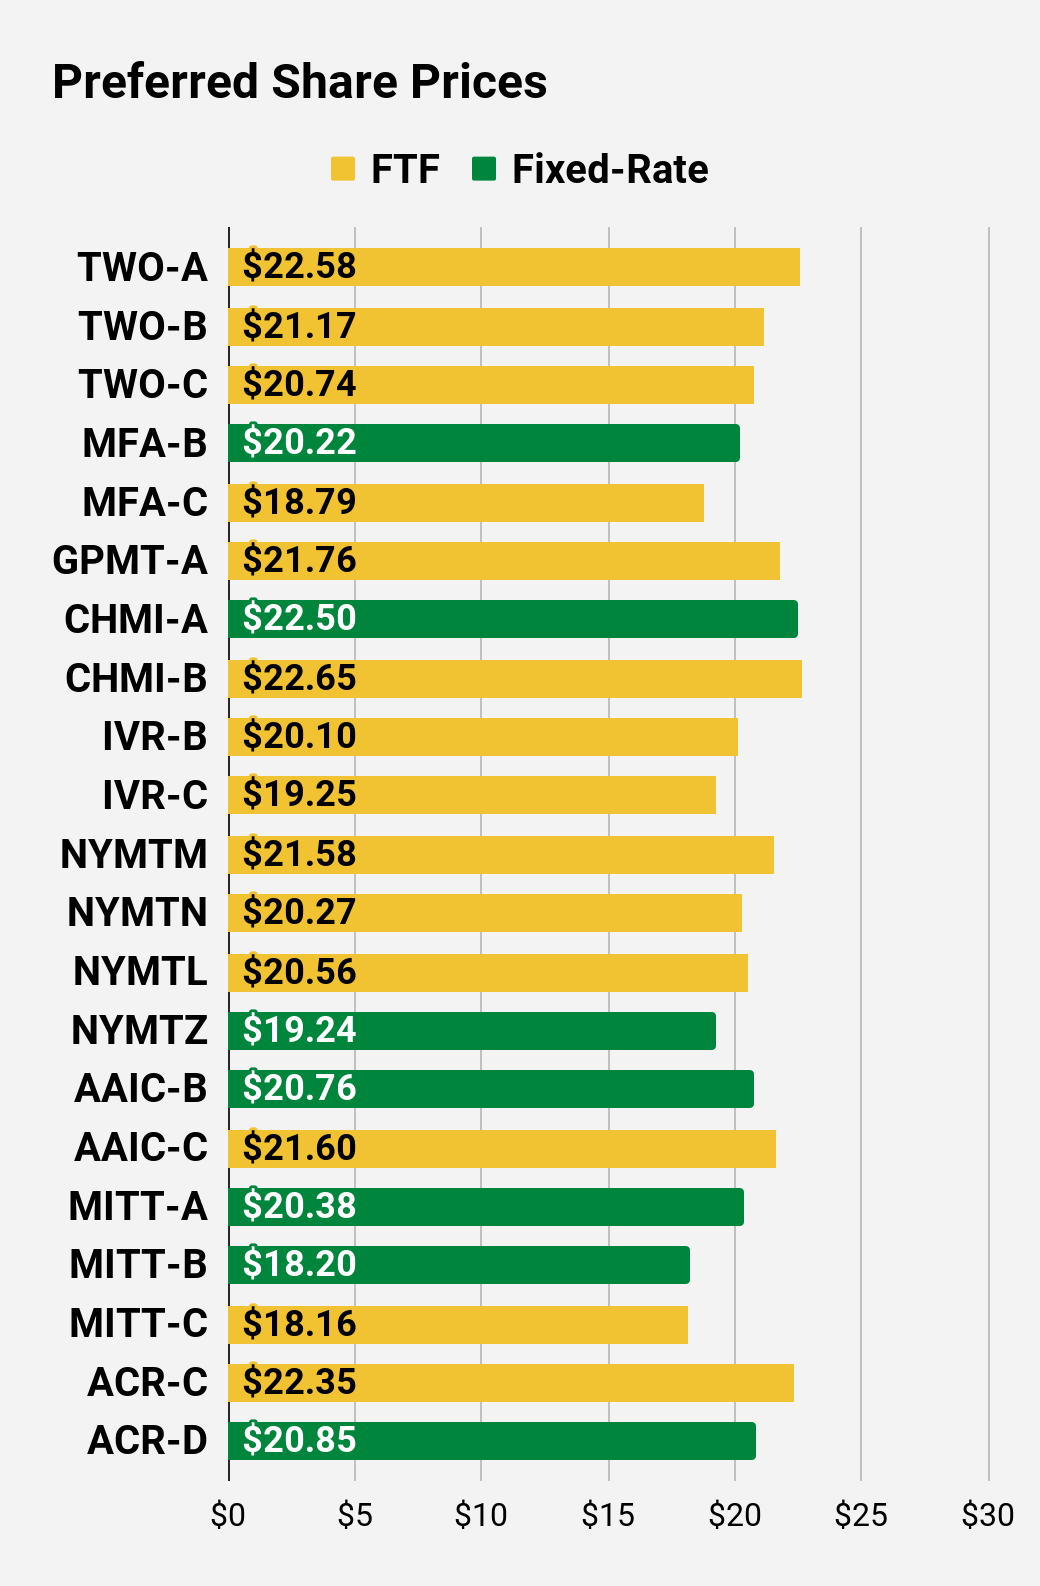
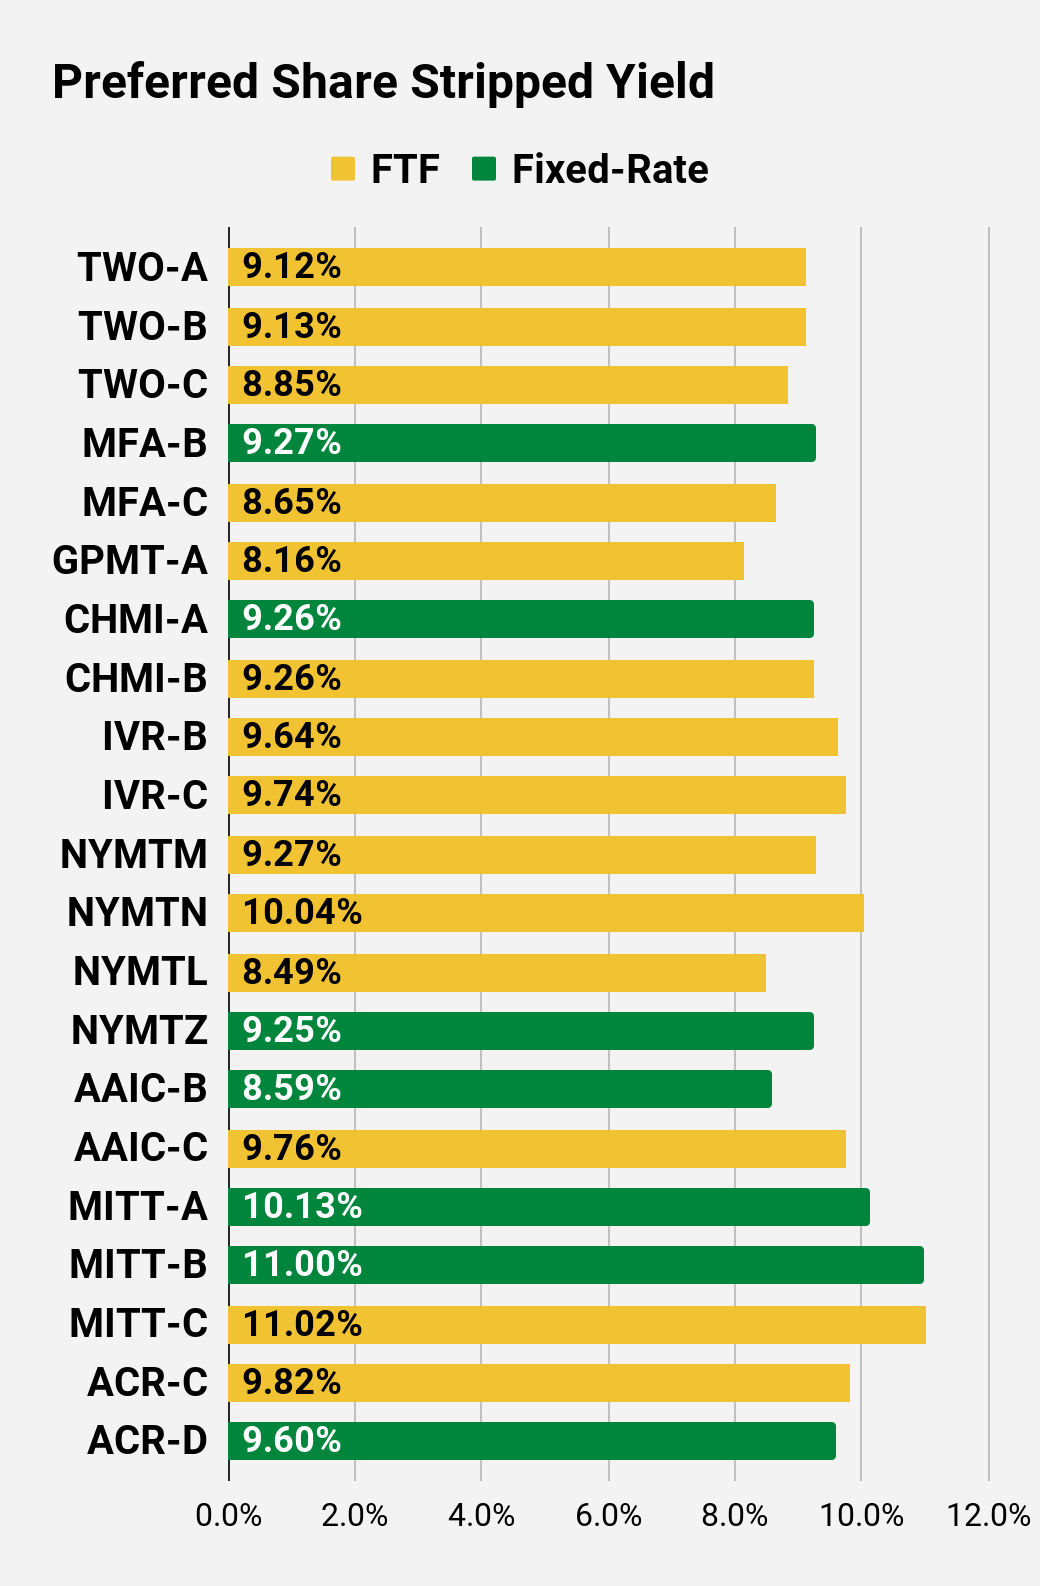
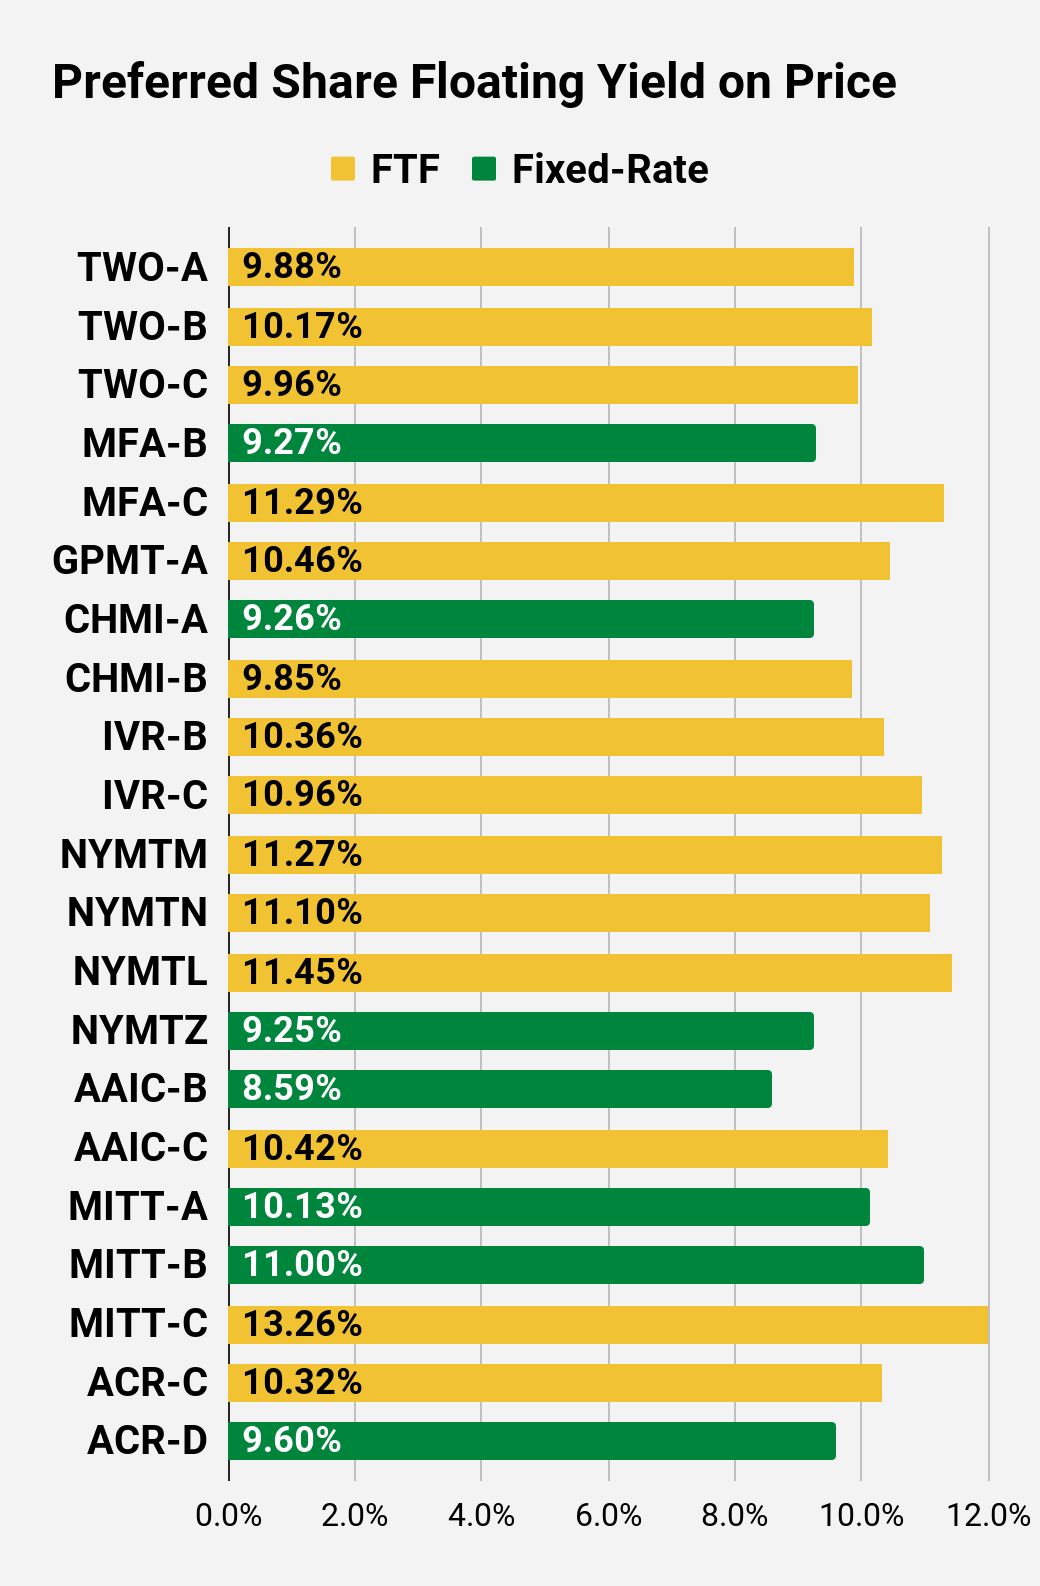
Preferred Share Charts
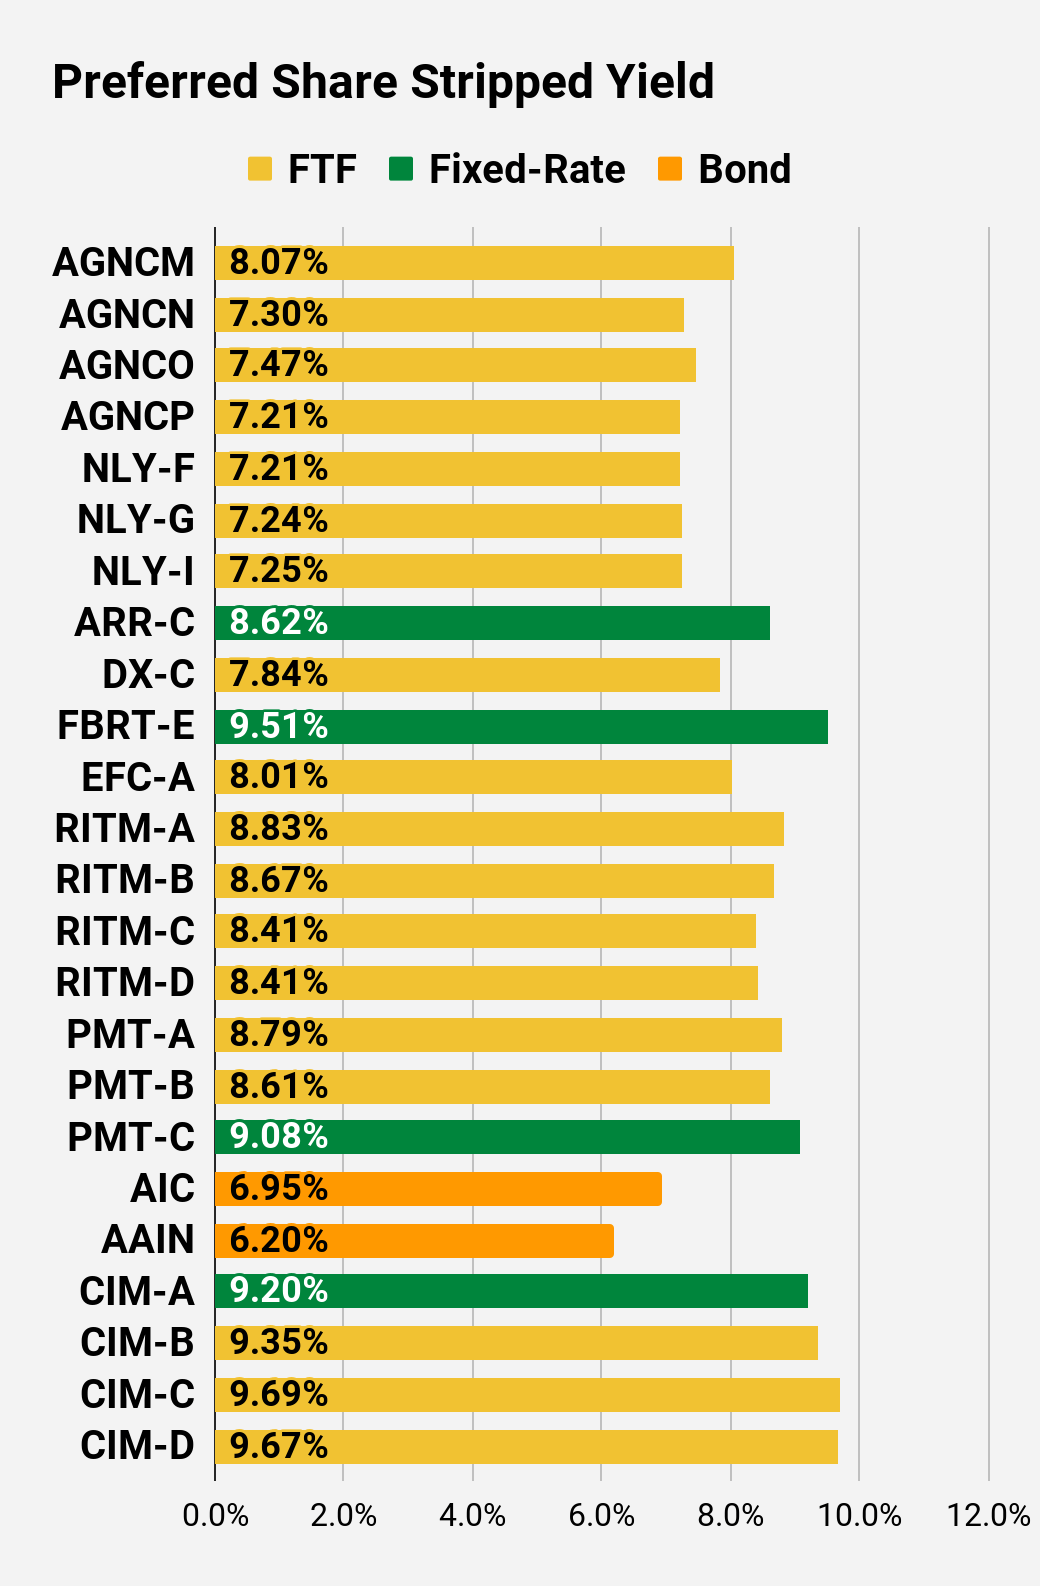
Preferred Share Data
Beyond the charts, we’re also providing our readers with access to several other metrics for the preferred shares.
After testing out a series on preferred shares, we decided to try merging it into the series on common shares. After all, we are still talking about positions in mortgage REITs. We don’t have any desire to cover preferred shares without cumulative dividends, so any preferred shares you see in our column will have cumulative dividends. You can verify that by using Quantum Online. We’ve included the links in the table below.
To better organize the table, we needed to abbreviate column names as follows:
- Price = Recent Share Price - Shown in Charts
- BoF = Bond or FTF (Fixed-to-Floating)
- S-Yield = Stripped Yield - Shown in Charts
- Coupon = Initial Fixed-Rate Coupon
- FYoP = Floating Yield on Price - Shown in Charts
- NCD = Next Call Date (the soonest shares could be called)
- Note: For all FTF issues, the floating rate would start on NCD.
- WCC = Worst Cash to Call (lowest net cash return possible from a call)
- QO Link = Link to Quantum Online Page
| Ticker |
| Price |
| BoF |
| S-Yield |
| Coupon |
| FYoP |
| NCD |
| WCC |
| QO Link |
| P-Link |
| $21.61 |
| FTF |
| 8.07% |
| 6.88% |
| 8.77% |
| 4/15/2024 |
| $6.41 |
| $24.30 |
| FTF |
| 7.30% |
| 7.00% |
| 8.60% |
| 10/15/2022 |
| $1.14 |
| $22.04 |
| FTF |
| 7.47% |
| 6.50% |
| 9.35% |
| 10/15/2024 |
| $6.63 |
| $21.52 |
| FTF |
| 7.21% |
| 6.13% |
| 9.23% |
| 4/15/2025 |
| $7.70 |
| $24.11 |
| FTF |
| 7.21% |
| 6.95% |
| 8.44% |
| 10/2/2022 |
| $0.90 |
| $22.45 |
| FTF |
| 7.24% |
| 6.50% |
| 8.15% |
| 3/31/2023 |
| $3.36 |
| $23.30 |
| FTF |
| 7.25% |
| 6.75% |
| 8.73% |
| 6/30/2024 |
| $4.65 |
| $20.40 |
| 8.62% |
| 7.00% |
| 8.62% |
| 1/28/2025 |
| $8.84 |
| $22.30 |
| FTF |
| 7.84% |
| 6.90% |
| 9.78% |
| 4/15/2025 |
| $7.44 |
| $20.05 |
| 9.51% |
| 7.50% |
| 9.51% |
| 10/2/2022 |
| $5.35 |
| $21.36 |
| FTF |
| 8.01% |
| 6.75% |
| 9.90% |
| 10/30/2024 |
| $7.52 |
| $21.50 |
| FTF |
| 8.83% |
| 7.50% |
| 10.53% |
| 8/15/2024 |
| $7.27 |
| $20.80 |
| FTF |
| 8.67% |
| 7.13% |
| 10.68% |
| 8/15/2024 |
| $7.78 |
| $19.17 |
| FTF |
| 8.41% |
| 6.38% |
| 10.70% |
| 2/15/2025 |
| $9.84 |
| $21.04 |
| FTF |
| 8.41% |
| 7.00% |
| 11.45% |
| 11/15/2026 |
| $11.42 |
| $23.12 |
| FTF |
| 8.79% |
| 8.13% |
| 9.71% |
| 3/15/2024 |
| $4.92 |
| $23.25 |
| FTF |
| 8.61% |
| 8.00% |
| 9.83% |
| 6/15/2024 |
| $5.25 |
| $18.59 |
| 9.08% |
| 6.75% |
| 9.08% |
| 8/24/2026 |
| $13.06 |
| $24.30 |
| Bond |
| 6.95% |
| 6.75% |
| 6.95% |
| 10/2/2022 |
| $0.76 |
| $24.39 |
| Bond |
| 6.20% |
| 6.00% |
| 6.20% |
| 8/1/2023 |
| $2.11 |
| $21.74 |
| 9.20% |
| 8.00% |
| 9.20% |
| 10/2/2022 |
| $3.35 |
| $21.40 |
| FTF |
| 9.35% |
| 8.00% |
| 10.44% |
| 3/30/2024 |
| $6.68 |
| $20.00 |
| FTF |
| 9.69% |
| 7.75% |
| 9.86% |
| 9/30/2025 |
| $10.90 |
| $20.70 |
| FTF |
| 9.67% |
| 8.00% |
| 10.30% |
| 03/30/2024 |
| $7.38 |
Second Batch:
| Ticker |
| Price |
| BoF |
| S-Yield |
| Coupon |
| FYoP |
| NCD |
| WCC |
| QO Link |
| P-Link |
| $22.58 |
| FTF |
| 9.12% |
| 8.13% |
| 9.88% |
| 04/27/2027 |
| $12.07 |
| $21.17 |
| FTF |
| 9.13% |
| 7.63% |
| 10.17% |
| 07/27/2027 |
| $13.36 |
| $20.74 |
| FTF |
| 8.85% |
| 7.25% |
| 9.96% |
| 1/27/2025 |
| $8.80 |
| $20.22 |
| 9.27% |
| 7.50% |
| 9.27% |
| 10/2/2022 |
| $4.79 |
| $18.79 |
| FTF |
| 8.65% |
| 6.50% |
| 11.29% |
| 3/31/2025 |
| $10.27 |
| $21.76 |
| FTF |
| 8.16% |
| 7.00% |
| 10.46% |
| 11/30/2026 |
| $10.89 |
| $22.50 |
| 9.26% |
| 8.20% |
| 9.26% |
| 10/2/2022 |
| $2.87 |
| $22.65 |
| FTF |
| 9.26% |
| 8.25% |
| 9.85% |
| 4/15/2024 |
| $5.89 |
| $20.10 |
| FTF |
| 9.64% |
| 7.75% |
| 10.36% |
| 12/27/2024 |
| $9.28 |
| $19.25 |
| FTF |
| 9.74% |
| 7.50% |
| 10.96% |
| 9/27/2027 |
| $15.15 |
| $21.58 |
| FTF |
| 9.27% |
| 7.88% |
| 11.27% |
| 1/15/2025 |
| $8.35 |
| $20.27 |
| FTF |
| 10.04% |
| 8.00% |
| 11.10% |
| 10/15/2027 |
| $15.23 |
| $20.56 |
| FTF |
| 8.49% |
| 6.88% |
| 11.45% |
| 10/15/2026 |
| $11.75 |
| $19.24 |
| 9.25% |
| 7.00% |
| 9.25% |
| 1/15/2027 |
| $13.64 |
| $20.76 |
| 8.59% |
| 7.00% |
| 8.59% |
| 10/2/2022 |
| $4.63 |
| $21.60 |
| FTF |
| 9.76% |
| 8.25% |
| 10.42% |
| 3/30/2024 |
| $6.94 |
| $20.38 |
| 10.13% |
| 8.25% |
| 10.13% |
| 10/2/2022 |
| $4.66 |
| $18.20 |
| 11.00% |
| 8.00% |
| 11.00% |
| 10/2/2022 |
| $6.84 |
| $18.16 |
| FTF |
| 11.02% |
| 8.00% |
| 13.26% |
| 9/17/2024 |
| $10.81 |
| $22.35 |
| FTF |
| 9.82% |
| 8.63% |
| 10.32% |
| 7/30/2024 |
| $6.97 |
| $20.85 |
| 9.60% |
| 7.88% |
| 9.60% |
| 5/21/2026 |
| $11.66 |
Strategy
Our goal is to maximize total returns . We achieve those most effectively by including “trading” strategies. We regularly trade positions in the mortgage REIT common shares and BDCs because:
- Prices are inefficient.
- Long-term, share prices generally revolve around book value.
- Short-term, price-to-book ratios can deviate materially.
- Book value isn’t the only step in analysis, but it is the cornerstone.
We also allocate to preferred shares and equity REITs. We encourage buy-and-hold investors to consider using more preferred shares and equity REITs.
Performance
We compare our performance against 4 ETFs that investors might use for exposure to our sectors:
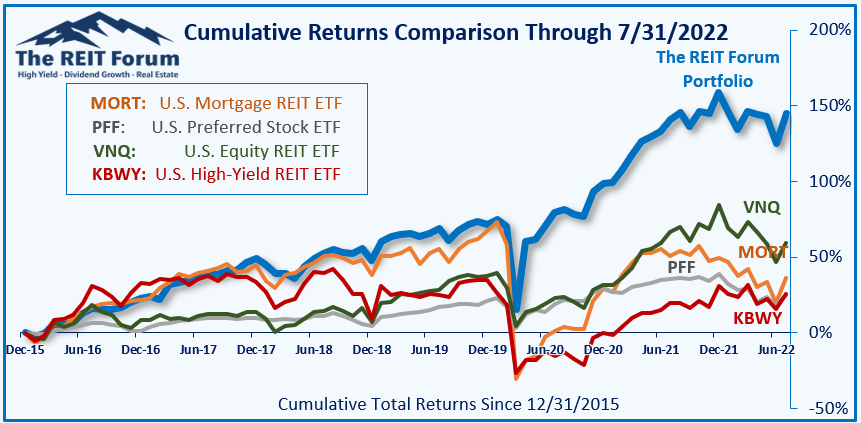
The 4 ETFs we use for comparison are:
| Ticker |
| Exposure |
| One of the largest mortgage REIT ETFs |
| One of the largest preferred share ETFs |
| Largest equity REIT ETF |
| The high-yield equity REIT ETF. Yes, it has been dreadful. |
When investors think it isn’t possible to earn solid returns in preferred shares or mortgage REITs, we politely disagree. The sector has plenty of opportunities, but investors still need to be wary of the risks. We can’t simply reach for yield and hope for the best. When it comes to common shares, we need to be even more vigilant to protect our principal by regularly watching prices and updating estimates for book value and price targets.
Ratings:
- Bullish on DX, RC, RITM, MFA
For further details see:
Opportunity For Mortgage REITs