PSLV - Palm Valley Capital Fund Q3 2023 Commentary
2023-10-13 08:45:00 ET
Summary
- The Palm Valley Capital Fund invests in small cap stocks. While our Fund is new, its underlying absolute return-based investment strategy is not. We have practiced the same strategy throughout our careers in investment management.
- The 10-year Treasury yield has risen to 4.6%, impacting the housing market and increasing financial pressure on indebted businesses and citizens.
- Higher interest rates are freezing up the overleveraged economy and splitting it apart, leading to potential defaults and economic carnage.
- Small cap banks are at risk due to the sinking commercial real estate market, while small cap stocks are trading at inflated valuations and may have further downside potential.
INVESTMENT PERFORMANCE (%) as of September 30, 2023
| Total Return |
| Annualized Return |
| Inception |
| Quarter YTD |
| 1 Year |
| 3 Year |
| Inception |
| Palm Valley Capital Fund |
| 4/30/19 |
| 0.56% |
| 5.26% |
| 9.32% |
| 6.02% |
| 7.22% |
| S&P SmallCap 600 Index |
| -4.93% |
| 0.81% |
| 10.08% |
| 12.11% |
| 5.45% |
| Morningstar Small Cap Index |
| -4.56% |
| 5.71% |
| 14.22% |
| 9.02% |
| 4.75% |
| Performance data quoted represents past performance; past performance does not guarantee future results. The investment return and principal value of an investment will fluctuate so that an investor’s shares, when redeemed, may be worth more or less than their original cost. Current performance of the Fund may be higher or lower than the performance quoted. Performance of the Fund current to the most recent quarterend can be obtained by calling 904-747-2345. As of the most recent prospectus, the Fund’s gross expense ratio is 1.53% and the net expense ratio is 1.28%. Palm Valley Capital Management has contractually agreed to waive its management fees and reimburse Fund operating expenses through at least April 30, 2024. |
Legends of the Fall
“She was like the water that freezes in the rock and splits it apart.”
Dear Fellow Shareholders,
The 1994 Oscar winning film for Best Cinematography was Legends of the Fall , a Western drama set in the early 20 th century starring Brad Pitt and Anthony Hopkins. In a story unfolding over decades, three brothers fall in love with the same woman, fracturing their bond. Brad Pitt plays the middle brother Tristan, who is most comfortable with the Montana wilderness and Native American culture that surrounds the family. At the beginning of the film, a 12-year-old Tristan, seeking to prove his bravery, gently places his palm on a sleeping grizzly bear and is slashed across the arm. In the movie’s final scene fifty years later, a grizzly attacks Tristan in the woods. Like every market cycle, it’s a tale bookended by bears.
As leaves soon begin to turn orange with autumn, we’re reminded of a stock market legend spawned at the beginning of the current Fed hiking campaign—that interest rates would soon fall to support highflying equities. Except they haven’t. The 10-year Treasury yield is 4.6%. It was 3.8% at the end of June and 3.5% in March. It was below 2.0% on New Year’s Eve of 2019, before the noise of the pandemic stimulus, back when inflation was an afterthought and investors believed ZIRP was sustainable. CCC-rated bonds, while off recent lows, are yielding over 13% compared to a bottom of 6% in mid-2021. Yet, despite higher rates, the 21x P/E ratio of the S&P 500 is the same as it was at the end of 2019. Ditto for cyclically adjusted earnings multiples, like Shiller CAPE. Therefore, while bonds have seen a step change in yields, most equity investors have stuck a finger in each ear, scrunched their eyes shut, and are repeating loudly, “I CAN’T HEAR YOU.”
Higher interest rates are like the water that freezes in an overleveraged economy and splits it apart. Rates have certainly immobilized the housing market, where activity is at multidecade lows, prices are at the highs, and homeowners are clinging for dear life to their low fixed rate mortgages. On September 10 th , The Wall Street Journal wrote, “The worst is likely over for the U.S. housing market.” We’ll see about that.
Housing affordability is the lowest since the 80s. According to the California Association of Realtors, only 16% of the state’s residents can afford to buy a median-priced home. Insurance costs are skyrocketing in disaster-prone states like Florida and California. Yet, the BLS bizarrely claims national homeowners’ insurance rates are up less than 1% over the last five years even as replacement costs grew over 50%. If demand for AirBnB and VRBO listings contracts in a saturated vacation market, overcommitted rental owners could be the straw that breaks the back of U.S. home prices.
Housing market stasis cannot persist indefinitely.
| From Bloomberg News on August 18, 2023 |
| “All around the world, bond traders are finally coming to the realization that the rock-bottom yields of recent history might be gone for good.” |
| “The man who coined the term ‘bond vigilantes’ has a message for Wall Street about the surge in longerterm US Treasury yields. Yes, the bond vigilantes are back, and no, this isn’t the end of the world for stocks.” |
| “ BofA’s Warning of a ‘5% World’ Sinks In As Bond Yields Surge ” |
| “ Yardeni Says Stocks Can Handle the Bond Vigilantes ” |
Economic carnage has been forestalled by fixed rate debt outstanding and significant deficit spending, including “green” manufacturing, Employee Retention Tax Credits, targeted student loan forgiveness, and bank bailout facilities. Amazingly, deficits are approaching the same percentage of GDP that they were during the Great Financial Crisis of 2008-2009.
There is increasing financial pressure among indebted businesses and citizens who don’t own assets. “Due to the higher burden of interest expense, tighter lending conditions and more limited capital access resulting from stress in the banking sector and inflation uncertainty,” Fitch projects a high yield default rate of 4.5%-5% to end 2023, up from 1.3% last year and 0.5% in 2021. The bomb dropped on several retailers during the latest quarter. Foot Locker is in the hurt locker. Excess pandemic “savings” (handouts) have been depleted. The credit card delinquency rate has crept up to post-credit crisis levels, and for borrowers from small banks, the metrics are worse than 2009 and 2020. Retail theft is rampant. Due to higher shrink and cost inflation, dollar stores aren’t doing so hot, but pawn shops are thriving. The working-class anthem “Rich Men North of Richmond” reached the top of the music charts. One person struggling with the rising cost of debt payments lamented to The Wall Street Journal , “The only place to cut corners is basic human activities.”
Regardless of our moralizing observation that stock investors are pricing in a legendary fall in rates that clearly hasn’t occurred, we also feel strongly the Fed’s propensity is to cut . They relished the expediency of using asset prices as their primary economic lever. The September dot plot, upwardly revised from June, shows a median expected Fed funds rate of 5.125% at the end of next year, 3.875% in 2025, 2.875% in 2026, and 2.5% longer term. While Fed members have generally pledged their commitment to keep rates higher for longer until inflation is vanquished, Chairman Powell threw out chum at a July presser: “You’d stop raising long before you got to 2 percent inflation. And you’d start cutting before you got to 2 percent inflation too. ”
At this advanced stage of the economic cycle, we don’t see lower Fed funds rates as a catalyst for real value creation. Removing this as a key input in determining equity valuations is quite therapeutic. We target a low double-digit required return influenced by a business’s unique risks as opposed to unpredictable short-term rate forecasts.
Besides expected future monetary easing, a stabilization of the banking system since the March panic has helped drive the recovery in overall equity prices. The Fed has showered the financial sector with support during the current business cycle, predating this Spring’s bailout program. In 2008, the Fed began paying interest on bank reserves for the first time to exert control over interest rates.
Roughly $3 trillion of reserves created by QE remain in the system, and at current rates, banks are receiving a whopping $175 billion of annualized interest on their reserves held at the Fed ! This statistic won’t be advertised. In comparison, the total profits for FDIC-insured institutions over the past year were $296 billion. It rubs many the wrong way that lenders are getting 5.4% risk-free from the Fed while the banks are still paying depositors an average rate of 0.45% on savings accounts (source: FDIC). You can’t blame depositors for not shopping for yield when money center banks can exploit their perceived Too Big To Fail status on deposit rates.
We believe smaller cap banks remain at the mercy of the commercial real estate ( CRE ) cycle, where property values are sinking. One real estate magnate recently quipped, “We’re in a Category 5 hurricane.” According to Green Street, office values are down 31% from the peak, but even less troubled sectors like apartments and self-storage have seen values fall 22% and 14%, respectively. Distress levels in commercial real estate are still nowhere close to the last recession, but the combination of structural changes to demand for office space and persistently higher rates suggests conditions will continue to deteriorate. Commercial properties back 44% of loans for smaller lenders, and this equals 289% of their aggregate equity. Small cap banks, already trading at depressed levels, would suffer mightily from a CRE meltdown.
The typical small cap is trading at a 4% free cash flow yield —near the middle of the historical range, bolstered by above- average free cash flow margins, which are notoriously fickle. The group is trading at a princely median EV/EBIT multiple of 20x. Nevertheless, if you consume financial media, you may have read that small caps haven’t been this cheap versus large caps in over twenty years. Small caps have underperformed large caps considerably since the middle of 2018, but context is required.
Small caps enjoyed an incredibly strong run from the cycle lows in March 2009 through August 2018 (the S&P 600/S&P 500 ratio peak), with the SmallCap 600 surging 575% and outperforming the S&P 500 by 160%. Since then, smaller names have appreciated another ~14%, while large caps are up an extra ~64%. One’s choice of small cap index may also influence their views on performance. The Russell 2000 appears much more historically depressed relative to its larger analog (Russell 1000) than the S&P Indexes.
Unprofitable companies constituting over 40% of the Russell 2000 have underperformed significantly and are down 30% year-to- date, on average, versus a -6% median return for profitable constituents. There are now over two dozen debt-free biotechs in the Russell trading for less than tangible book value, although that carries less weight when your business model depends on burning cash. Palm Valley is not bottom fishing for chronically unprofitable small caps.
We believe many equity investors are correctly applying relative discounts for financial and operating risk. Where they are failing, in our opinion, is in their assessment of an appropriate valuation reference point. Given inflated multiples and near peak margins, today’s S&P 500 does not fit the bill.
Small cap earnings vaulted higher during the pandemic, far outpacing the rate of income gains for large caps. We believe small cap investors are wisely discounting the sustainability of earnings growth for parts of the market, but they may not be discounting heavily enough. In many cases, we think it’s obvious that growth has been cyclical in nature. Energy is hands down the largest sector contributor to SmallCap 600 EPS gains from Spring 2020 (right before earnings dipped) to now. Many energy businesses took large impairments during early 2020, wiping away profits then but benefiting them prospectively, and higher oil prices have boosted net income. Consumer Discretionary is the second largest provider to SmallCap 600 income growth since the pandemic, powered by car dealers and homebuilders. However, earnings for this sector have dropped sharply recently. Egg producer Cal-Maine took the top prize for Consumer Staples, reporting $750 million of TTM net income versus a loss three years earlier. Banks delivered solid earnings gains over the period, although some top individual Financial sector contributors for the SmallCap 600 were insurance companies that recognized massive derivative gains tied to call options on the S&P 500 and rising interest rates—ironic given the subject matter of our letter, but not an enduring source of profit.
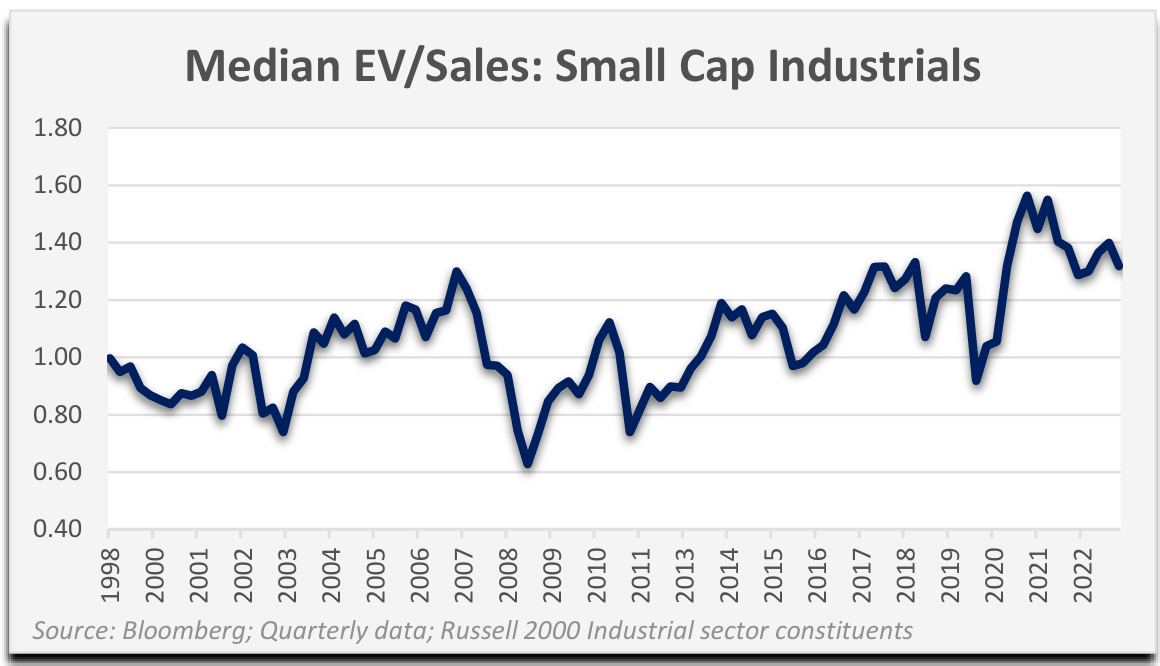
While we’re reluctant to single out one sector, this chart displaying the median Enterprise Value to Sales ratio for small cap Industrials (the broadest sector) reflects our general opinion of today’s valuation climate for good companies. It’s not the most expensive ever, but it’s pretty darn high. Charts for Consumer Staples and Information Technology companies look similar. On the other hand, the Energy and Financials sectors are closer to a historical bottom relative to revenue. Consumer Discretionary is somewhere in between. Although a selloff in a stock is usually a prerequisite for us to consider buying it, in the case of Financials, we feel there’s too much balance sheet risk for us to reliably judge valuations for most banks right now. For Consumer Discretionary firms, our job is to determine normalized results after a period distorted by stimulus spending. We’re looking for undervalued names with the financial strength to survive a recession.
Most of the equities we’ve seen that appear to be bargain-priced due to severe underperformance still have meaningful downside potential, in our judgment. That doesn’t mean the stocks will keep falling— only that we believe there are reasonably likely scenarios where the shares continue to bleed from deteriorating fundamentals. Normally, the time to buy these pockmarked companies is when there is widespread investor despair, not when one-day lottery tickets account for half of options trading volume. While highly speculative investments and those with considerable operating and financial risk have sold off since 2021, we believe quality remains expensive. The pullback in equities in September did little to correct imbalances. Valuations are not reflecting today’s interest rates or a lower growth future that is consistent with overindebted economies like ours.
For the quarter ending September 30, 2023, the Palm Valley Capital Fund increased 0.56%, while the S&P SmallCap 600 and Morningstar Small Cap Index declined 4.93% and 4.56%, respectively. The equity securities in the portfolio lost 0.78% during the quarter, before the negative impact of fund expenses and positive effect of interest income. At quarter end, the Fund held 81% in cash equivalents.
Those levitating interest rates that are threatening to freeze up and split open the U.S. economy have had the opposite effect on the dormant portion of our portfolio, providing a decent yield while we wait. One hedge fund titan who famously quipped that “cash is trash” in January 2020 now favors cash over most investment classes. To be fair, there is a big difference between 0% then and a 5% yield now. With the former, your purchasing power is unquestionably retreating. With the latter, you’re at least treading water. For an absolute return strategy striving to avoid permanent impairments of capital, the right times to hold cash often don’t correspond with when the yields on it are most favorable. Fortunately, the riskfree stars are aligned for us at the present, with stocks generally unappealing and cash quite the opposite.
We recently came across an interesting research paper: Do Stocks Outperform Treasury Bills?
(Bessembinder). According to the study, the majority of common stocks since 1926 have lifetime returns below one-month T-bills , and that proportion has been worse in recent decades due to dodgier new listings. It can be risky investing in small public companies, and in the absence of a compelling idea, historically it has made sense to leave funds in risk-free instruments. First, do no harm.
| Top 10 Holdings (9/30/23) |
| % Assets |
| Sprott Physical Silver Trust ( PSLV ) |
| 2.99% |
| Lassonde Industries ( LSDAF ) |
| 2.89% |
| Sprott Physical Gold Trust ( PHYS ) |
| 1.73% |
| 1.56% |
| 1.28% |
| Avista ( AVA ) |
| 1.23% |
| 1.18% |
| Hooker Furnishings ( HOFT ) |
| 0.82% |
| Gencor Industries ( GENC ) |
| 0.80% |
| Amdocs ( DOX ) |
| 0.79% |
The Fund’s top contributors in the third quarter were Lassonde Industries (ticker: LAS/A CN) and Miller Industries ( MLR ). We increased our Fund’s weighting in Lassonde in Q2 when the shares touched multiyear lows in spite of improvements in operating performance. Price increases have helped the company catch up to accumulated cost inflation and have more than compensated for volume declines. Lassonde continues to outperform the fruit juice and drink category in Canada, and U.S. results have begun to improve after restructuring actions.
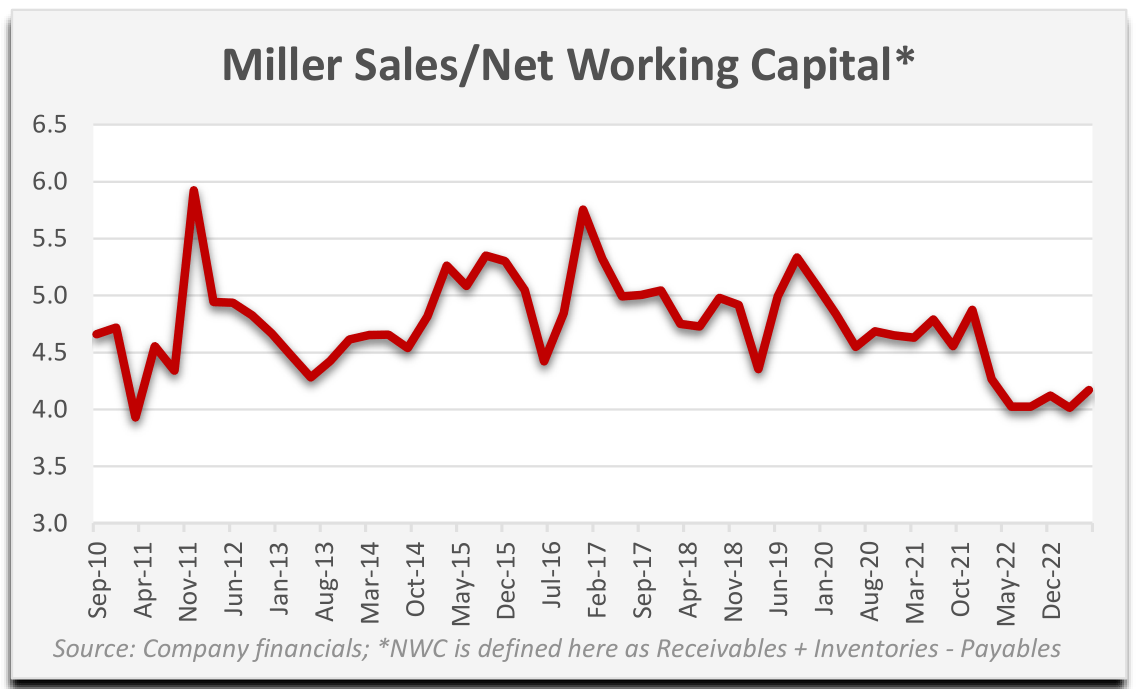
Miller Industries delivered extremely strong second quarter results. Revenues increased 49% year-overyear to a record, demand is resilient, and backlogs are steady. The firm’s working capital lurched higher due to the strong sales growth, and SG&A increased as a percentage of revenue because of Miller’s generous new executive compensation plan. Management said the firm’s top priorities for capital allocation are to reduce debt and invest in inventory to service customers. We think current results are above normalized levels; however, a reduction in revenue should bring the release of significant working capital. We reduced our position weighting as the shares appreciated in Q3.
During the third quarter, the Fund had three positions that detracted from performance by more than 10 basis points: Crawford & Co. (ticker: CRD/A, CRD/B), Advance Auto Parts (ticker: AAP), and TrueBlue (ticker: TBI). Crawford reported solid second quarter results that benefited from a high level of catastrophe activity from insurers. Operating profit before amortization jumped 86%, and the firm’s trailing profitability is now in line with our normalized assumptions. This reflects a period of above-average catastrophe claims offset by weak 2022 performance in Crawford’s International segment. The company’s stock had a strong run for much of this year, and we believe the selloff this quarter was probably due to investors trying to game the likelihood of a major hurricane boosting results.
Advance Auto Parts is in the middle of a turnaround to bring operating performance closer to peers. Second quarter profit was short of expectations as pricing didn’t cover cost inflation, but comparable store sales improved into quarter end. While the firm experienced a credit rating downgrade, the balance sheet is supported by significant owned real estate.
TrueBlue gave back its second quarter share appreciation after reporting results in late July. The company experienced a decline in revenue that was similar to other public staffing providers, including ones we own in the Fund. Employers who struggled to find help during the pandemic are holding on to permanent employees even with signs of economic uncertainty, while staffers are facing revenue pressure. When we purchased TrueBlue, we were prepared for fundamentals to deteriorate with the economy. The company has managed to avoid operating losses during prior recessions and has an excellent debt-free balance sheet. The stock is trading for less than 7x our estimate of normalized operating profit.
We did not fully sell any positions during the third quarter. We purchased four new names: Avista Corporation (ticker: AVA), Farmland Partners (ticker: FPI), Equity Commonwealth (ticker: EQC), and SSR Mining (ticker: SSRM). We believe these opportunities materialized because higher interest rates are disproportionately impacting investor sentiment toward certain sectors, even as capitalizationweighted, tech-heavy indexes have powered through the headwinds.
Founded in 1889, Avista is a regulated utility with operations in Washington, Idaho, Oregon, Alaska, and Montana. Avista provides electricity to 411,000 customers and natural gas to 377,000 customers. As interest rates have increased, utility stocks have significantly underperformed the broader stock market. Avista’s stock has also been under pressure as wildfires have become a more obvious risk for investors. We believe Avista is currently generating below normalized earnings. Approximately half of Avista’s electricity is produced from low-cost hydroelectric generation. Weather conditions over the last year reduced the company’s hydroelectric output and increased its cost of production. Additionally, we also expect earnings to lag in 2023 because the company’s last approved rate increase in Washington was insufficient to cover the subsequent unexpected rise in inflation. Avista filed a new Washington rate case in June 2023 that takes higher costs into consideration and, if approved, should go into effect in 2025.
Avista is selling at 14x 2023 expected earnings and 13x our normalized estimate. Furthermore, at 1.05x tangible book value, the firm is at a considerable discount to its historical net asset valuation. We expect Avista’s earnings to reach our normalized estimate by 2025 and believe the company’s long-term growth objective is achievable given its territory’s large capital investment needs. While utilities are not risk-free, at Avista’s current valuation, we believe we are being adequately compensated for risk.
We bought a small position in Farmland Partners ( FPI ) during the quarter. FPI is a real estate investment trust ((REIT)) focused on farmland. As of June 30, 2023, FPI owned 159,000 acres of farmland with a book value of $1.1 billion. FPI’s stock has declined year-to-date as higher interest rates have increased its borrowing cost and pressured earnings. Management believes the value of its farmland, net of debt, exceeds its market capitalization, and they have been repurchasing stock. The company intends to sell $190 million of farmland in 2023 and will use the proceeds to buy back more stock and reduce debt. While rising interest rates are a risk to FPI’s near-term earnings, the stock is trading at a discount to reported book value and our higher net asset valuation.
Equity Commonwealth ( EQC ) is another real estate investment trust we purchased in Q3. The company focuses on commercial real estate and owns properties in Denver, Washington D.C., and Austin. Over the past nine years, EQC has been busy selling its portfolio of commercial real estate, generating $6.9 billion in proceeds. It used these funds to reduce debt, buy back stock, pay dividends, and build a large cash balance. At the end of June, Equity Commonwealth had $2.15 billion in cash that it intends to use to buy real estate at attractive valuations. Similar to our investment strategy, Equity Commonwealth is patient, opportunistic, and is willing to hold a large cash balance when opportunities are scarce. EQC is trading below book value and at a level equal to the company’s cash balance.
SSR Mining is back in the Fund after a brief hiatus. SSR is a precious metals producer with four mines located in the United States, Turkey, Canada, and Argentina. The company is selling at a meaningful discount to its tangible book value and our calculated net asset value. SSR has a very strong balance sheet with more cash than debt and $4.6 billion in stockholders’ equity. Furthermore, the firm has a history of generating free cash flow, buying back stock, and paying a sustainable dividend.
“I’ll see it when I believe it.”
In early August, the Internet went abuzz when a video was shared of a bear at a zoo in China that was acting very human-like. The Malaysian sun bear stood upright and waved to the crowd, with still photos capturing a saggy backside that led some Internet sleuths to suspect it could be a person in a costume. Zoos from the East and West were quick to debunk the conspiracy theories by explaining that these habits were normal for sun bears, the smallest bear species. According to National Geographic , female sun bears have even been “observed cradling a cub in their arms while walking on their hind legs.” Besides, according to a Hangzhou Zoo employee, temperatures reached 104 degrees Fahrenheit at the zoo that day, so a human could not survive very long in a bear costume.
If this particular bear had been videoed in the U.S., Germany, or Japan, we wonder if the story would have caught fire. But it’s China, which has developed a reputation for a lack of transparency. If China routinely steals foreign IP to advance its interests and stops sharing economic data to steer public opinion, then surely it would put a zookeeper in a bear costume to temporarily fill in for the real bear, right? It wasn’t a crazy theory, especially if you only saw the pictures and not the video.
We’re shaped by our experiences and by the narratives we are fed. Today’s stock bulls have recent experience and powerful narratives supporting their positioning. The Fed has repeatedly rescued investors from deflating bubbles, and the responses have come sooner with each new crisis. Currently, the mainstream narrative is for a soft landing with cooling inflation that permits a slackening of monetary policy. It’s all sunshine for the affluent, whose wealth accumulation from financial assets is supposedly just a fortunate byproduct in the pursuit of maximizing employment. Meanwhile, the working class wonders why it seems harder than ever to make ends meet.
There was an old legend that if short-term rates ever went up meaningfully, stocks would quickly fall and stay down for a while. Then it happened, and they didn’t. The new legend is that interest rates will fall to remove resistance for stock prices. The new est legend is that stocks can survive and thrive with higher rates. Call it the Peter Pan Principle: If you believe it, you can make it so.
One thing we’ve learned from many years in this industry is that financial justice operates on its own timetable. Significant patience and restraint are needed to avoid committing investment mistakes when they are presented as best practices by almost everyone in the business. Today, we see a divided landscape where pain has been distributed to riskier stocks, while valuations remain high for quality companies.
Despite the overall resilience of the stock market so far, our debt laden economy is far from impervious to higher rates. This will become apparent as waves of refinancings crash over us. Jumping fully into the fray now seems premature. We’re as eager as anyone for a return to attractive small cap valuations. After all, it’s getting a little warm in this bear suit.
Thank you for your investment.
Sincerely,
Jayme Wiggins Eric Cinnamond
| Mutual fund investing involves risk. Principal loss is possible. The Palm Valley Capital Fund invests in smaller sized companies, which involve additional risks such as limited liquidity and greater volatility than large capitalization companies. The ability of the Fund to meet its investment objective may be limited to the extent it holds assets in cash (or cash equivalents) or is otherwise uninvested. Before investing in the Palm Valley Capital Fund, you should carefully consider the Fund’s investment objectives, risks, charges, and expenses. The Prospectus contains this and other important information and it may be obtained by calling 904-747-2345. Please read the Prospectus carefully before investing. Past performance is no guarantee of future results. Dividends are not guaranteed and a company’s future ability to pay dividends may be limited. A company currently paying dividends may cease paying dividends at any time. Fund holdings and sector allocations are subject to change and are not a recommendation to buy or sell any security. Earnings growth for a Fund holding does not guarantee a corresponding increase in the market value of the holding or the Fund. The S&P SmallCap 600 Total Return Index measures the small cap segment of the U.S. equity market. The index is designed to track companies that meet specific inclusion criteria to ensure that they are liquid and financially viable. The Morningstar Small Cap Total Return Index tracks the performance of U.S. small-cap stocks that fall between 90th and 97th percentile in market capitalization of the investable universe. It is not possible to invest directly in an index. The Palm Valley Capital Fund is distributed by Quasar Distributors, LLC. Opinions expressed are those of the author, are subject to change at any time, are not guaranteed and should not be considered investment advice. Definitions:BLS: Bureau of Labor Statistics CAPEShillerP/E:The cyclically adjusted price-to-earnings ratio is a valuation measure usually applied to the S&P 500. It is defined as price divided by the average of ten years of earnings, adjusted for inflation. CFO: Chief Financial Officer Dot Plot: Chart that records each Fed member’s projection for the Federal Funds Rate. Employee Retention Tax Credits: A refundable tax credit for businesses that had employees and were affected by the COVID-19 pandemic. EPS (Earnings per share): Net income divided by shares outstanding. Equity: A company’s total assets minus total liabilities (net assets). EV/EBIT:Enterprise Value of a company (Market Capitalization – Cash + Debt) divided by its trailing twelve- month Earnings Before Interest and Taxes (i.e., operating income). EV/Sales: Enterprise Value (Market Cap + Debt – Cash) divided by Revenue. FDIC (Federal Deposit Insurance Corporation): Government agency created to maintain stability and confidence in the U.S. banking system. Federal Funds Rate: The interest rate that banks charge each other for lending money on an overnight basis. Federal Housing Finance Agency Monthly Purchase Index: A broad measure of the movement in U.S. single family home prices that tracks repeat sales on the same properties. Free Cash Flow: Cash from Operating Activities minus Capital Expenditures. Free Cash Flow Margin: Free Cash Flow dividend by Revenue. Free Cash Flow Yield: Free Cash Flow divided by Market Capitalization. GDP: The total value of goods produced and services provided in a country during one year. Net asset value: The value of an entity’s assets minus its liabilities. Quantitative Easing (QE): Monetary policy where a central bank purchases government bonds or other financial assets to create liquidity in an economy. Price to Earnings (P/E) Ratio: A stock’s price divided by its earnings per share. Reserves: Bank reserves are the minimum amount of vault cash or deposits at the Federal Reserve that a bank must have to meet the requirements of the central bank. ROE: Return on equity, which equals net income divided by shareholder’s equity. Russell1000:An American stock market index based on the market capitalizations of the largest 1,000 companies in the Russell 3000 Index. Russell2000:An American small-cap stock market index based on the market capitalizations of the bottom 2,000 companies in the Russell 3000 Index. S&P500:The Standard & Poor's 500 is an American stock market index based on the market capitalizations of 500 large companies. S&P Regional Bank Index: Stocks in the S&P Total Market Index that are classified in the GICS Regional Banks sub-industry. Tangible book value: Shareholders’ equity, or total assets excluding goodwill and other intangibles minus total liabilities. TTM: Trailing Twelve Month Treasury Curve: A line that plots the interest rates of Treasury bonds with different maturity dates. ZIRP (Zero Interest Rate Policy): Describes a monetary policy of Federal Reserve to keep short-term interest rates near zero. |
Editor's Note: The summary bullets for this article were chosen by Seeking Alpha editors.
For further details see:
Palm Valley Capital Fund Q3 2023 Commentary