PARXF - Parex Resources: Revised Full-Year Projections And An Optimistic Outlook
2023-09-22 10:57:33 ET
Summary
- Parex is a debt-free, cash-rich company in the oil and gas sector, currently undervalued given Brent Crude's pricing trends.
- Year-to-date, they've faced setbacks but still show strong financial flexibility. Key indicators like FFO and FFF are favorable for shareholder returns.
- Projections suggest Parex could outperform their own guidance, contributing to dividends and share buybacks.
- The global oil demand and pricing outlook favor Parex's future performance, especially if Brent averages around $88/bbl.
- Compared to peers, Parex shows significantly lower P/E and EV/EBITDA multiples, indicating it's undervalued.
All figures are in unless otherwise noted.
All financial data is from Seeking Alpha unless otherwise noted.
Investment Thesis
I have previously covered Parex Resources (PARXF) (PXT:CA) in an article posted in July where I rated Parex a 'buy'. I'm revising my target to make Parex a 'strong buy' because of the recent strength in the oil market coupled with weak share pricing in the market. Parex is a cash-rich, debt-free, oil and gas company operating in Colombia. Based on the current price of Brent Crude oil and forecasts for the rest of the year, Parex is set to outpace their guidance and weak share price action now makes them an undervalued play to get exposure to the oil and gas sector.
Adjusted Guidance & YTD 2023 Results
Before we dive into the YTD results for Parex, I would like to define some key performance indicators that Parex uses in their financials.
FFO: Funds Flow Provided by Operations
- Representation: Profitability after all cash costs.
- Formula: CFO + Change in Non-Cash Working Capital.
FFF: Free Funds Flow
- Representation: Ability to fund return of capital such as NCIB or dividends without accessing outside funds.
- Formula: FFO - CAPEX.
CAPEX: Capital Expenditures
- Representation: Consists of property, plant, and equipment expenditures and exploration and evaluation asset expenditures.
- Formula: PPE + E&E.
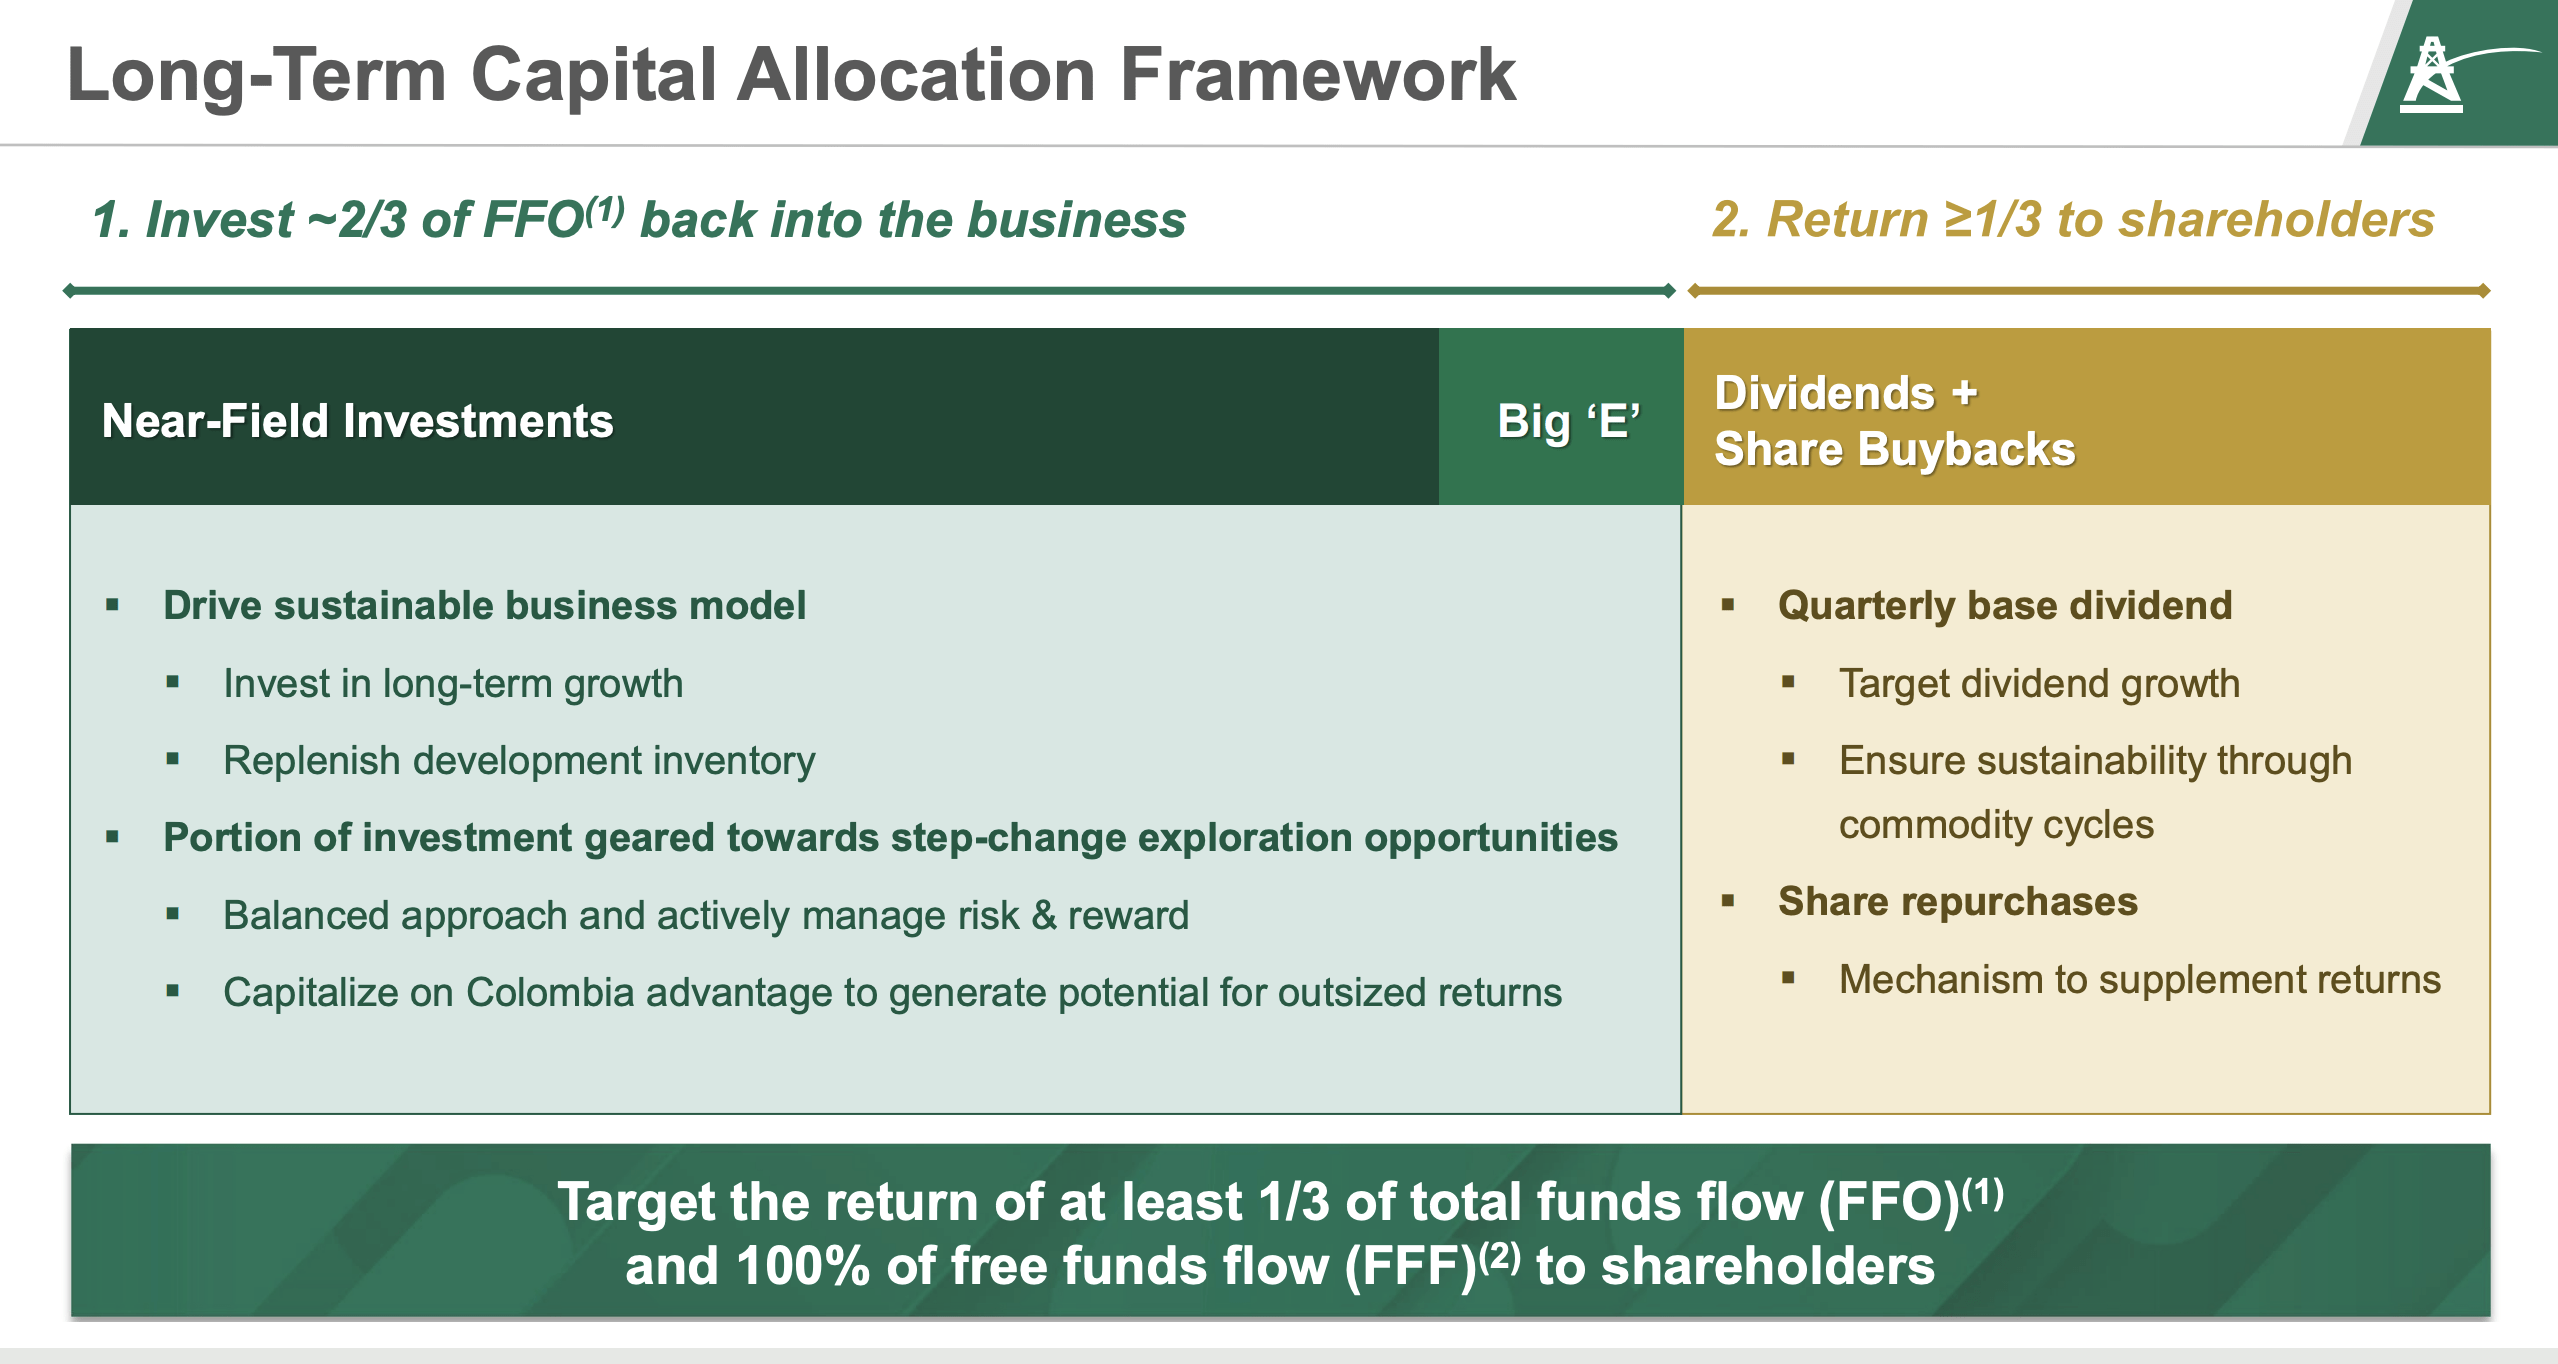
Based on the most recent investor presentation, Parex looks to invest 2/3's of their FFO into near-field investments (back into the business). The remainder of FFO is designed to be returned to shareholders. In other words, 100% of the FFF is expected to be returned to shareholders.
Capital Allocation Framework (Investor Presentation)
In the first six months of 2023, Parex faced several issues. Their Capachos Block was shut down from January 21 to April 17, cutting off 6,500 boe/d. Also, the first site in their Big 'E' portfolio, which targets opportunities with the potential to produce 20,000 boe/d, was unsuccessful. This failure led to a financial loss of over $55 million in the second quarter due to asset impairment. These results ultimately weighed on Parex's guidance causing them to adjust their forecasts in Q2.
| Category |
| Original Guidance |
| Updated Guidance |
| Change |
| Impact |
| Brent Crude Average Price () |
| $80 |
| $80 |
| N/A |
| N/A |
| Effective Tax Rate Estimate (%) |
| 25% |
| 20% |
| -5% |
| Favorable |
| FFO Netback ($/boe) |
| $34 |
| $35 |
| +$1 |
| Favorable |
| Productive Average (boe/d) |
| 57,000-63,000 |
| 54,000-57,000 |
| ~-4,500 |
| Unfavorable |
| CAPEX () |
| $425-$475 |
| $450-$475 |
| ~+12.5 |
| Unfavorable |
| FFO () |
| $705-$780 |
| $690-$730 |
| ~-42.5 |
| Unfavorable |
| FFF () |
| $295 |
| $245 |
| -50 |
| Unfavorable |
YTD Parex has produced an average of 52,733 boe/d which has resulted in sales of $656.911 million, FFO of $316.566 million, and FFF of $81.389 million. CAPEX has been $235.177 million.
In the second quarter, Parex also paid $141.054 million in taxes that were owed which caused their cash balance to fall to $133.375 million. This isn't something to be concerned with because the payment was expected and Parex operates without any external debt which means they still have a tremendous amount of financial flexibility.
Forecasting The Second Half of 2023
Using the midpoint of their current guidance, information from their investor presentation, YTD data, and market information, we can forecast the expected results for the remainder of 2023. Based on data from the EIA , Brent crude averaged $81.17 (Parex reported $82.16) a barrel in the first quarter of 2023 and averaged $78.32 (Parex reported $77.84) in the second quarter of 2023. The price of Brent has surged over the past few months averaging $80.11 in July, $86.15 in August, the current September average is $92.65, and the current price as of September 21st is $93.23.
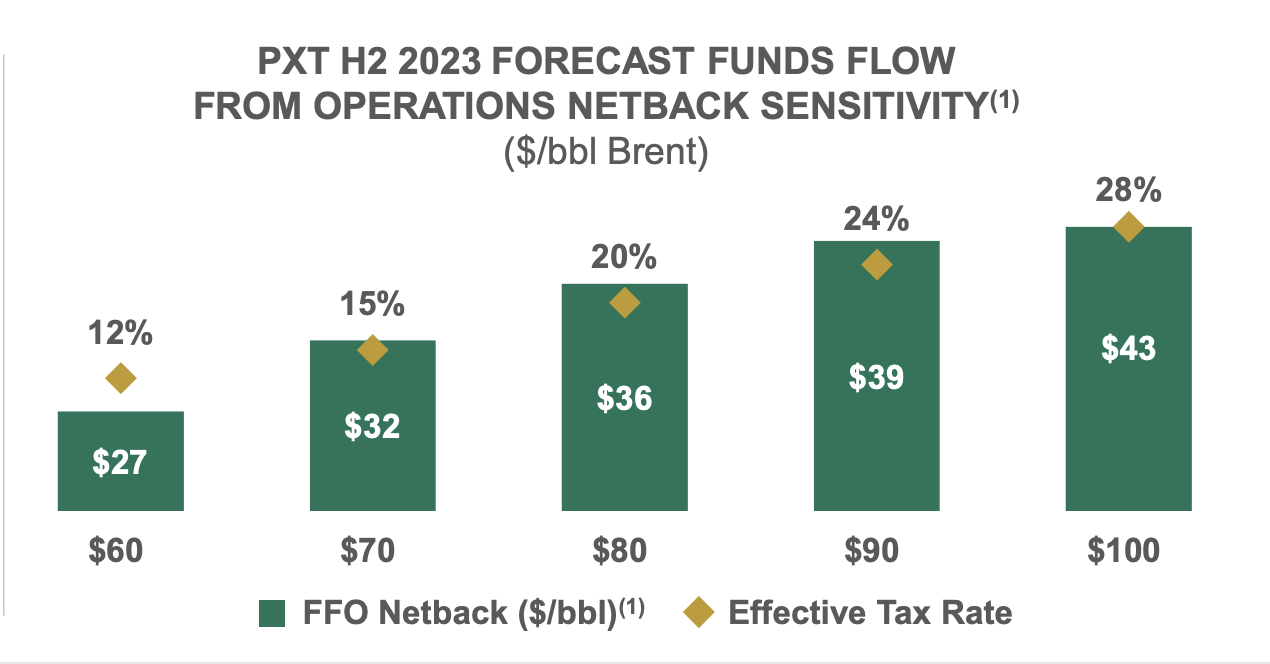
With a projected Q3 average of $86 per barrel (i.e., rough estimate for average price over July, August, and September seen above) and a Q4 forecast of $90 per barrel (i.e., current price is $93.23 and the EIA projects $93 but, I want to be conservative), the average price for the second half of 2023 is likely to be around $88 per barrel (average of $86 and $90). At this price level, Parex can anticipate an FFO netback of $38.40/boe. I have derived this number using Parex's investor presentation which shows an FFO netback of $39/boe at $90/bbl Brent and an FFO netback of $36/boe at $80/bbl Brent. Assuming that every $1 increase in Brent leads to a $0.30/boe increase in FFO netback, we arrive at $38.40/boe for Brent at $88.
If Parex aims to hit the midpoint of their 2023 production guidance, which is 55,500 boe/d [(54,000+57,000)/2], they'll need to ramp up production to an average of 58,266 boe/d for Q3 and Q4. I have derived this using the YTD production which has been 52,733 boe/d and then using the midpoint of 55,500 boe/d we calculate:
(52,733*2) + (x*2)= (55,500*4).
x = 58,266 boe/d
This seems achievable, especially considering management's expectation of exceeding 60,000 boe/d in Q4 ( Page 2 of MD&A ).
FFO Netback Sensitivity (Investor Presentation)
In H2 2023, my projections show Parex earning $410 million in FFO (58,266 boe/d*180 days*$38.40)and $181 million in FFF (FFO - CAPEX), beating their own midpoint estimates by $15 million and $17 million, respectively. This FFF is double what they generated in H1 2023. These extra funds will go towards dividends and share buybacks. Notably, Parex has already cut its share count by about 33% since 2017 and from 109 million at the end of 2022 to 105 million as of September 2023.
The dividend yield combined with the share buybacks makes their total yield more than 10%. With no debt on their balance sheet, Parex can continue to invest in its future and also return a substantial amount to shareholders in the process.
Favorable Pricing Multiples
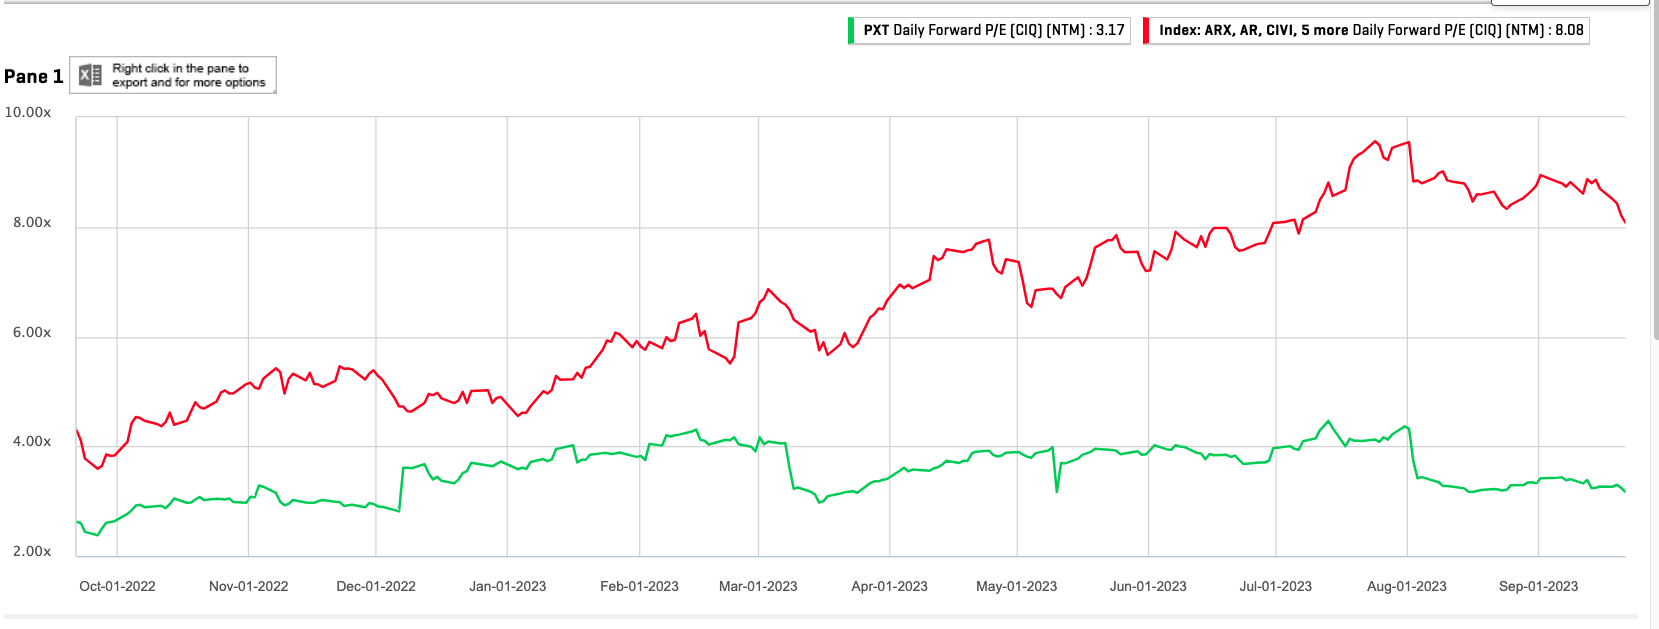
Based on trading multiples, Parex appears to be undervalued compared to other mid-cap companies in the same market cap range ($2B-$10B). Parex's forward P/E is just 3.17x, significantly lower than its peers' average of 8.62x. Similarly, its EV/EBITDA multiple is 2.13x, also below the peer average of 2.72x. These lower multiples suggest that Parex could be a more attractive investment relative to its competitors.
You can also see that the spread between some of their peers and Parex has widened in recent months further indicating an undervalued opportunity. Some of this spread is likely due to the higher risk of operating in Colombia however, the acceleration of the spread since March of 2023 has been too large to ignore.
Bullish Oil Outlook
As per the IEA , world oil demand is scaling record highs and at the same time, production is falling due to efforts made by Saudi Arabia and Russia to prop up the price of oil. The outlook remains bullish as observed oil inventories have decreased for 3 months in a row with OECD oil inventory falling more than 100 million barrels below the 5-year average. Moreover, the IEA is projecting that oil inventories could draw even further by 2.2 million barrels a day in the third quarter of 2023 and by 1.2 million barrels a day in the fourth quarter.
The EIA's short-term energy outlook raised its Brent price target to $84.46 for 2023 and to $88.22 for 2024 even as US producers raise output. With oil companies focused on reducing debt and returning cash to shareholders, Parex is in a unique position to grow their production and return cash to shareholders.
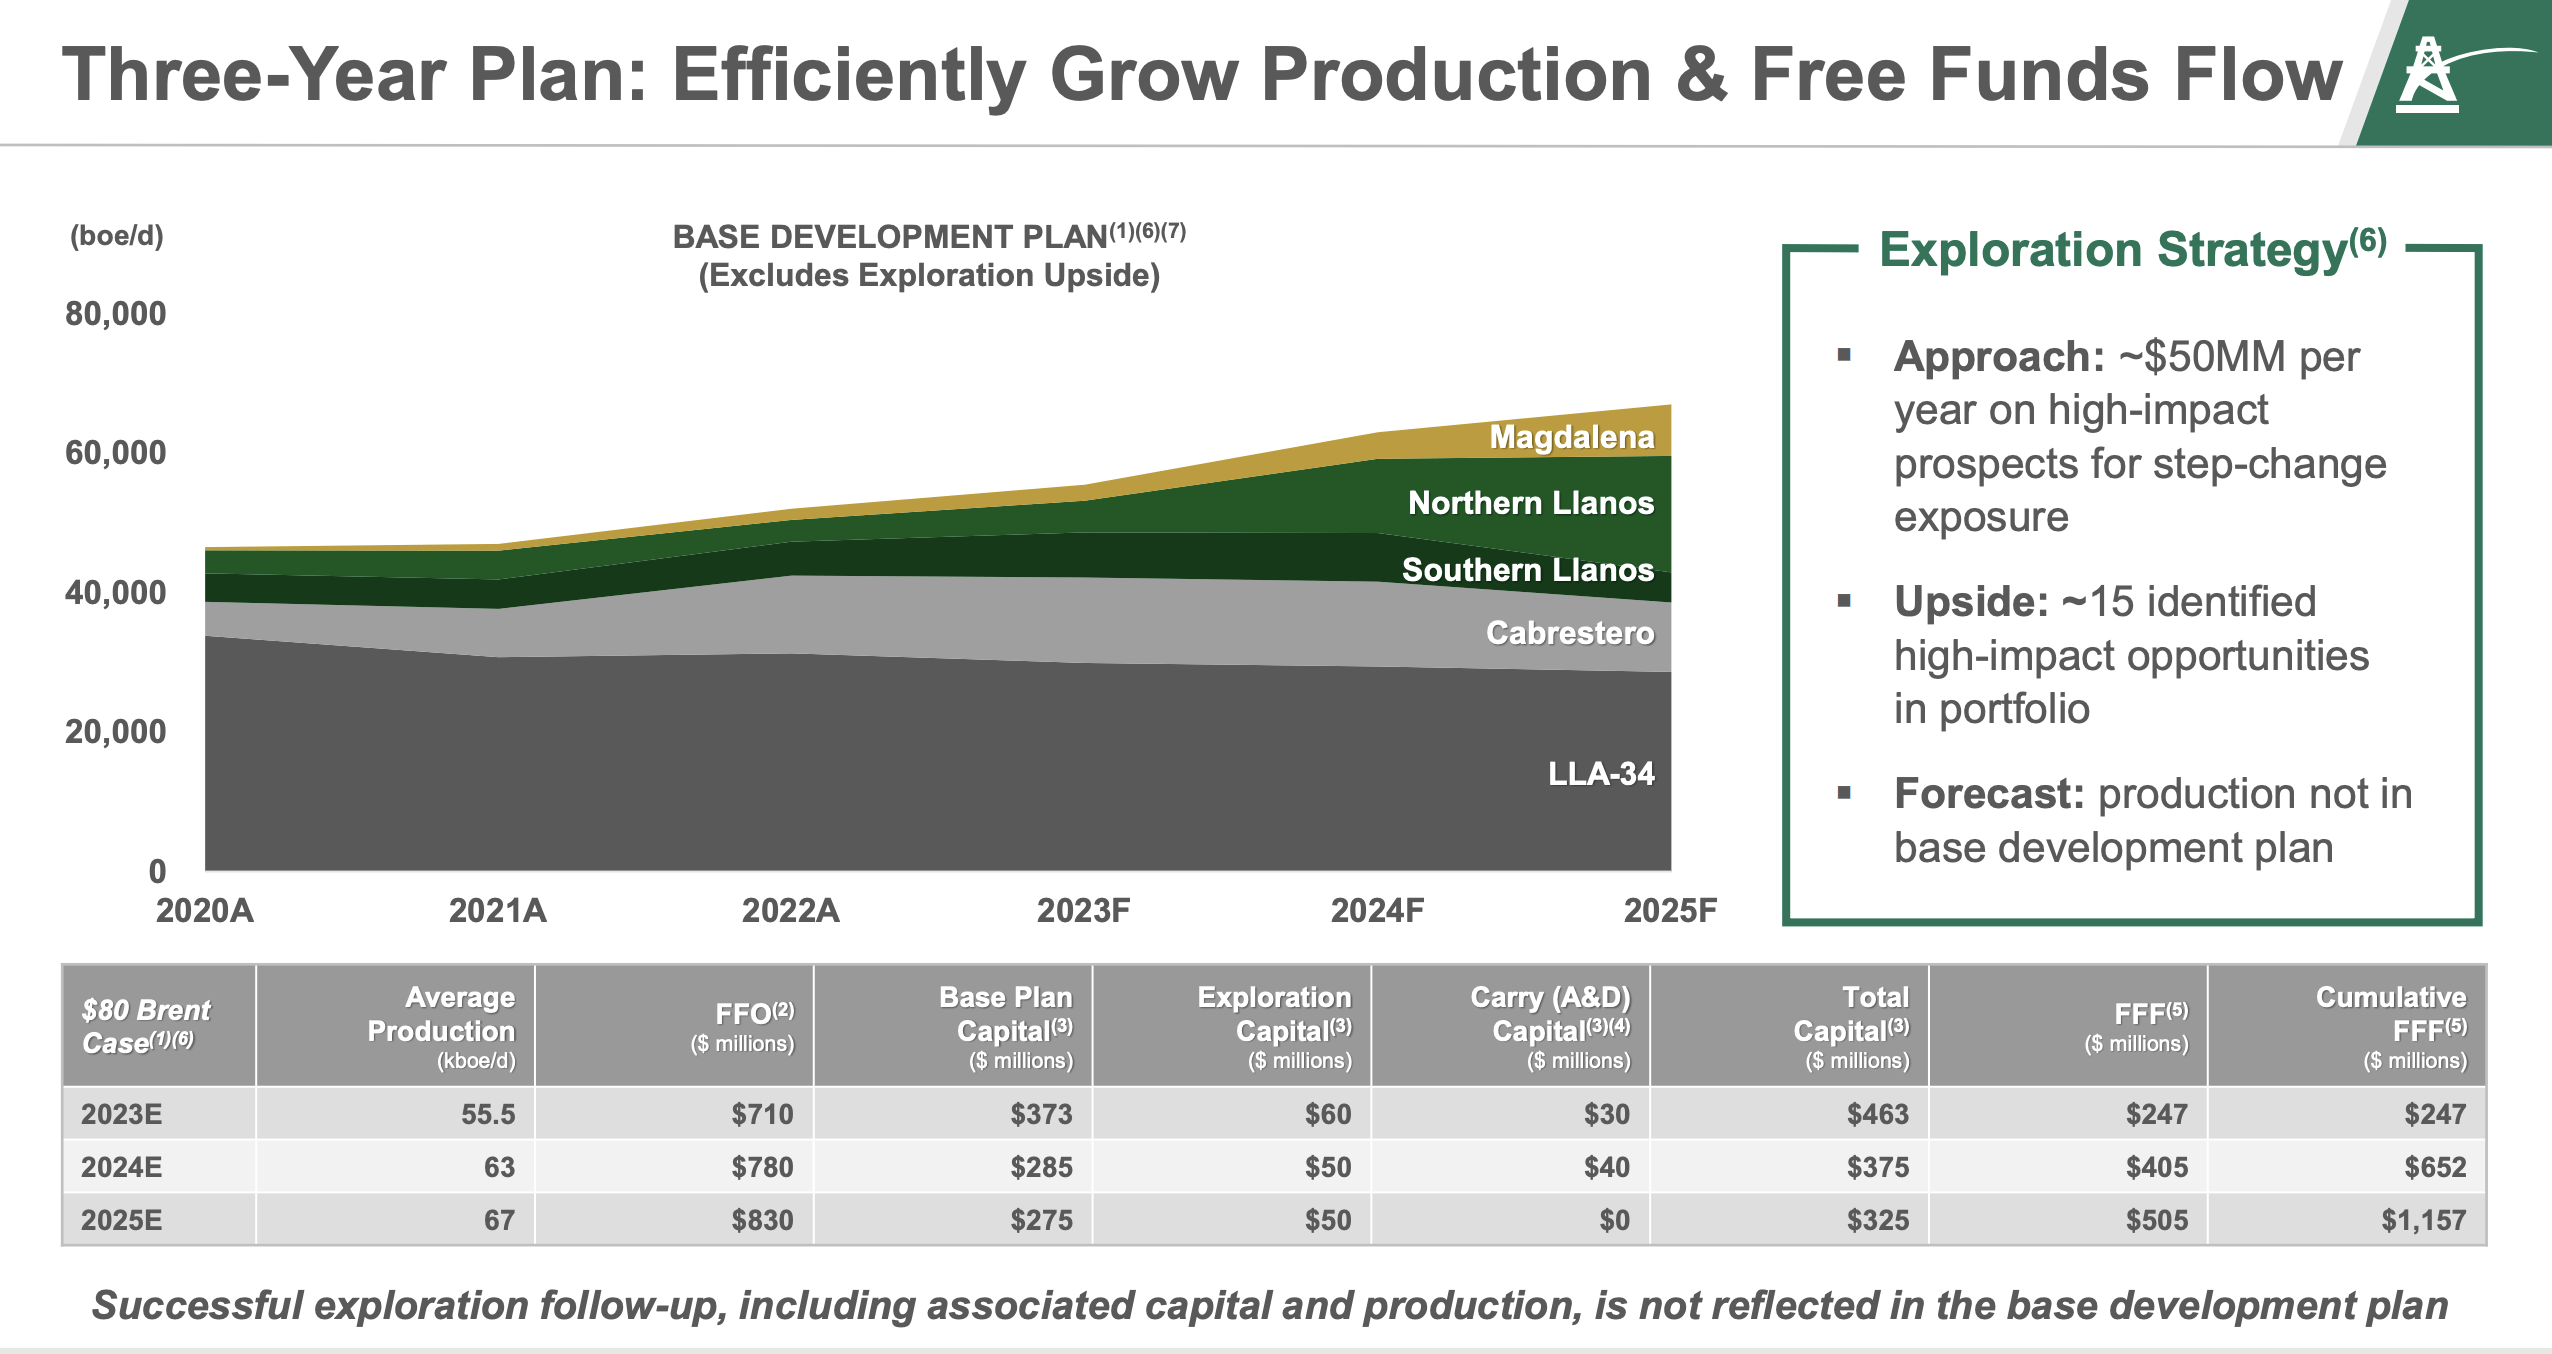
Parex is projecting 63,000 boe/d in production for 2024 with an FFO of $780 million under the assumption that Brent averages $80/bbl over the period (see capital allocation plan below). If Brent averages $88 a barrel in 2024, Parex stands in a position to deliver one of the highest total yields (dividend + buyback) in the Canadian oil market.
Capital Allocation Plan (Investor Presentation)
Risks
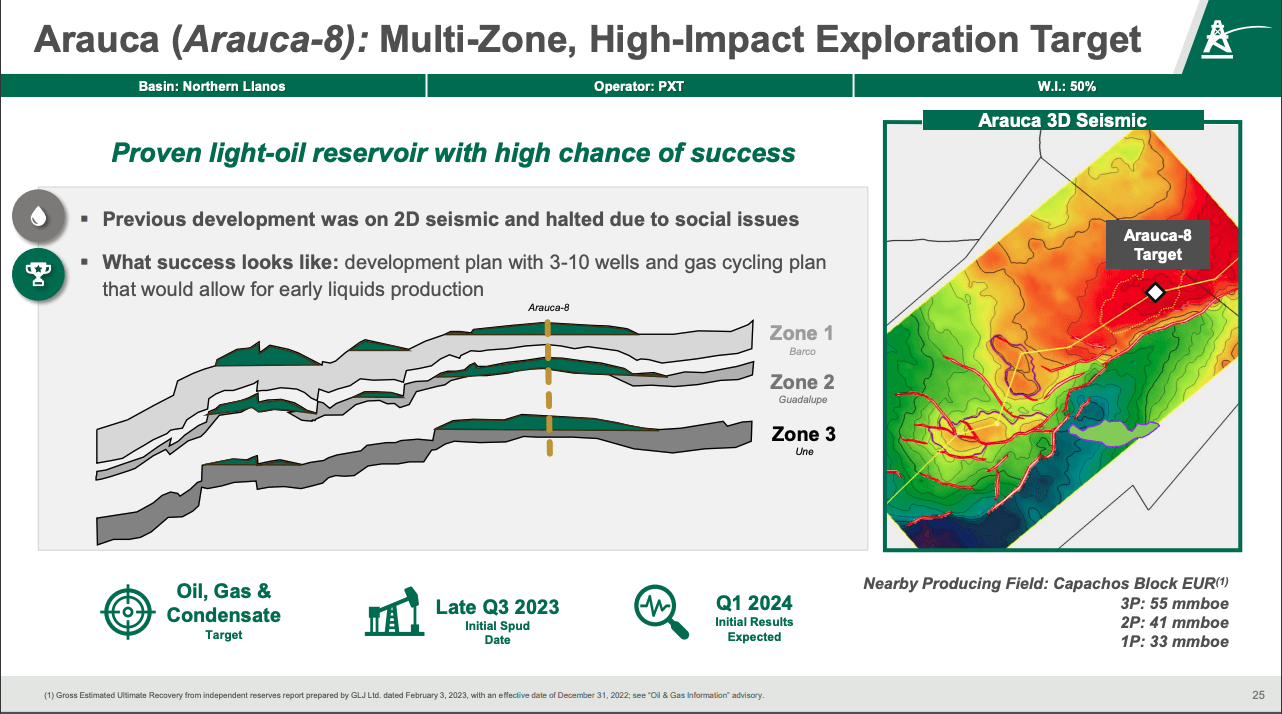
The Big 'E' exploration program stands as a pivotal factor that could either propel Parex's value or erode investor confidence. While the company hasn't factored this into their official guidance, its outcome has the potential to be a game-changer for both the firm and its shareholders. The next Big 'E' project is expected to come to fruition by the end of Q3.
Big 'E' Project (Investor Presentation)
Additionally, Parex's exclusive operations in Colombia expose it to a unique set of geopolitical risks, including pipeline disruptions, currency volatility, and political instability. These are some other considerations for any prospective investment in the company.
Conclusion
In summary, Parex stands as a compelling investment option in the oil and gas sector. The company is debt-free and cash-rich, positioning it as an undervalued asset given the current and forecasted prices of Brent Crude. Despite some setbacks in the first half of 2023, Parex's strong financial indicators like FFO and FFF are promising for shareholder returns. My projections for the second half of 2023 indicate that Parex could beat their own guidance, further fueling dividends and share buybacks. Additionally, the company's lower trading multiples compared to industry peers signal it's undervalued. While the global oil market outlook appears bullish, benefiting Parex, investors should be cautious of inherent risks. These include the high-stakes Big 'E' exploration program and geopolitical risks tied to the company's exclusive operations in Colombia. Nevertheless, with a reduced share count and strong financials, Parex offers a high-yield, albeit risky, investment opportunity in a favorable oil market.
For further details see:
Parex Resources: Revised Full-Year Projections And An Optimistic Outlook