PDO - PDI: Lag Likely To Continue
2023-12-05 00:09:05 ET
Summary
- PIMCO Dynamic Income Fund has lagged behind the S&P 500 index and is likely to continue underperforming due to a few key factors.
- The top factor in my view involves PDI's concentrated exposure to mortgages and high-yield credit.
- These exposures are ill-positioned under an inverted yield curve.
- The fund's premium pricing and relatively high leverage further increase the risk.
Thesis
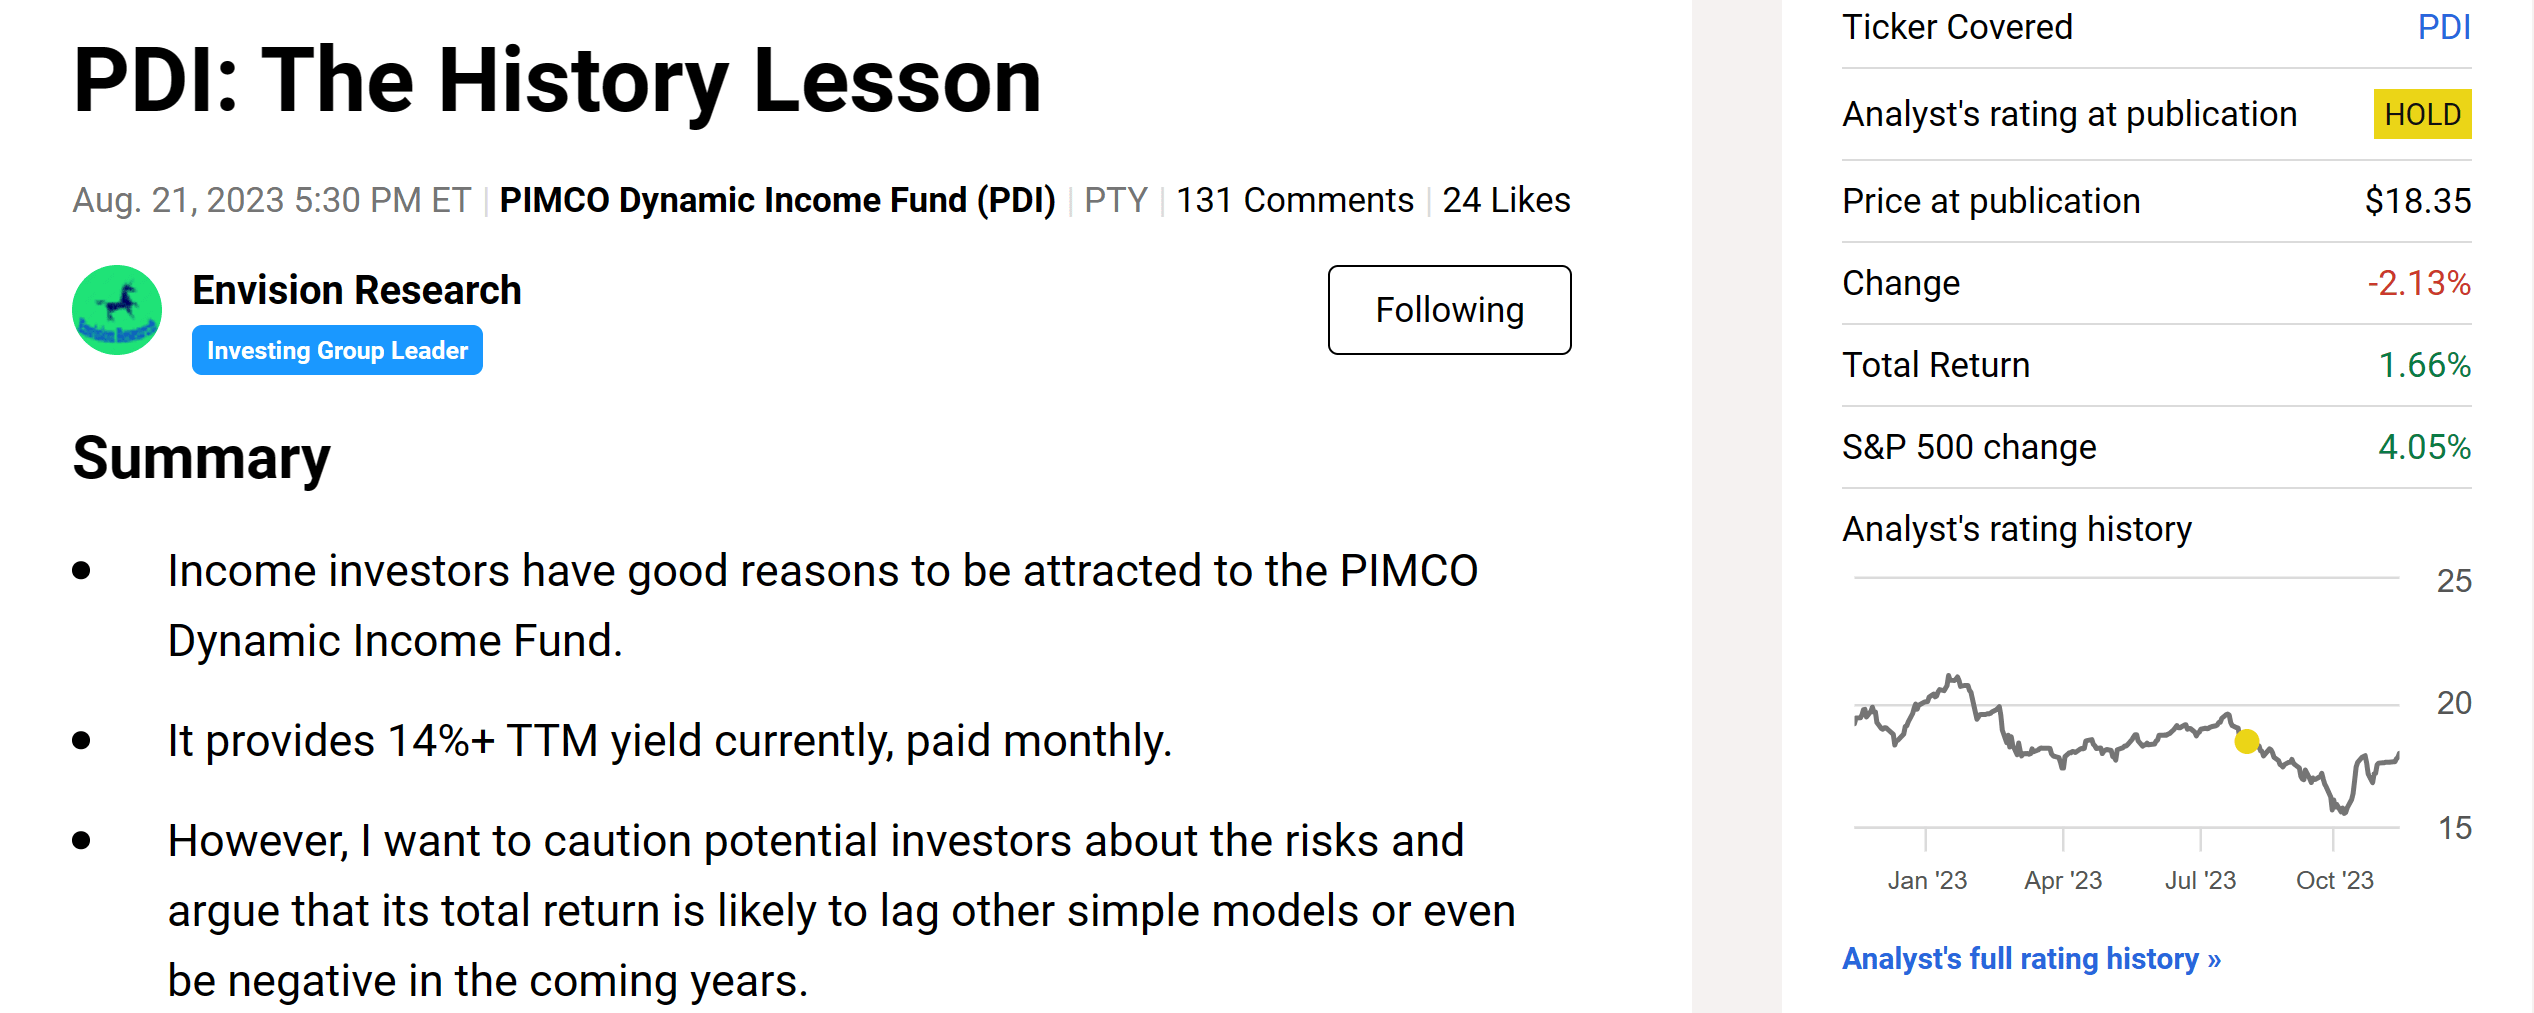
I last wrote about the PIMCO Dynamic Income Fund (PDI) about 4 months ago in August 2023. At that time, I analyzed a few key risks behind its high yield and cautioned potential investors that its total return ahead is likely to lag the overall market or other simple models (say a 60-40 model).
The fund has indeed lagged behind the SP500 index since then (as seen from the chart above). In the remainder of this article, I will analyze a few new developments since August and argue why it is likely for the fund to keep lagging. Actually, I will take a step further and argue that the odds of its underperformance are even higher than in August. In a nutshell, my argument will be anchored around the following 3 factors:
- The yield curve remains inverted, which has been a leading indicator of a recession historically. If a recession does materialize, I expect PDI’s performance to be dramatically worse than both equity and treasury bonds due to its use of leverage and particular exposure.
- The fund is currently priced at a premium and employs a relatively high degree of leverage, further adding to the risks.
PDI: basic information
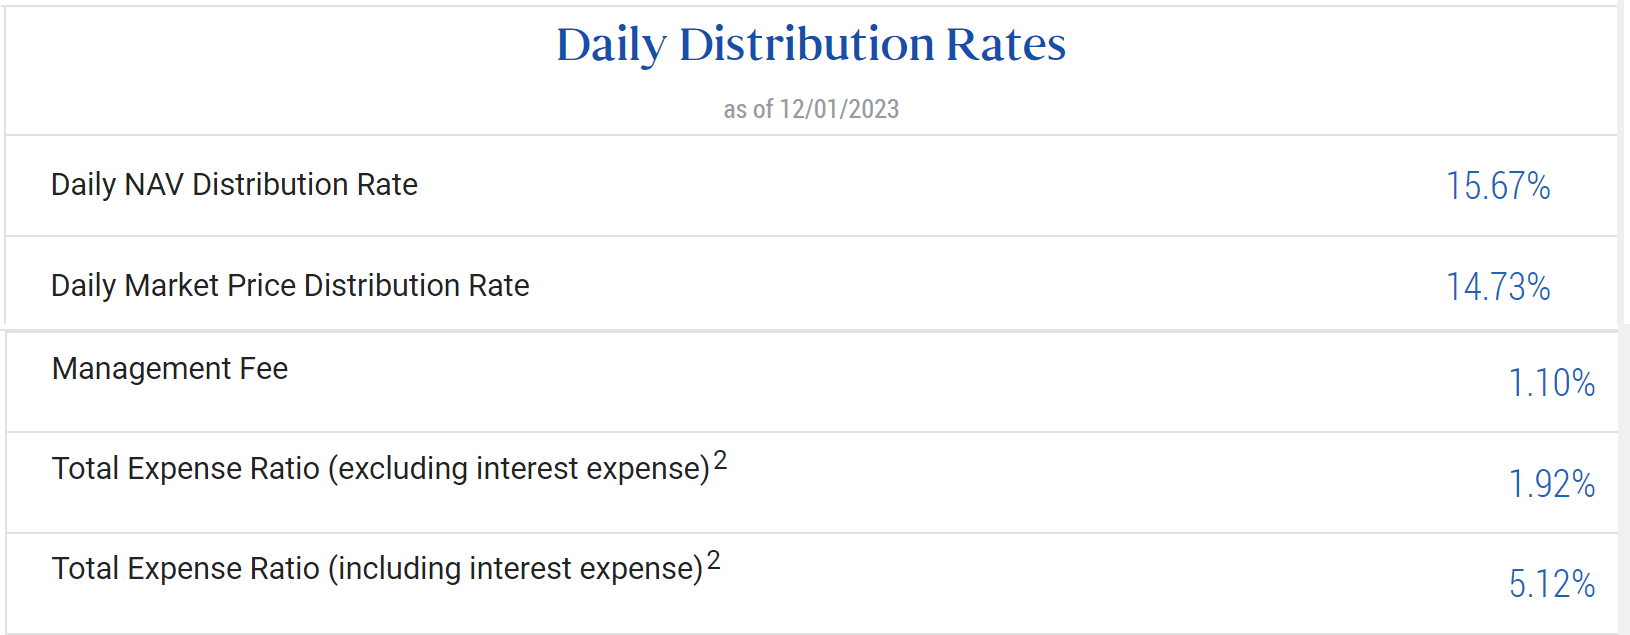
Before diving into the details, a quick introduction to the fund itself in case it is new to some readers. It is a popular closed-end fund among income-seeking investors - for good reasons. As you can see from the chart below, the fund's daily distribution rates as of December 1, 2023, sit around 15.67% based on its daily NAV of around 14.73% based on its daily market price. And similar to most closed-end funds, the distributions were paid monthly. The fund achieves such high yield primarily by A) using substantial leverage, and B) focusing on securities in a variety of fixed income securities, including corporate bonds, mortgage-related securities, government bonds, and municipal bonds. I will elaborate on the implications of the approach in the next sections.
As a result of the active investing style and also the use of leverage, the fund's expenses are relatively high in my view. To wit, the fund's total expense ratio, excluding interest expense, is 1.92%. The total expense ratio, including interest expense, is 5.12%.
Implications from an inverted yield curve
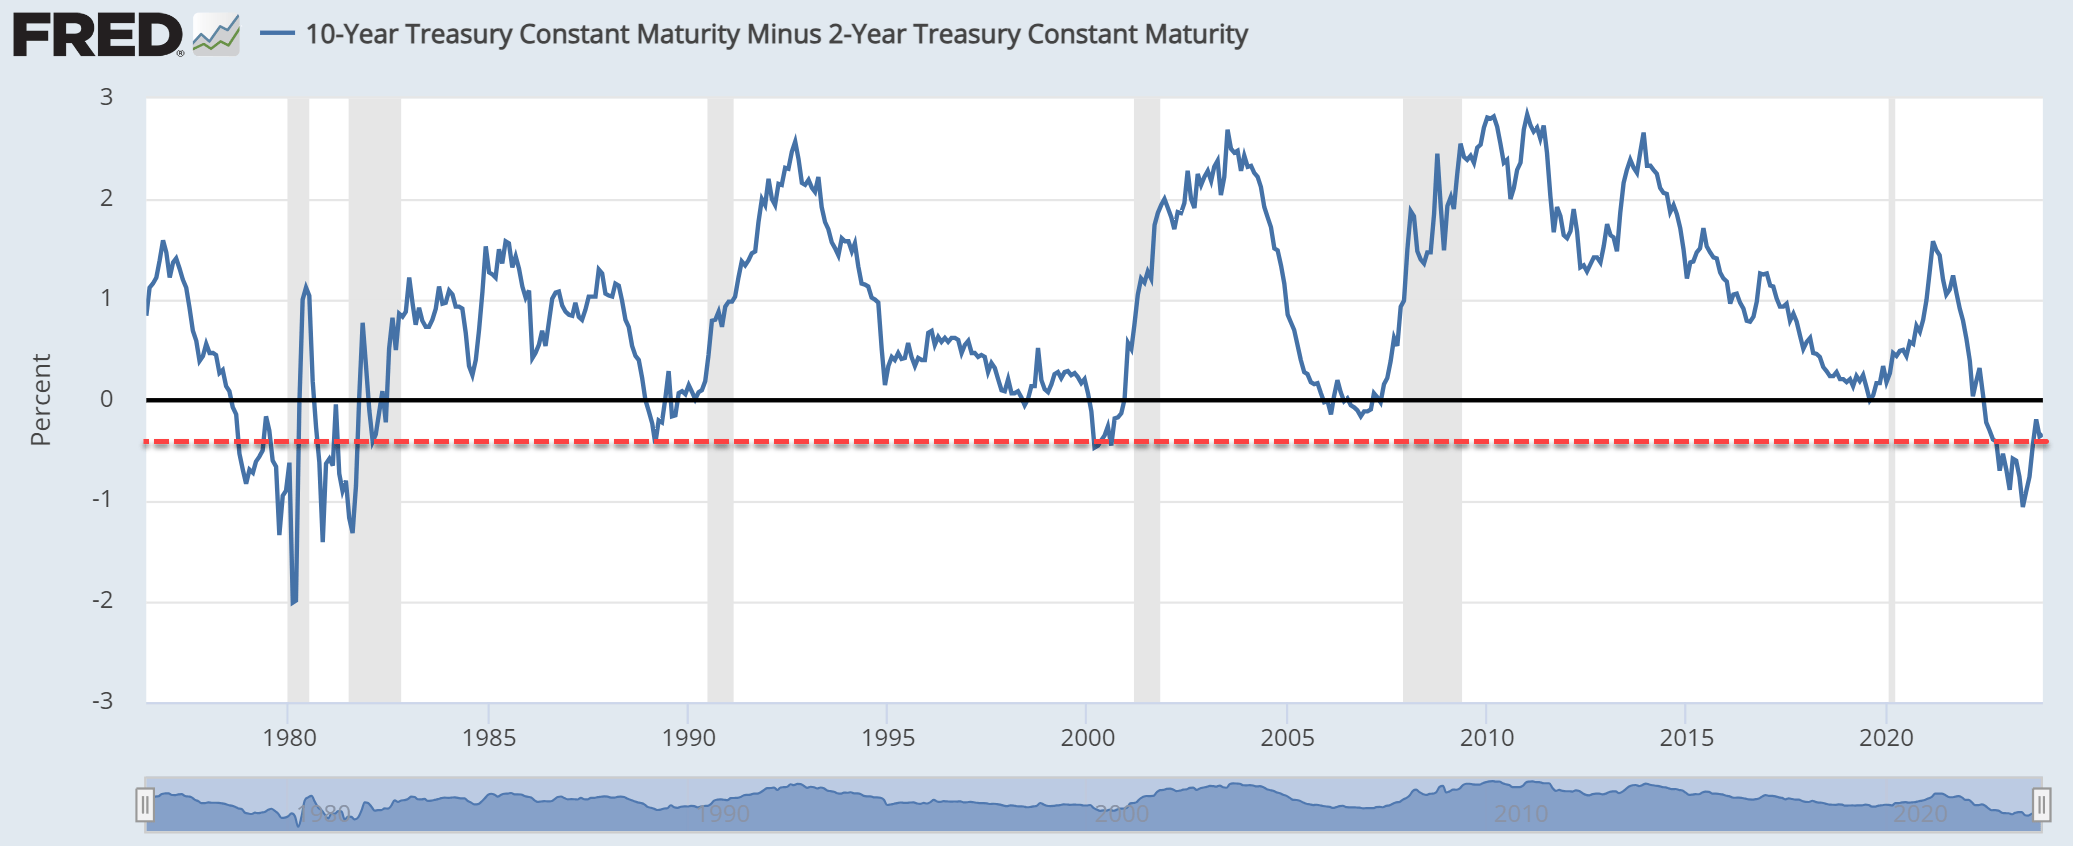
An inverted yield curve has historically been a reliable predictor of recessions. The chart below shows the yield spread between 10-year and 2-year Treasury bonds since the 1980s. As you can see, the spread has inverted several times in the past, and each time it has been followed by a recession. Currently, the yield curve is not only inverted as seen but also invested towards the deeper end historically.
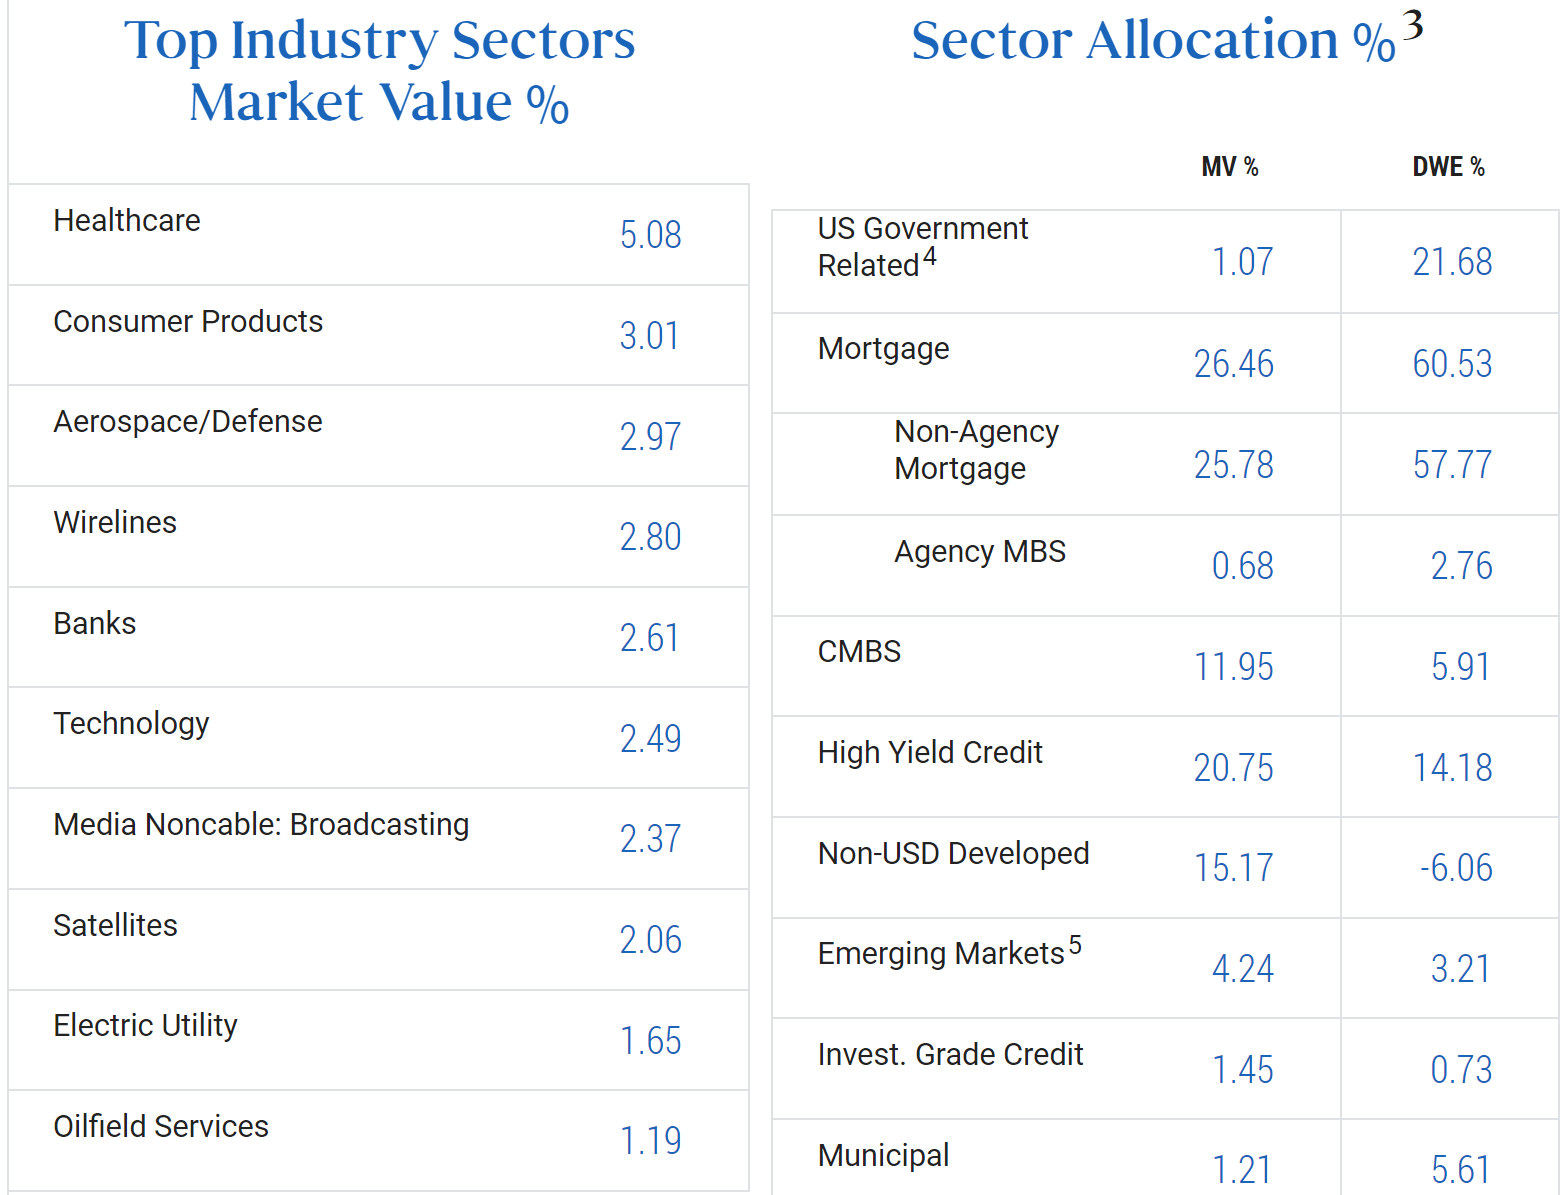
As such, there are good reasons to prepare for a recession in my mind. And I don’t think the exposure in PDI is well-positioned for these purposes. As seen in the chart below, in terms of sector allocation, the fund’s top 3 exposures are mortgage, U.S. government bonds, and high-yield credit when adjusted for duration. To be more specific, after adjusting for duration, its exposure to mortgages is almost 61%. To make the risk profile even more concerning for me, the majority of the exposure consists of non-agency mortgages (about 58%). As detailed in our earlier articles , the narrower the yield spread, the harder it is for the non-agency mortgage sector to make a profit.
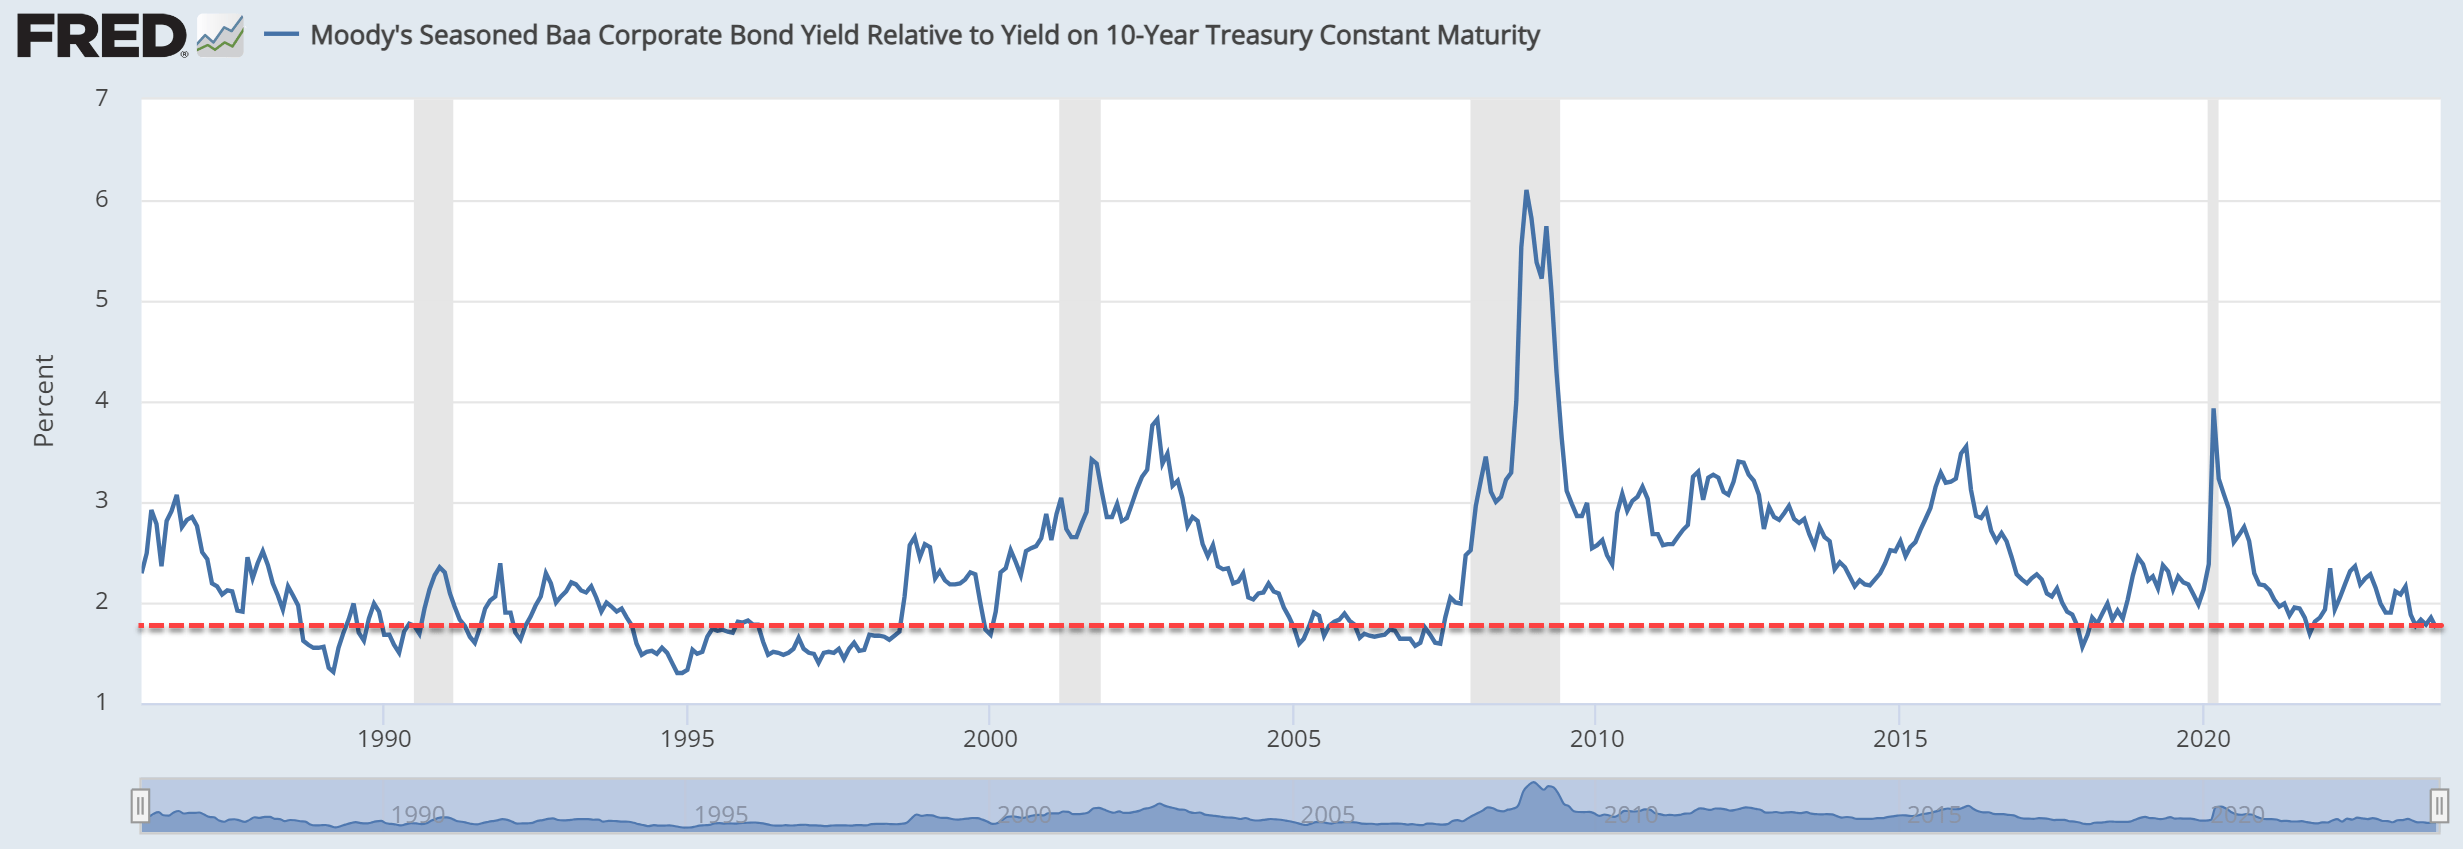
I do not feel comfortable with the high exposure towards high-yield credit either (with a duration adjusted weight of 14%). As you can see from the chart below, the spread between BAA bonds (which I use to approximate high-yield bonds) and Treasury Rates currently hovers around a very thin level of only ~1.75%. For readers new to this concept, the spread is a key parameter that we closely monitor to gauge the risk premium of high-yield bonds against risk-free rates. Historically, the yield has been in the range of ~1.9% to 3.2% most of the time. The current yield is substantially below this range and signals high risk premium to me.
Expected return/risk profile
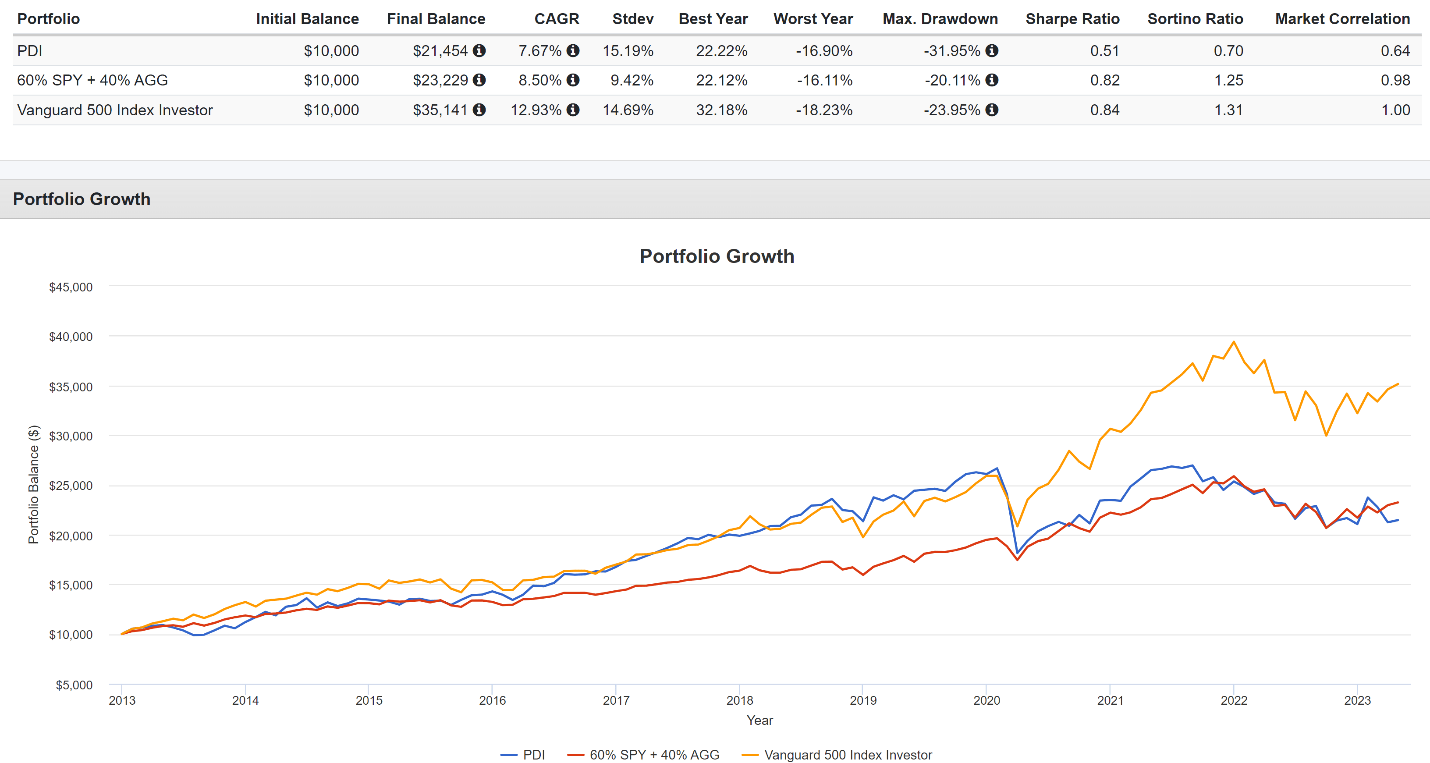
Historically, PDI has lagged both the overall equity market and also simple allocation models (such as a 60-40 model). As seen in the chart below, since 2013, PDI delivered a total return of ~7.6% CAGR. In contrast, S&P too returned almost 12.93% and a 60-40 model 8.50%. Of course, a 7.6% return over 10 years is a solid return and nothing to be sneered at. My goal is NOT to argue that PDI is a bad fund (more on this later). My argument is that it is very likely to continue underperforming both the S&P 500 and a simple 60-40 model going forward (say in the next ~2 years) due to its exposure as analyzed above.
At the same time, PDI’s combination of its particular exposure and the use of leverage has caused much higher volatility risks. As seen from the chart, PDI’s volatility risks exceeded both the S&P 500 and a 60-40 portfolio by all typical metrics such as standard deviation, worst year performance, and also maximum drawdown. Especially in terms of maximum drawdown, PDI's ~32% far exceeded both S&P 500 (about 20%) and a 60-40 portfolio (23%). If you share my view that a recession is a realistic scenario in the new future, the drawdown risk should be the primary risk of concern.
Other risks and final thoughts
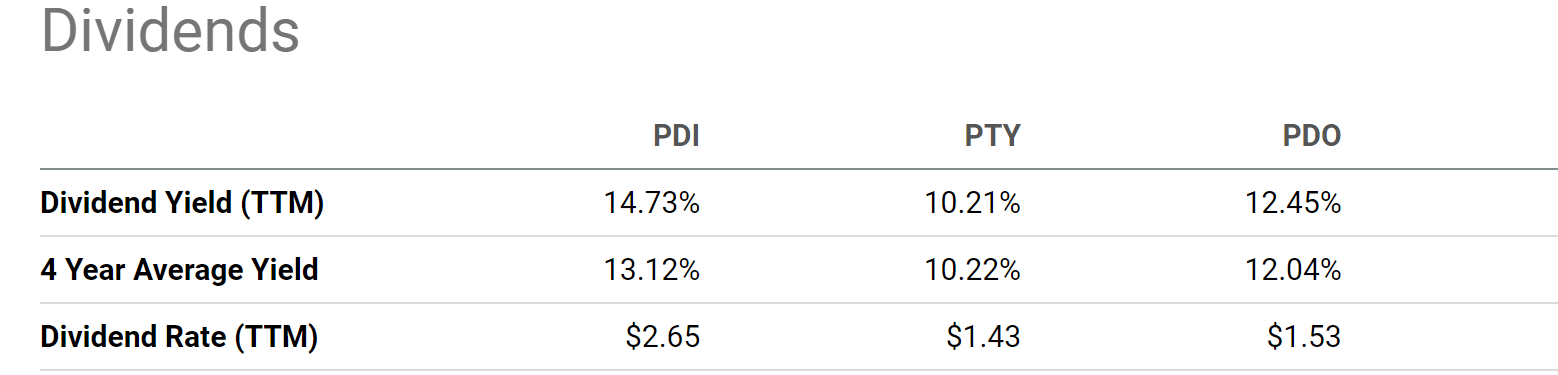
To reiterate, the thesis of my article is NOT that PDI is a bad fund. The fund has plenty of positives (such as its high yield) and serves its purpose - its primary mission is to provide income and capital appreciation only comes as a secondary goal. Furthermore, its current yield is also higher than its 4-year historical average (13.12%) and also its sister funds such as PTY and PDO.
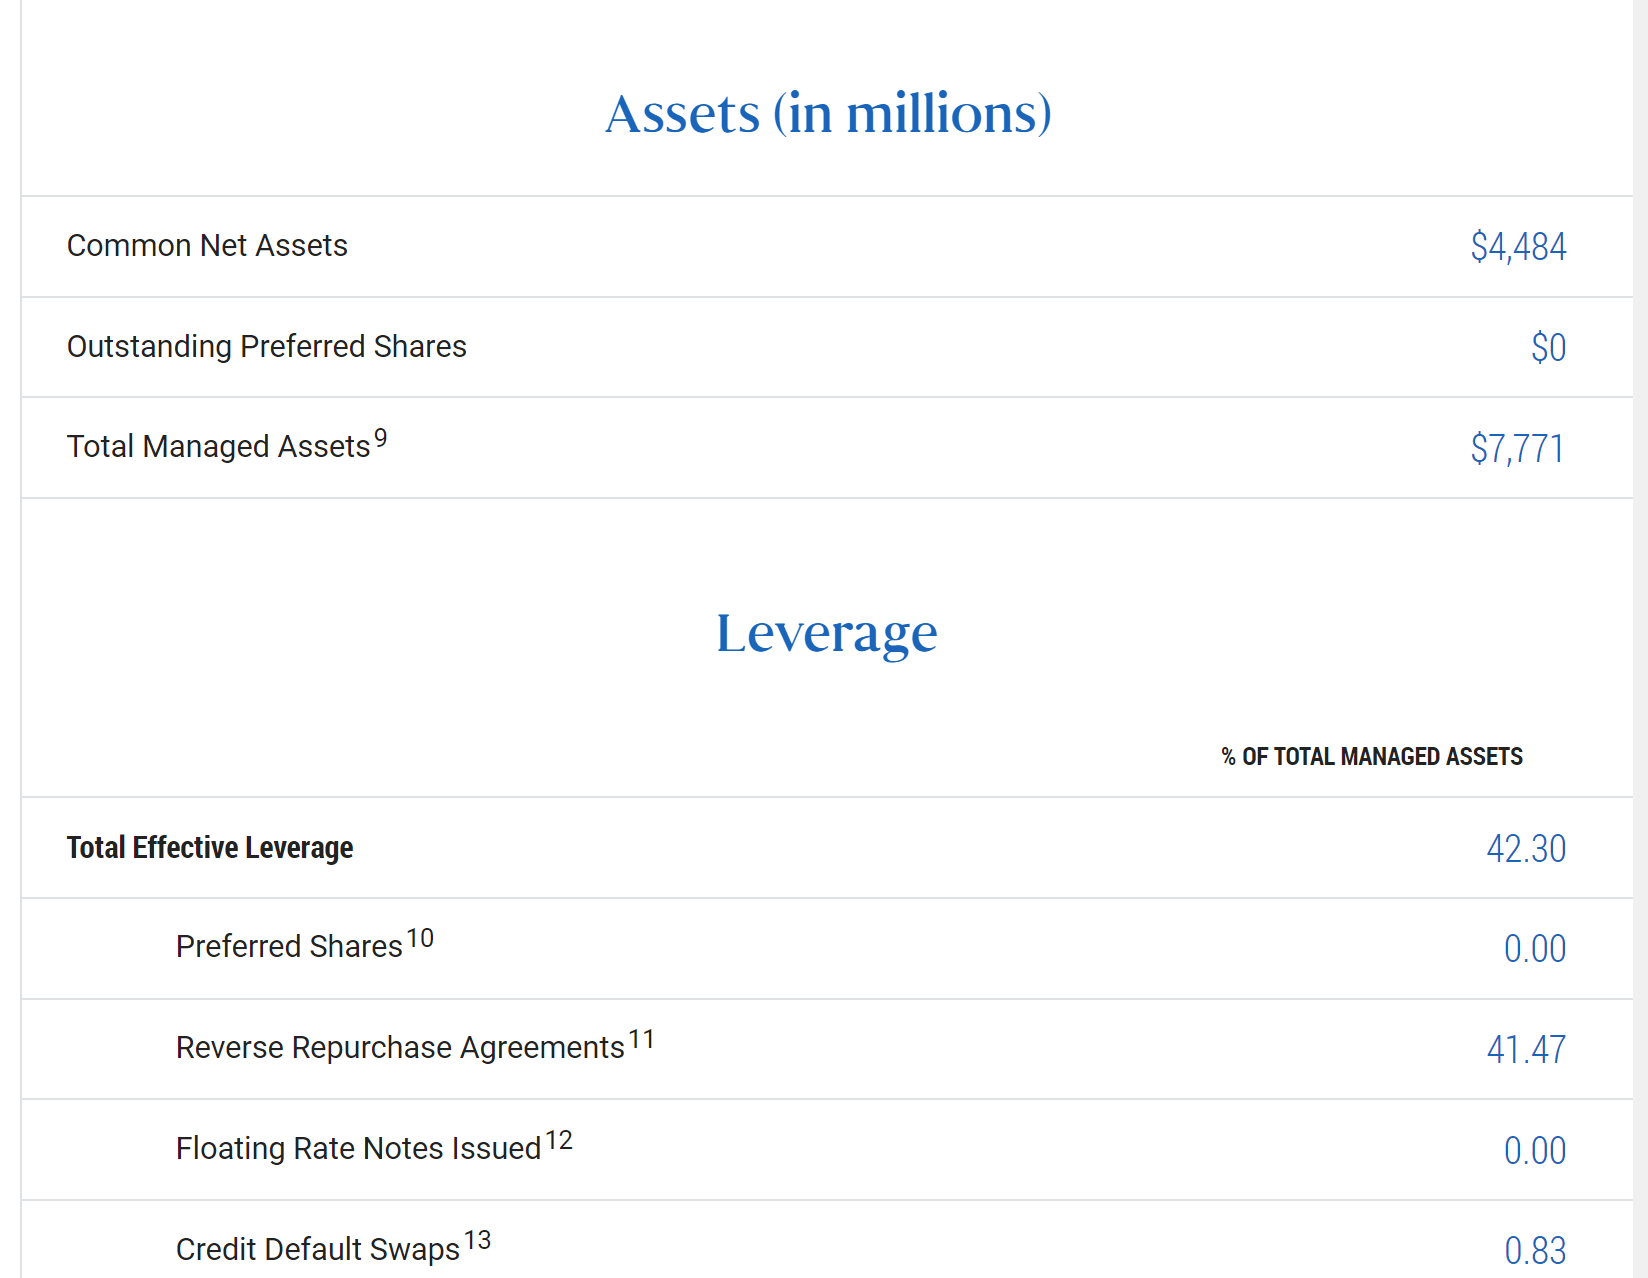
My thesis is to argue why I see good odds for PDI to continue lag behind the S&P 500 or a simple 60-40 model going forward. And to recap, my argument was anchored in a total of 2 considerations. First, the inverted yield curve. I view the inverted yield as a headwind on multiple fronts. I expect the inverted yield curve to pressure its key exposure such as mortgage and high credit. An inverted yield curve has also been a leading indicator of a recession historically. A recession tends to magnify PDI’s underperformance due to its exposure and use of leverage. And this leads me to the second key consideration. The fund is currently priced at a premium above its NAV and also employs relatively high leverage, a combination that further tilts the risk profile. To wit, the price premium is about 6.3% as of this writing, a substantial premium in my mind. The effective leverage hovers around 42% (see the chart below), also a bit too high in my mind given the current uncertainties and borrowing rates.
For further details see:
PDI: Lag Likely To Continue