PDO - PDO: Lessons I've Learned From PTY
2023-12-08 07:06:13 ET
Summary
- Like many of you, I was intrigued by the PIMCO Dynamic Income Opportunities Fund when it first came out.
- I always prefer funds with a longer history and, therefore, more data to evaluate.
- In PDO's case, I am glad I took the time to wait and evaluate.
- This article shares the lessons and notes I gathered, primarily by comparing it to the PIMCO Corporate and Income Opportunity Fund.
- Looking ahead, I see too much risk for both funds, especially PDO, given the inverted yield curve, use of leverage, and risk-premium in high-yield assets.
PTY and PDO: the old and the new
The PIMCO Dynamic Income Opportunities Fund ( PDO ) is a relatively new addition to PIMCO's CEF offerings. The PDO fund has quickly amassed an AUM of more than $1B (in terms of common net assets) since its launch in 2021. There are certainly good reasons for its quick rise in popularity among income investors. PIMCO is the world's leading fixed-income investment manager. PDO offers a new fund for investors to benefit from PIMCO's expertise and experience in navigating complex fixed-income markets. Like many of its sister funds, PDO also utilizes a dynamic asset allocation strategy, meaning it can invest across various fixed-income sectors globally. This allows the fund to seek opportunities in sectors offering the highest potential returns on a global scale.
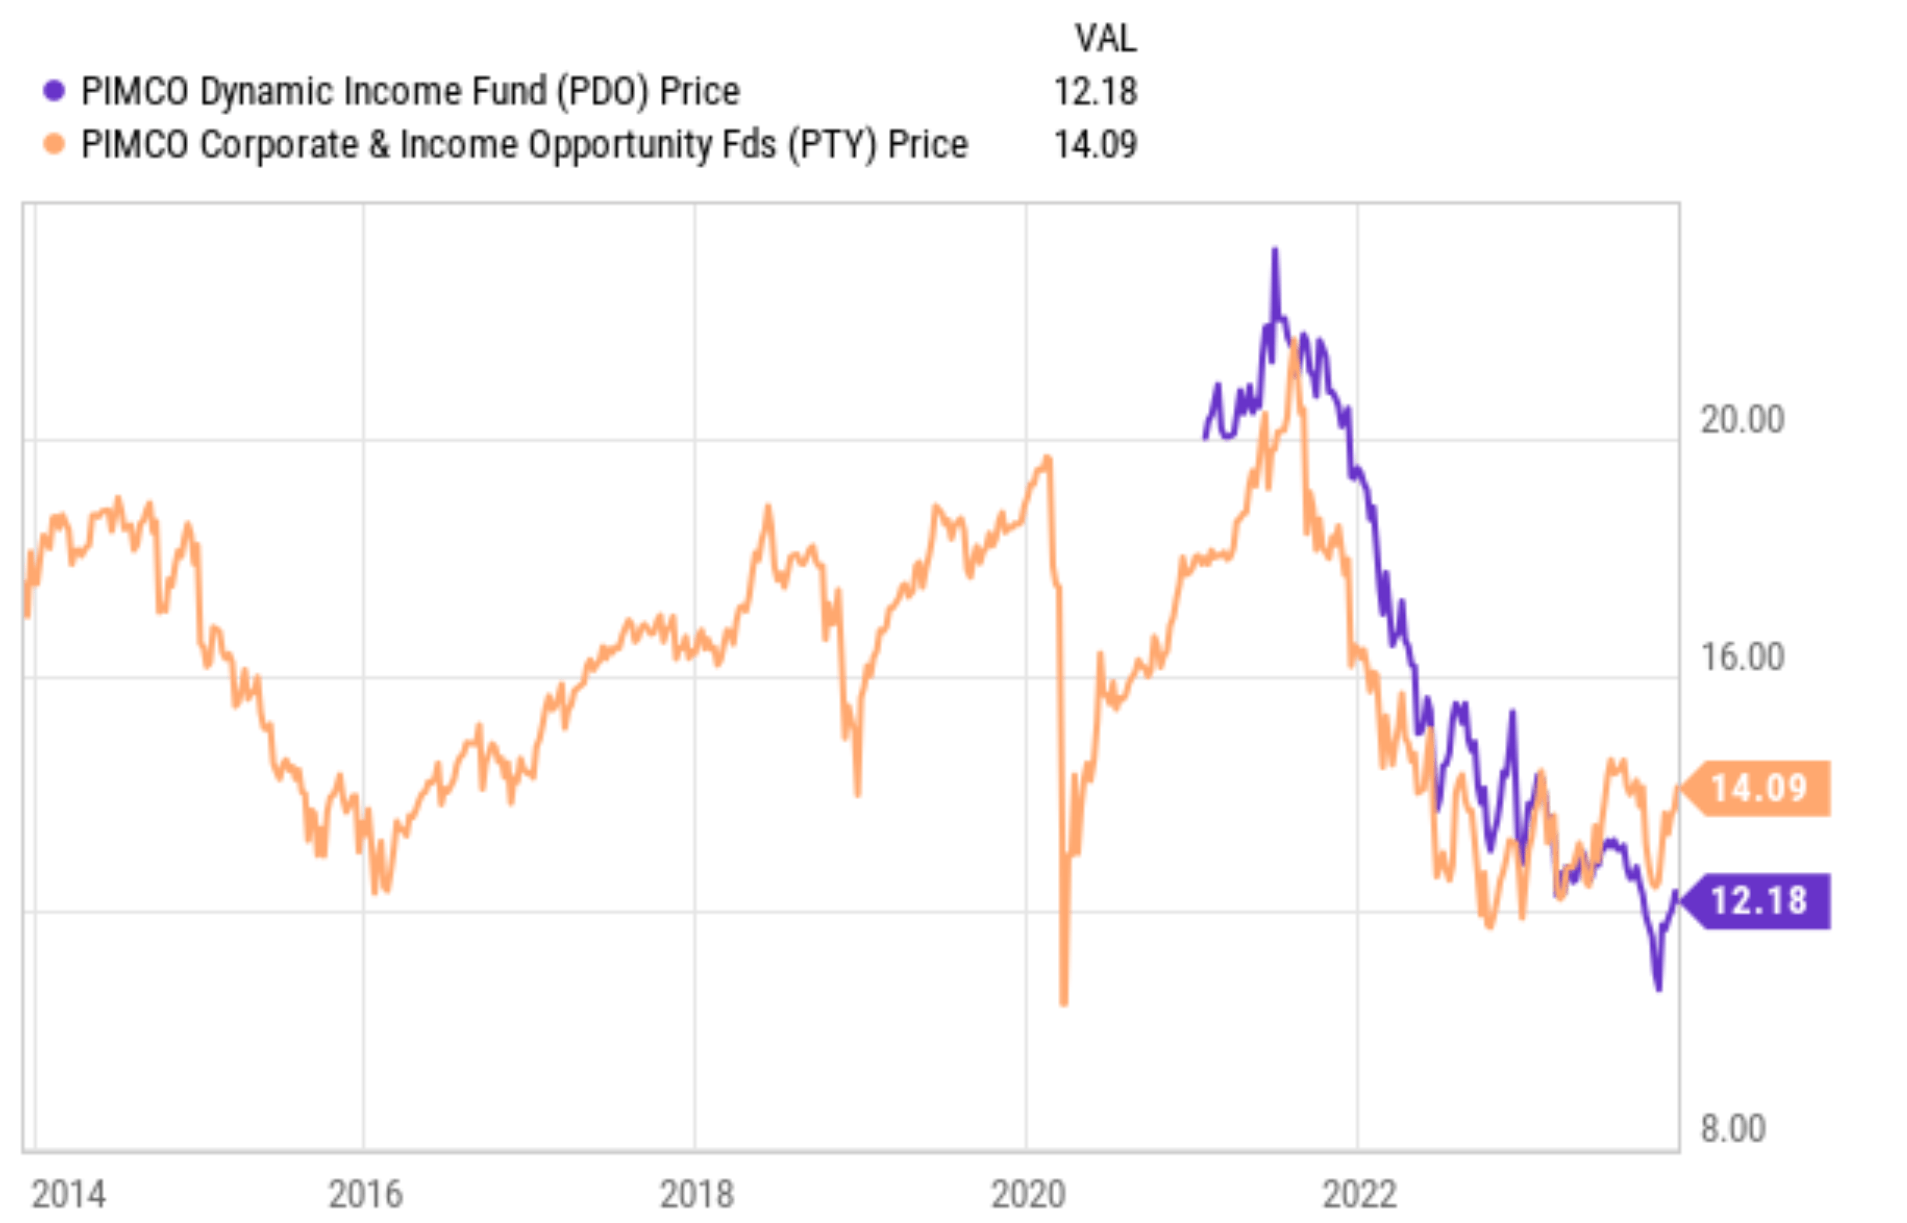
However, probably like many of you, I always prefer funds with a longer history and more past data to evaluate. It is obviously impractical to wait for years for the funds to accumulate data. Therefore, a typical approach that I use is to search for a similar fund with a longer historical, and then use that fund's historical performance to extrapolate the new funds prospects. In this case, it was fortunate that PIMCO has another offering, the PIMCO Corporate and Income Opportunity Fund ( PTY ), which employs a very comparable strategy to PDO in my view. At the same time, PTY has a much longer history and offers a wealth of past data for evaluation. Well, I am glad I took the time to evaluate on the sideline. As seen in the chart below, PTY has suffered large losses since its inception.
The remainder of this article will share the notes I gathered from this comparative analysis. I will elaborate on:
- The reasons that make PTY comparable to PDO
- The lessons I've learned from PTY, in particular, the pressure on its holdings from an inverted yield curve and the risk premiums in its high-yield holdings
- The conclusion that both funds, especially PDO, currently face several key risks. These risks outweigh the potential rewards in my view
What makes PTY comparable to PDO
Let's start by reading the fine print in their fund description. The following description is quoted from the PIMCO webpage . I made a few minor changes to make the grammar flow and the highlights were added by me.
PDO employs a dynamic asset allocation strategy across multiple fixed income. The fund will normally invest at least 25% of its total assets in mortgage-related assets issued by government agencies or other governmental entities or by private originators or issuers. The fund may invest up to 30% of its total assets in securities and instruments that are economically tied to "emerging market" countries.
PTY uses a dynamic asset allocation strategy that focuses on duration management, credit quality analysis, risk management techniques, and broad diversification among issuers, industries, and sectors. Under normal market conditions, the Fund seeks to invest at least 80% of its net assets plus borrowings for investment purposes in a combination of corporate debt obligations of varying maturities, other corporate income-producing securities, and income-producing securities of non-corporate issuers, such as U.S. Government securities, municipal securities and mortgage-backed and other asset-backed securities issued on a public or private basis. The fund may invest a maximum of 25% of its total assets in non-U.S.-dollar-denominated securities and a maximum of 40% of its total assets in securities of issuers located in emerging market countries.
With this, you could probably tell the underlying strategies for both funds are quite similar. They both employ a dynamic asset allocation model, focus on high-yield instruments such as mortgage-backed securities, and have significant exposure to emerging markets. At the same time, both funds also maintain an intermediate average portfolio duration of zero to 8 years.
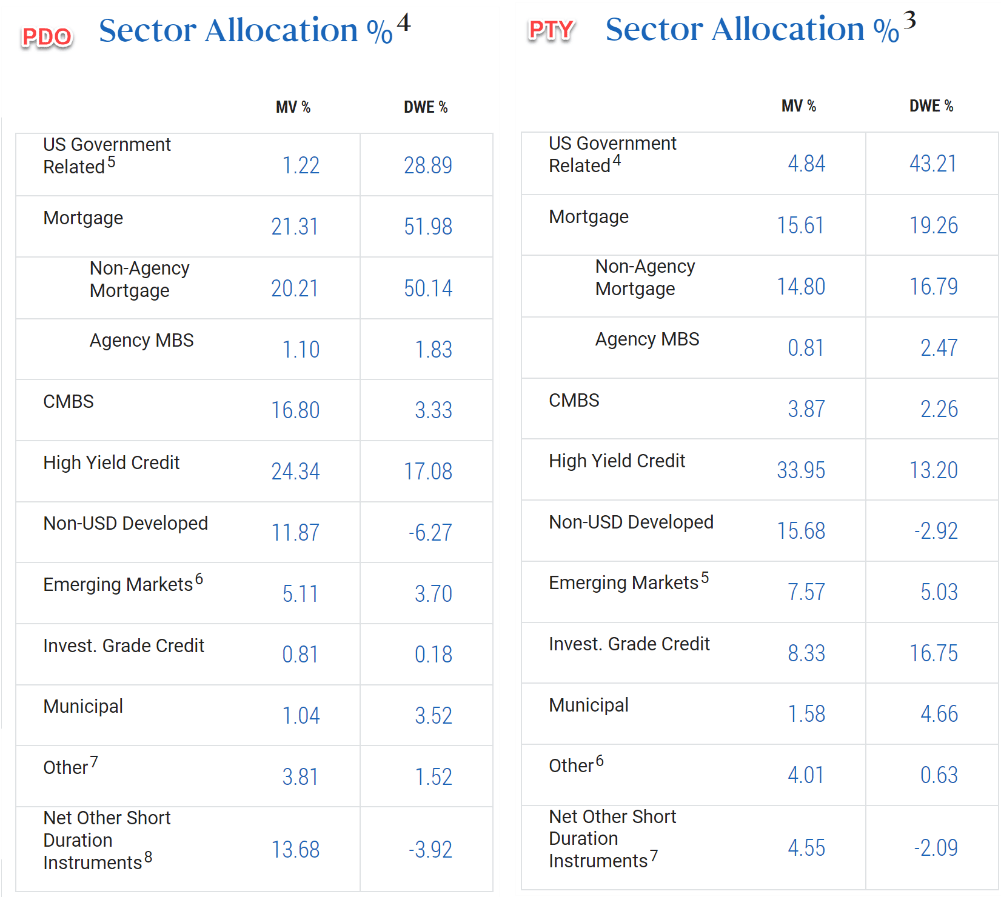
These similarities are directly reflected in their specific holdings, as illustrated in the next chart below. As seen, both funds have a large exposure to mortgage-related assets in terms of market value. PDO's exposure is about 21% and PTY's about 15.6% for PDO. They also both have large exposure to high-yield credits.
A key difference is that when their exposures are adjusted for duration, PDO has a much lower exposure to U.S. government bonds (29%) compared to PTY (43%) and much higher exposure to mortgage-related assets (almost 52% vs. PTY's 19%).
Next, I will explain why such exposure is very concerning in my mind.
Yield curve inversion
The key reasons for my concerns are twofold: the inverted yield curve and the risk premium associated with high-yield instruments.
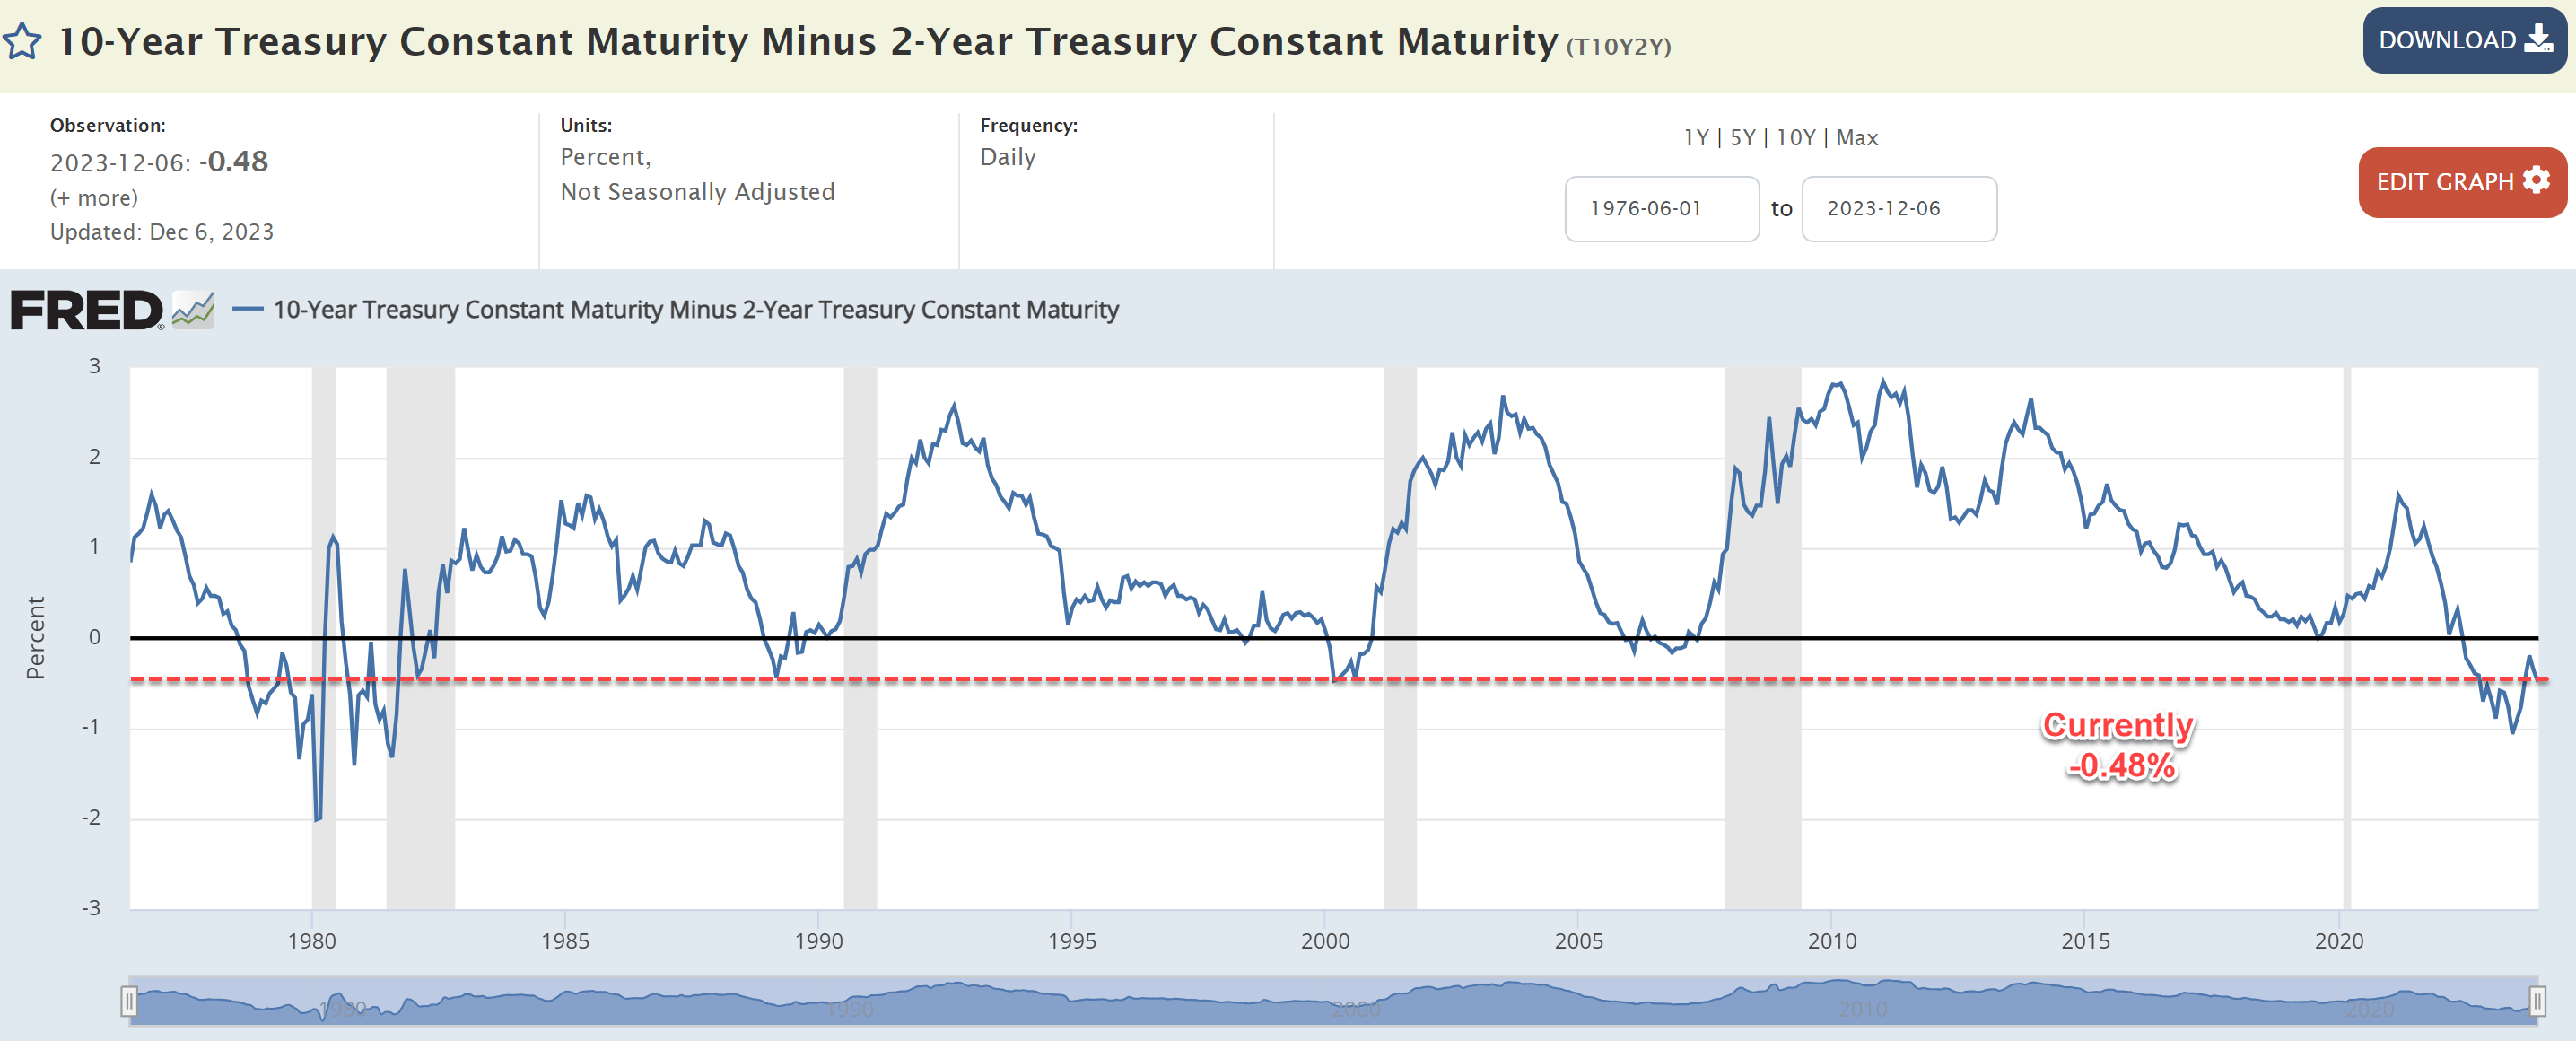
Let's examine the yield curve first. The chart below displays the spread between the 10-Year Treasury Constant Maturity rates and the 2-Year Treasury Constant Maturity. As seen, the spread sits at -0.48% as of this writing. Comparing the current situation against the longer-term trend, two observations stand out to me. First, the current level of inversion is among the deepest since 1985. Second, the duration of the current inversion is approaching the typical lead time between the beginning of inversion and the beginning of a recession.
Both considerations heighten the risks for the exposures in PDO and PTY. As just mentioned above, both funds have high exposure (especially PDO when adjusted for duration) to mortgage-backed assets, which are sensitive to the yield spread as argued in my earlier article . These assets make money by borrowing money at shorter-term rates and lending them out at longer-term rates. An inverted yield curve, especially one that persists for a prolonged period of time, creates large pressure on their profitability.
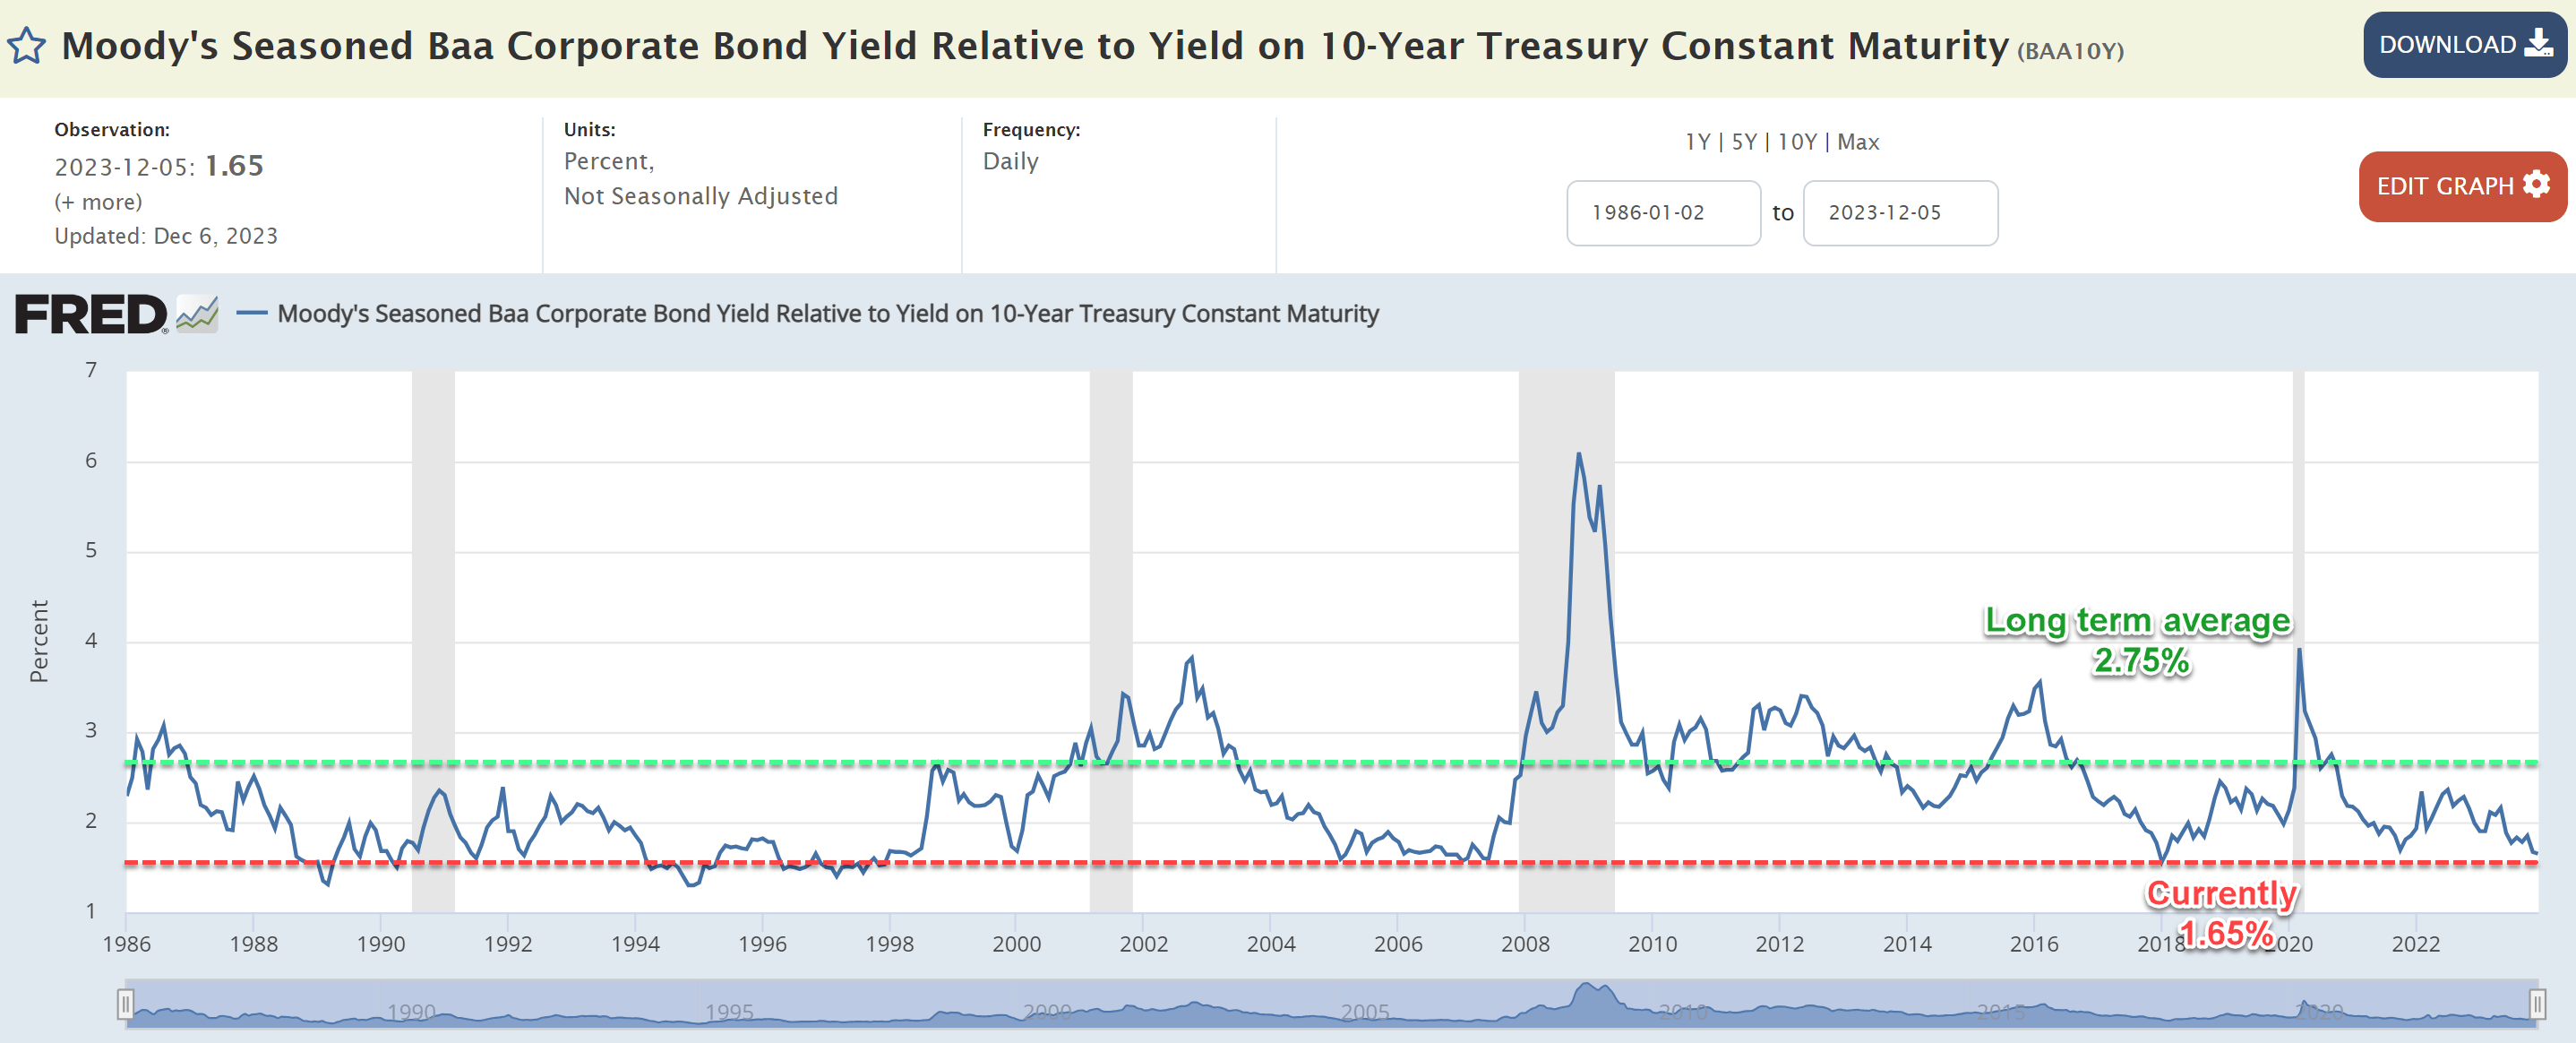
Besides the risks associated with their mortgage-related assets, there are also good reasons to be concerned about their exposure to high-yield corporate assets. As seen in the second chart below, the current yield spread between BAA bonds (which I use to approximate the overall high-yield corporate bonds) and risk-free rates (which I approximate by the 10-year treasury rates) is among the lowest levels since the 1980s. Such a thin spread implies an extremely high risk-premium for high-yield corporate assets in my view.
PDO's future extrapolated from PTY's history
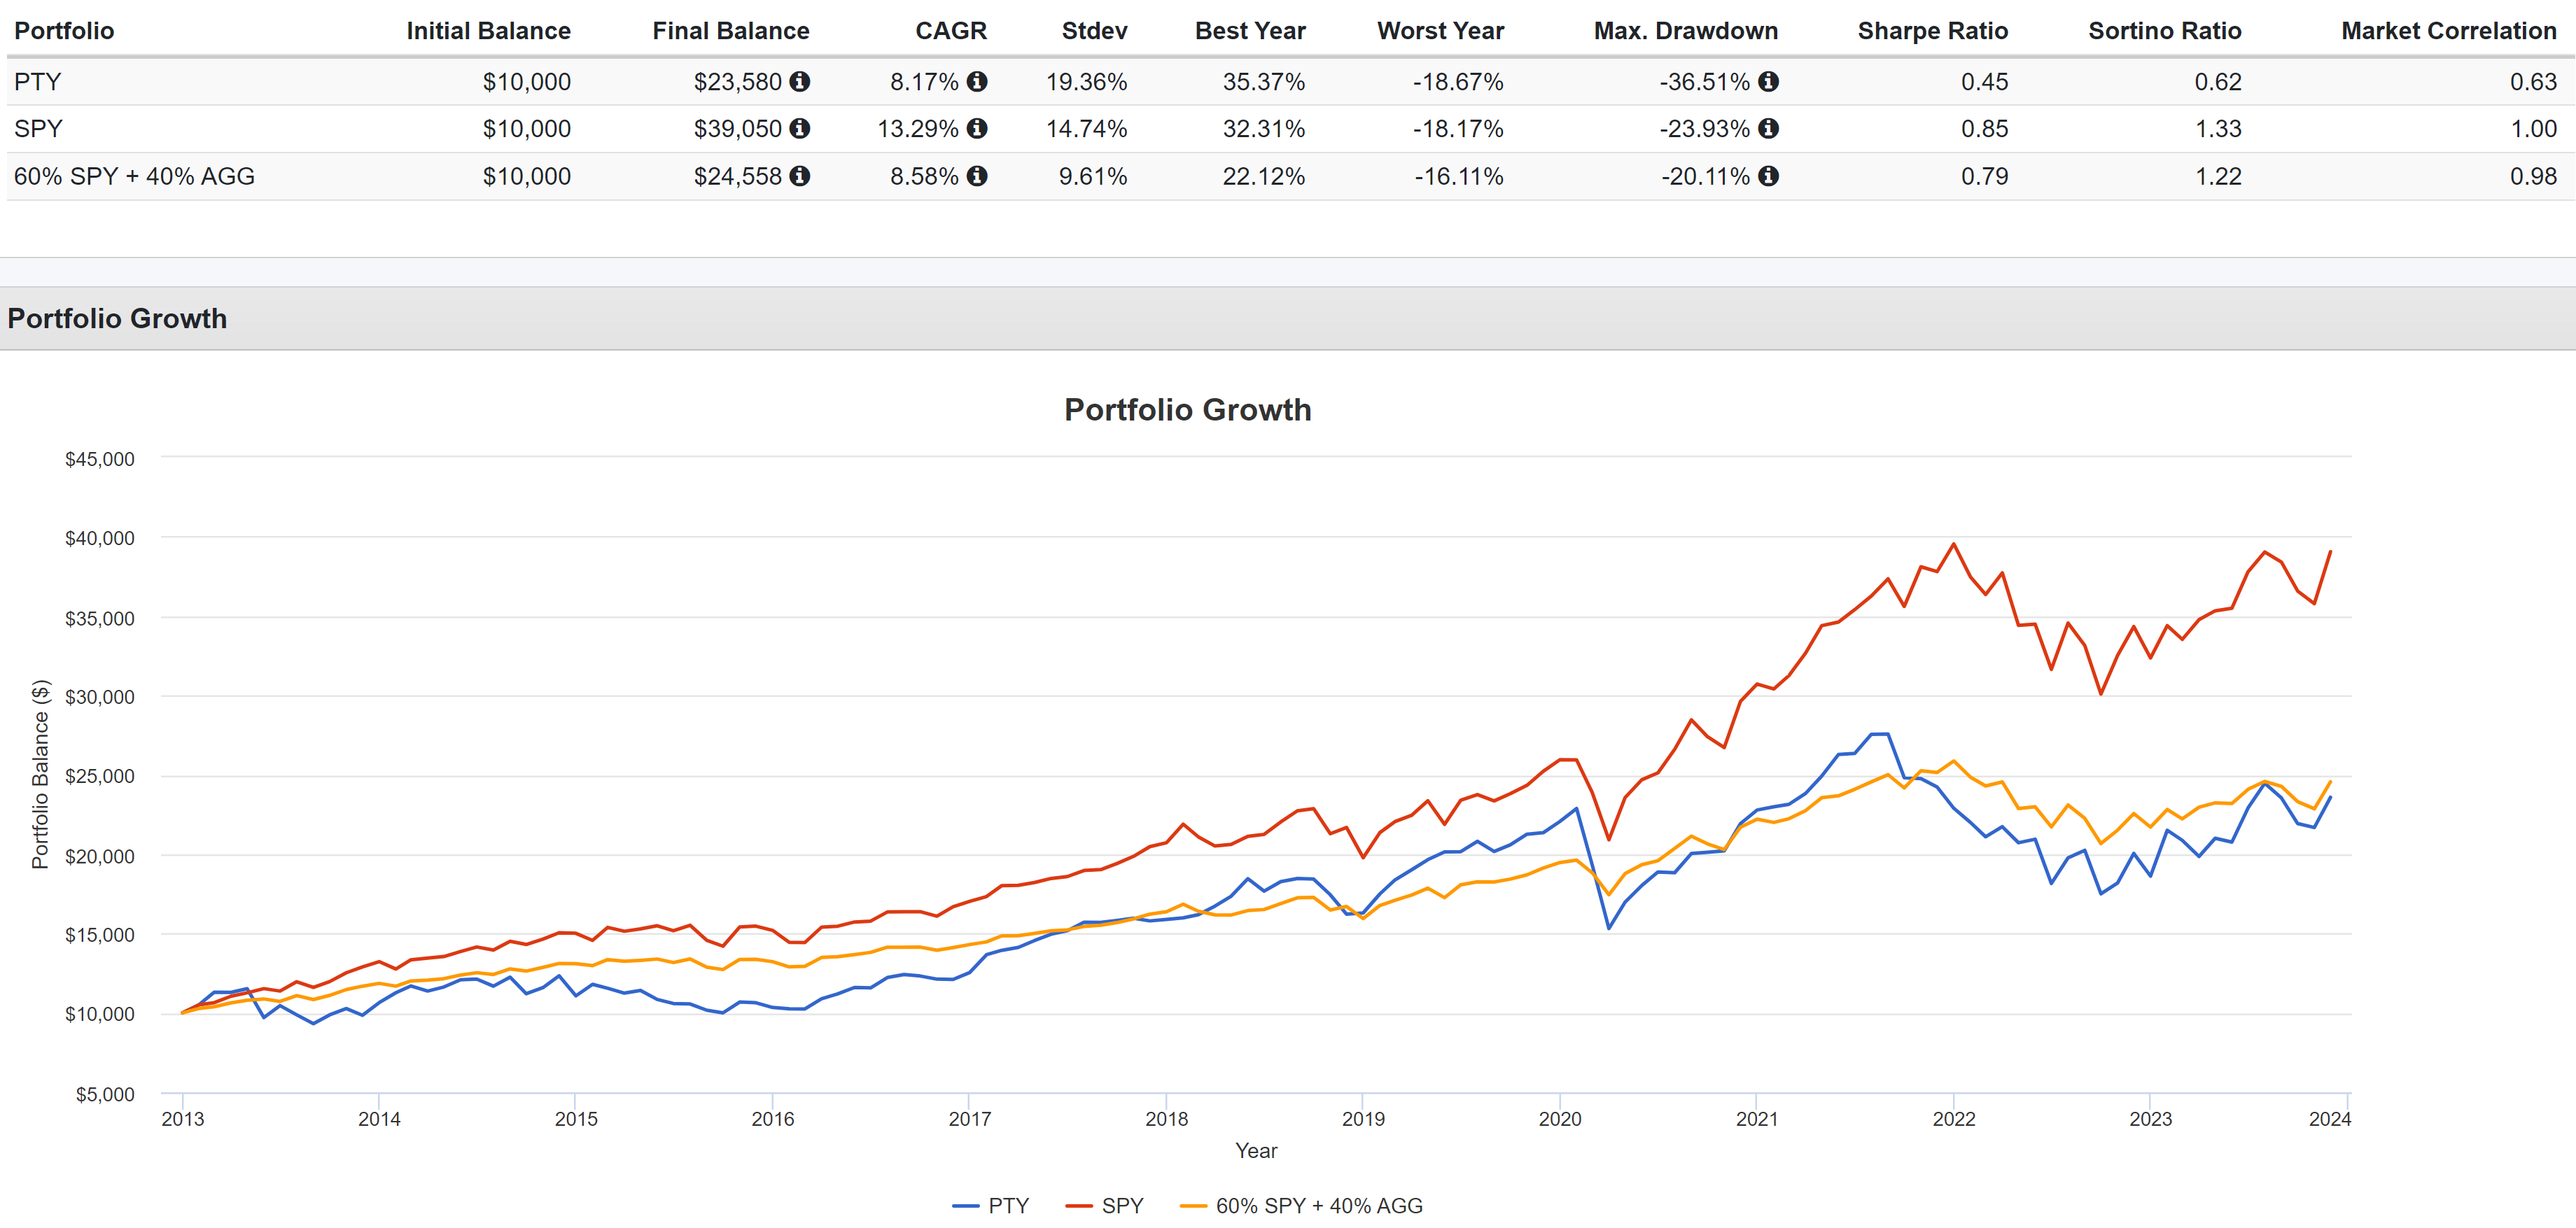
As mentioned upfront, the entire premise of my analysis is that, because of the similarities in their underlying strategy, I can use PTY's history data to extrapolate PDO's future prospects. And the bad news is that the historical performance is not in PTY's favor. The chart below shows PTY's total return in the past 10 years. As seen, PTY has lagged behind the S&P 500 and a simple 60-40 allocation in terms of total return while suffering larger volatility risks.
Also, bear in mind that the past 10 years since 2013 witnessed probably the lowest interest rates in history, which is a strong headwind for PTY on multiple fronts. A lower interest rate reduces the borrowing cost of the fund (which uses relatively high leverage, more on this later) and boosts the valuation of most of its holdings.
Looking ahead, I see the reverse for PTY and especially PDO given yield spread and their exposures as detailed in the previous section. In particular, I want to draw your attention to the worst drawdowns that PTY has suffered in the past. As seen from the data below, in the past decade, PTY's worst drawdown has been 36.5%, far worse than the S&P 500 (about 24%) and a 60-40 model ("only" 20%). As aforementioned, I see a realistic possibility for a recession given the duration of yield curve inversion. And I expected even worse drawdowns for PDO given its higher exposure to mortgage-related assets and high-yield credit and lower exposure to U.S. government bonds (all in terms of duration-adjusted weights).
Other risks and final thoughts
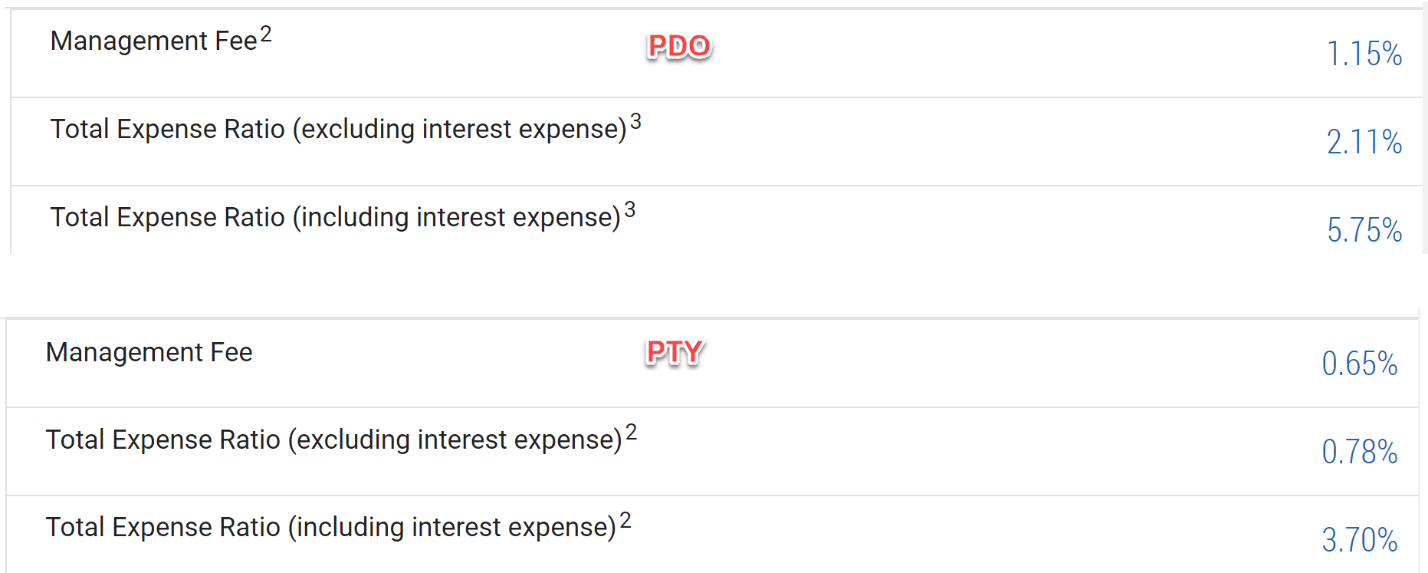
Besides the risks mentioned above, it's important to comment on the leverages that these funds use. PDO uses a much higher leverage (total effective leverage is at 41.85% as of this writing) than PTY's (27.31% as of this writing). Of course, leverage is a double-edged sword that magnifies both the gains and losses. It is just under current conditions as mentioned, I see larger downside risks than upside risks for the use of leverage. Besides higher leverage (and thus also higher borrowing expenses), PDO also charges a much higher fee than PTY. As seen from the chart below, the total expense ratio of PDO (excluding interest expense) is 2.11% currently, compared to only 0.78% from PTY.
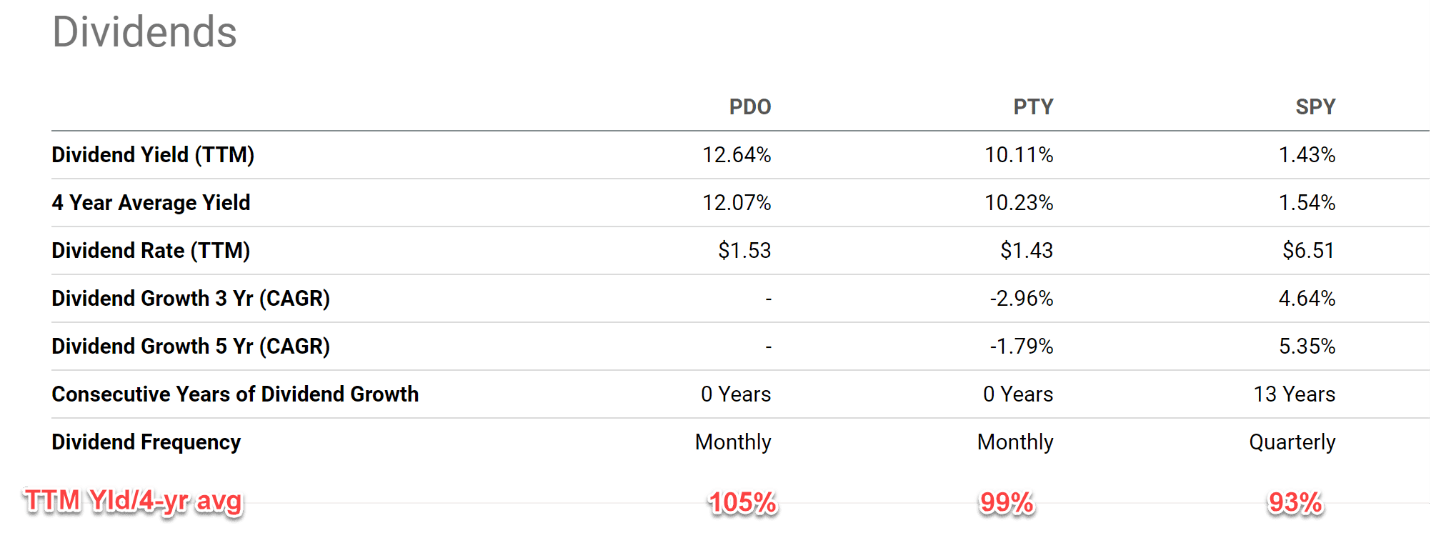
Before closing, let me make it perfectly clear that my goal is to argue that PTY and PDO are bad funds. As mentioned upfront, both funds are managed by highly knowledgeable and reputable teams. And PTY has fulfilled its mission statement (i.e., provide income) beautifully in the past. I have no doubt that PDO would do the same. In particular, both funds are currently yielding far above the overall equity market (see the chart below) or the bonds market. Furthermore, judging by their average dividend yields in the past 4 years, both funds are currently trading near a fair valuation as seen in the chart below. In contrast, the overall equity market is trading at a sizable valuation premium.
My goal is to anticipate the risks for PDO by studying PTY's given PTY's longer history. My overall conclusion is that, if history is of any guidance, I see more downside risks lying ahead than upside risks when measured in total returns and volatility risks. Particularly, I see even higher risks in PDO compared to PTY because of its high exposure to more risky assets, lower exposure to U.S. government bonds when adjusted for duration, use of higher leverage, and high expense ratios.
For further details see:
PDO: Lessons I've Learned From PTY