RCM - Pediatrix: P&L Still Burdened From RCM Overhang Reiterate Hold
2023-05-06 00:21:24 ET
Summary
- Pediatrix came in with mixed Q1 earnings from top to bottom line.
- Long-term analysis suggests that the firm has been scaling back investment capital on a sequential basis since 2022.
- The returns generated on MD's growth investments haven't beaten the hurdle rate, and could struggle to going forward.
- Investors aren't going to reward that kind of set up in my opinion. Reiterate hold.
Investment Summary
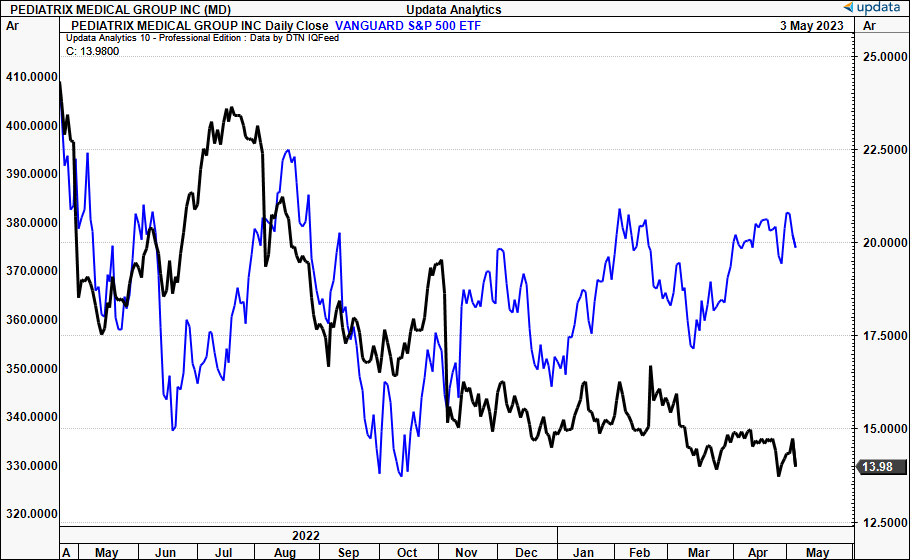
Numbers and narrative now align for Pediatrix Medical Group ( MD ) after gleaning from its Q1 FY'23 results. MD's market valuation has clearly diverged from the S&P 500 index's return since the October 2022 bottom [Figure 1]. I had revised MD down from a buy to hold in December citing many reasons. Here I'll broaden the coverage and look to why MD hasn't created additional market valuation for its shareholders. The price response following its latest numbers been flat and the stock trades near 52-week lows at very compressed multiples of 10x forward earnings and 1.1x book value.
Bottom-fishers may find happiness in scouring the depths of the valuation buckets and MD at 10x forward earnings is just that. Buying this paediatric puppy gets the investor a potential 8.2% forward earnings yield and projected 41% YoY growth in free cash flow per share. MD could do $2Bn in top-line revenues this year all going well and pull this to $260mm in core EBITDA netting a 13% pre-tax margin, not wide enough in my opinion to park investor capital on for the choppy market ride ahead. Here I explain why I believe the market has MD stock valued correctly at a 64% discount to the sector and that valuation upside could be challenging based on forward-looking fundamentals. Net-net, a $15-$17 price range looks fair going ahead, leaving little to be desired at the time of writing. Reiterate hold.
Fig. 1 – MD diverging from equity benchmarks
MD Q1 earnings breakdown
Mixed quarter for MD in Q1 as the RCM overhang, discussed at lengths in my previous MD publication, continues to burden the P&L. As a reminder, MD continues to face challenges in integrating R1 RCM (NASDAQ: RCM ) to provide its revenue cycle management ("RCM") services. (R1 has been covered in detail previously, rating it a buy, view the publication, click here ). The major issue is that billing and cash collection is affected. Naturally, revenue and cash flow growth are each clamped. For example, in the last report, I estimated $25–$30mm in revenue [$0.36/share] from MD's Q3 FY'22 results. I estimate a similar sized result in the Q1 top-line.
Speaking of the quarter, MD booked $491mm in quarterly revenue, 180bps lift on last year, on adj. EBITDA of $40mm. Total same-unit revenue increased by 2% but was hampered by the RCM issued as outlined. Again, pay collections have been the major impact from the issue in integrating R1's services. But looking downstream, the net impacts of the cash conversion headwinds actually hinder company growth. Due to these bottom-line compressors, MD is forced to snip overhead, and by extension, investment into growth initiatives. My opinions on this issue remain unchanged from the last publication, in that MD has serious work to do in order to make up for the short-fall in lost revenue, EBITDA and cash flow.
Thankfully, trends here are commendable, as operating cash flow relative to accounts receivable has improved since December FY'21. Here I took rolling TTM periods back to Q3 FY'20 and found that cash collection has curled up alongside revenue, as receivables began to roll over from Q2 FY'22 [Figure 2]. Two major observations:
- Looking at the low point in FY'21, the CFFO backing revenues was just 1.1%, accounts receivable 15%.
- Move to Q1 FY'23, there's 8.3% of CFFO backing turnover with accounts receivable at 14%.
This is a positive longer-term trend that could definitely add value if it continues. It tells me management have been diligently focused on improving the RCM situation in lieu of R1's software. Looking ahead, a move to 15–20% CFFO to sales would be an inviting proposition.
Fig. 2
Data: Author, MD 10-Qs
Turning to the firm's unit economics, total same-unit revenue gained 2%, but was mixed on contribution. Not to mention the RCM points discussed above. Consider the following key takeouts from Q1, observed in Figure 3:
- Factoring same-unit revenue as a function of volume, there was a YoY increase of 1.6%.
- Using this same function with neonatal services, same-unit revenues were down 2%, with NICU days down 0.4% as well.
- Looking at hospital services, same-unit revenue lifted 1.1%, along with 4% office-based uplift.
- The median YoY change in same-unit volumes was 0.35% (as a function of volumes).
As mentioned receivables are trending lower, that's for sure. But I'd still point out that days sales outstanding ("DSO") at 51 days has work to do to come back to the long-term DSO range of high 40's. This should be a major goal of MD going forward, in my opinion. Speeding up cash collection would have many positive downstream effects. Chiefly, bringing up the operating cash flow backing revenues. Further, freeing up capital and FCF for MD to allocate towards growth investments. Finally, it would improve liquidity and profitability overall anyways. The firm burnt $100mm in operating cash in Q1, versus $90mm last year. This, compared to just $7mm in CapEx. Hence, there's plenty of scope for MD to drive more capital towards investments into future growth. The fact the CapEx to Cash Burn gap is so wide makes me question if MD has adequate opportunities to plough money into growth. These are all challenges I've observed in my findings on MD.
Fig. 3 – MD same-unit revenue statistics
Data: Author, MD 10-Qs
Foreseeable value compressors
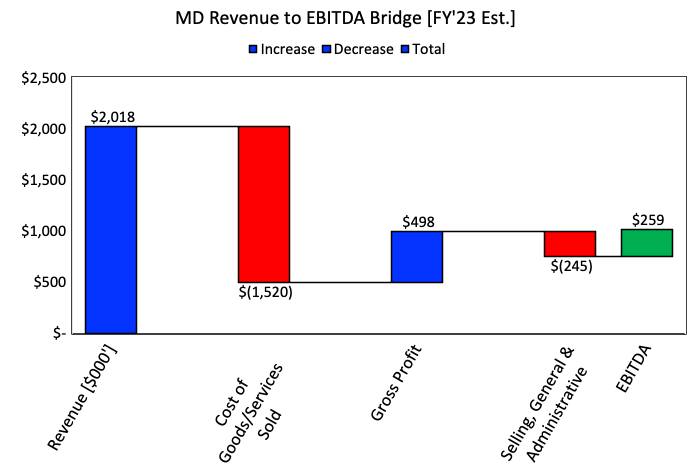
MD expects $245mm in adj. EBITDA at the upper range for FY'23. My numbers are sat slightly higher at ~$260mm. MD could to $2Bn in top-line revenues this year, and it wouldn't be unreasonable to expect a $500mm gross profit on this, or 25% gross margin. This would be getting back towards 2020 margin range of 26-27%, an encouraging sign in my opinion.
Just briefly, a couple things to consider on costs:
- Inventory costs on revenues are likely to remain at 75% in my opinion and my assumptions have operating costs at 13-14% of turnover going forward.
- As such, I wouldn't see EBITDA margins lifting from 13-15% if this doesn't change either. Usually, I'd be looking for some margin decompression or wide margin to begin with.
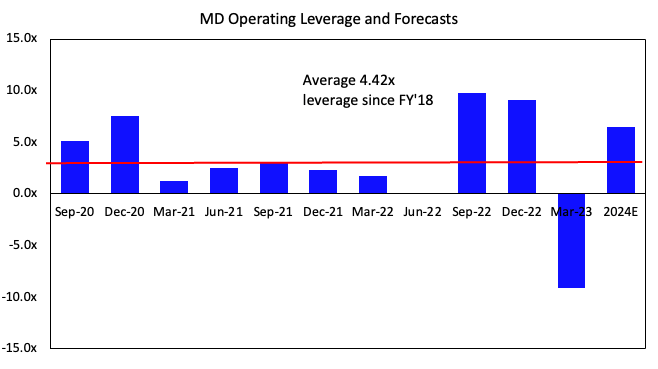
- One positive on costs however – operating leverage. This tells me of benefits in MD's fixed to variable cost structure. The continuously positive operating leverage suggests that fixed costs are a high percentage of overall business costs, meaning that as revenues increase, variable costs won't increase at the same speed. This was seen further in language on the earnings call : "G&A expense declined year-over-year and continues to reflect efficiencies we have created, primarily in the area of net staffing".
On a rolling TTM basis, MD has been ratcheting up the operating profit from revenue growth over the last 2-years [Figure 5]. I believe this could continue going forward and this keeps me interested in monitoring MD for the time being.
Fig. 4
Fig. 5
Despite the obvious benefits described above, it still doesn't change the fact that the market has compressed MD's market valuation by 26% over the past 12 months. I want to know, if profitability is such a strength, along with revenue, operating cash flow growth, why haven't investors assigned a higher market value on MD?
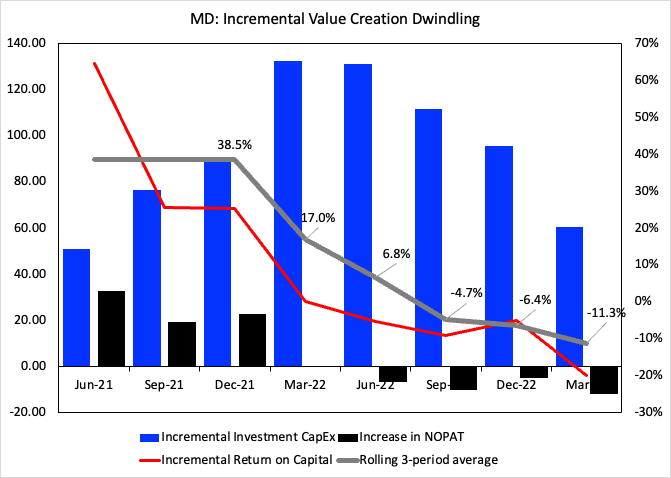
Back to thinking in first principles, there's an intricate relationship between a company's investment into new capital, the returns on this incremental capital, and growth in intrinsic value. Strictly speaking, those firms that manage to recycle profits into new, high-returning growth investments, compound intrinsic value at higher levels over time. More so, if the firm can invest inflated pools of capital at high rates.
Therein lies a noticeable trend for MD in this regard. Both incremental capital allocations, and growth in post-tax earnings, have rolled over from Q1 FY'22 to Q1 FY'23 [Figure 6]. As a result, MD's return on incremental investments from 2021–date have dwindled from 38% to negative 11% with no respite (3-month rolling average).
Intelligent investors measure how well a firm uses equity capital when choosing to invest in its stock. For performance, a firm's ROIC is an appropriate measure against the benchmark return to make informed decisions. Those firms investing retained earnings at above market rates will be rewarded with higher multiples. As noted below, the incremental negative change in MD's TTM NOPAT has widened since Q1 last year. This, coupled with a size down in sequential investments.
Hence, negative investment return with less capital invested, not the best formula to create value looking ahead. It stands to reason that investors have valued MD lower given that it is recycling capital below-market rates of return, therefore hasn't been the best use of investor money.
Fig. 6
Note: Incremental Investment is the total CapEx, change in intangible investment, Goodwill, and cash total cash acquisitions made each quarter, all on a TTM basis, and includes and capital contribution from net working capital. (Data: Author, MD 10-Qs )
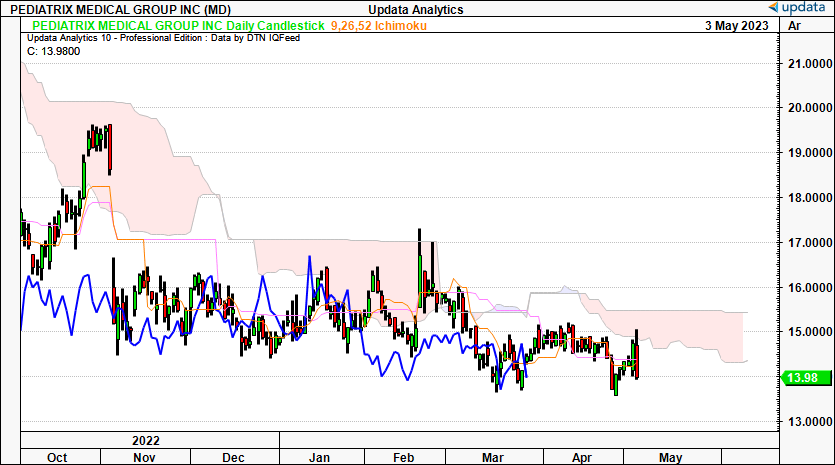
Technical outlook
To further illustrate the flat sentiment for MD right now, observe the following technical studies. The daily cloud chart below, that measures price action within a set of mathematically based time-frames which project back and forward 13–26 sessions, gives plenty of data. Note the stock has tried to enter the cloud but pulled back sharply with no success. It is therefore trading below the cloud, a bearish sign. Being a daily chart, it is bearish on a medium-term outlook, so the next few weeks.
A few other things to note. One is that price action has been flat since October last year, whilst broad equity markets have rallied back to the upside. At the same time, there's been no downside compared to many other names. Two, MD tested the $13.20 mark 3x over the past 2 months, before a jump back to range. Investors aren't net sellers in my opinion.
Fig. 7
Technically derived price targets from the point and figure studies below reveal similar sentiment. There are upside targets to $15, nothing exciting from the current market value. Until there's some upside (or downside) volatility on the chart, I wouldn't expect these to change in the near term by estimation.
Fig. 8
Data: Updata
Valuation
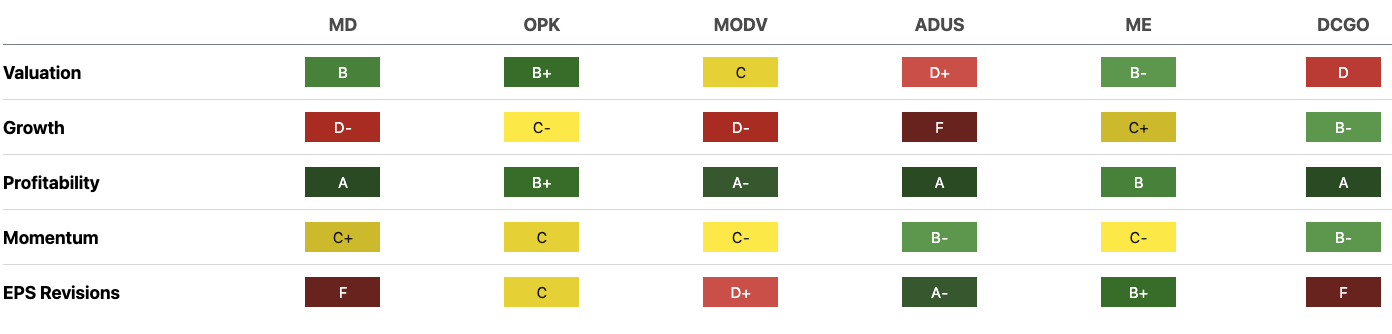
I mentioned earlier the market's got MD at 10x forward earnings at the time of writing. This is simply a tremendous discount from the sector's 28x multiple. Those scouring the depths of the valuation bucket could be interested at this, plus the 1x book value and 11% trailing ROE as well. There is grounds to be made on the market's rating – it attracts a B from the quant system's composite seen below [Figure 9]. Relative to peers, this is something to be considered.
Fig. 9 – MD comps table with SA quant composite
The next task is to observe what's on offer for the discount, to observe any mispricing of the expectations in MD's stock price. The question is why is MD priced to cheaply relative to the sector. I'd prefer to think in first principles here as well. Valuation is really measured by the contribution from current operations plus the contribution from future growth. Ideally, current operations come with wide growing margins, feeding loads of free cash after reinvestments for future growth. The growth function is measured by how much, and how well a firm reinvests capital to grow earnings.
In that vein, consider these points in valuation for MD:
- Revenues are stretching up on a sequential basis. Cash flow backing revenues curling higher as well, and an 11.7% forward earnings yield on offer at the 10x P/E.
- However, long-term earnings growth is flat, at 5% 3-year CAGR and ~1% forward bottom-line growth.
- Incremental reinvestments for growth (measured by CapEx, intangibles, goodwill, and cash acquisitions) are winding back each quarter, likely to continue going forward.
- On top of this, the profits generated from capital outlaid each period are tightening on a sequential basis.
- What this data tells us is that growth is not creating value for MD's shareholders.
It hasn't recycled capital well. This is because the return on investments the company has made haven't beaten the market's return, and have therefore destroyed value for shareholders. Hence, investors aren't going to reward a firm that isn't generating economic profits at rates below where they can get elsewhere. This would explain a lot in the repricing of is market cap over the last 12 months, as the market is typically a good judge of fair value.
Going forward, a 10x multiple derives $15.50 price target with my FY'23 EPS estimates of $1.55, which is negligible upside on the current market price at the time of writing. Even looking to FY'24, where I project EPS of $1.70, this prices $17. What's particularly disheartening is the outlook for MD in creating value ahead. It needs a large jump in investment and NOPAT growth to catch the market's attention again in my opinion. Otherwise, investors will just continue putting capital into companies that can compound their equity at above-market returns.
In that vein, noting the dwindling capital productivity, I believe there are more selective opportunities elsewhere.
Conclusion
Going forward, my estimates point to a $2Bn top-line in FY'23 and that would signify ~200bps of YoY growth. I'd look to $18mm in NOPAT on this and see earnings of $1.50–$1.60 which gets me to the 10x forward P/E the market has prescribed for MD at the moment. Whilst this is an attractive discount, I believe it is warranted. You're buying a growing top-line in MD, but not one that is creating value for shareholders in my opinion. It comes down to the way the firm recycles capital, where returns on incremental investments are sub-par, meaning investors can get better return on their investment elsewhere. Until the firm can begin to grow profits at rates above the market's return, investors won't be drawn to bidding MD higher in my opinion. In that vein, $15–$17 price range looks fair going forward, and this leave little to be desired at the time of writing. Net-net, reiterate hold.
For further details see:
Pediatrix: P&L Still Burdened From RCM Overhang, Reiterate Hold