COLD - Picking A Winner In Industrial REITs
2023-05-18 09:00:00 ET
Summary
- Demand for Industrial REIT space continues to substantially outpace supply, resulting in astonishing rental spreads averaging over 40%, while occupancy rates and same-store NOI have reached record highs.
- The five major industrial REITs raised full-year guidance this quarter, growing FFO much faster than the next closest major property sector.
- Industrial REITs are more "expensive" than the average REIT, and pay lower initial dividends, but grow their dividends much faster than average.
- This article examines 11 Industrial REITs, to single out the one company best poised to deliver outperformance over the next 2 to 5 years.
Demand for warehouse space continues to substantially outpace supply, resulting in astonishing leasing spreads averaging over 40%.
Hoya Capital Income Builder
Prologis Research projects that completions of 455 msf (million square feet) of industrial space in 2023 will handily outstrip absorptions of 275 msf, resulting in a clearing of some of the backlog that has built up since the pandemic.
Hoya Capital Income Builder
However, the pace of completions is tailing off rapidly. On the Q1 2023 earnings call , EastGroup Properties CEO Marshall Loeb made these observations:
What's promising is to see the decrease in industrial starts. To quantify, starts as measured by square footage, fell 25% from third to fourth quarter in 2022. Then comparing third quarter 2022 to first quarter 2023 starts dropped approximately 45%, and I suspect this quarter will be a further decline.
As a result, the projected industrial vacancy rate of 4.3% for 2023 is still markedly lower than any of the 15 years leading up to the pandemic. Meanwhile, the full-year vacancy rates for 2022 reached record lows, at 3.4%.
Hoya Capital Income Builder
Same-store NOI also reached a record high of 8.8% in 2022, easily outdistancing the REIT average of 6.5%.
Hoya Capital Income Builder
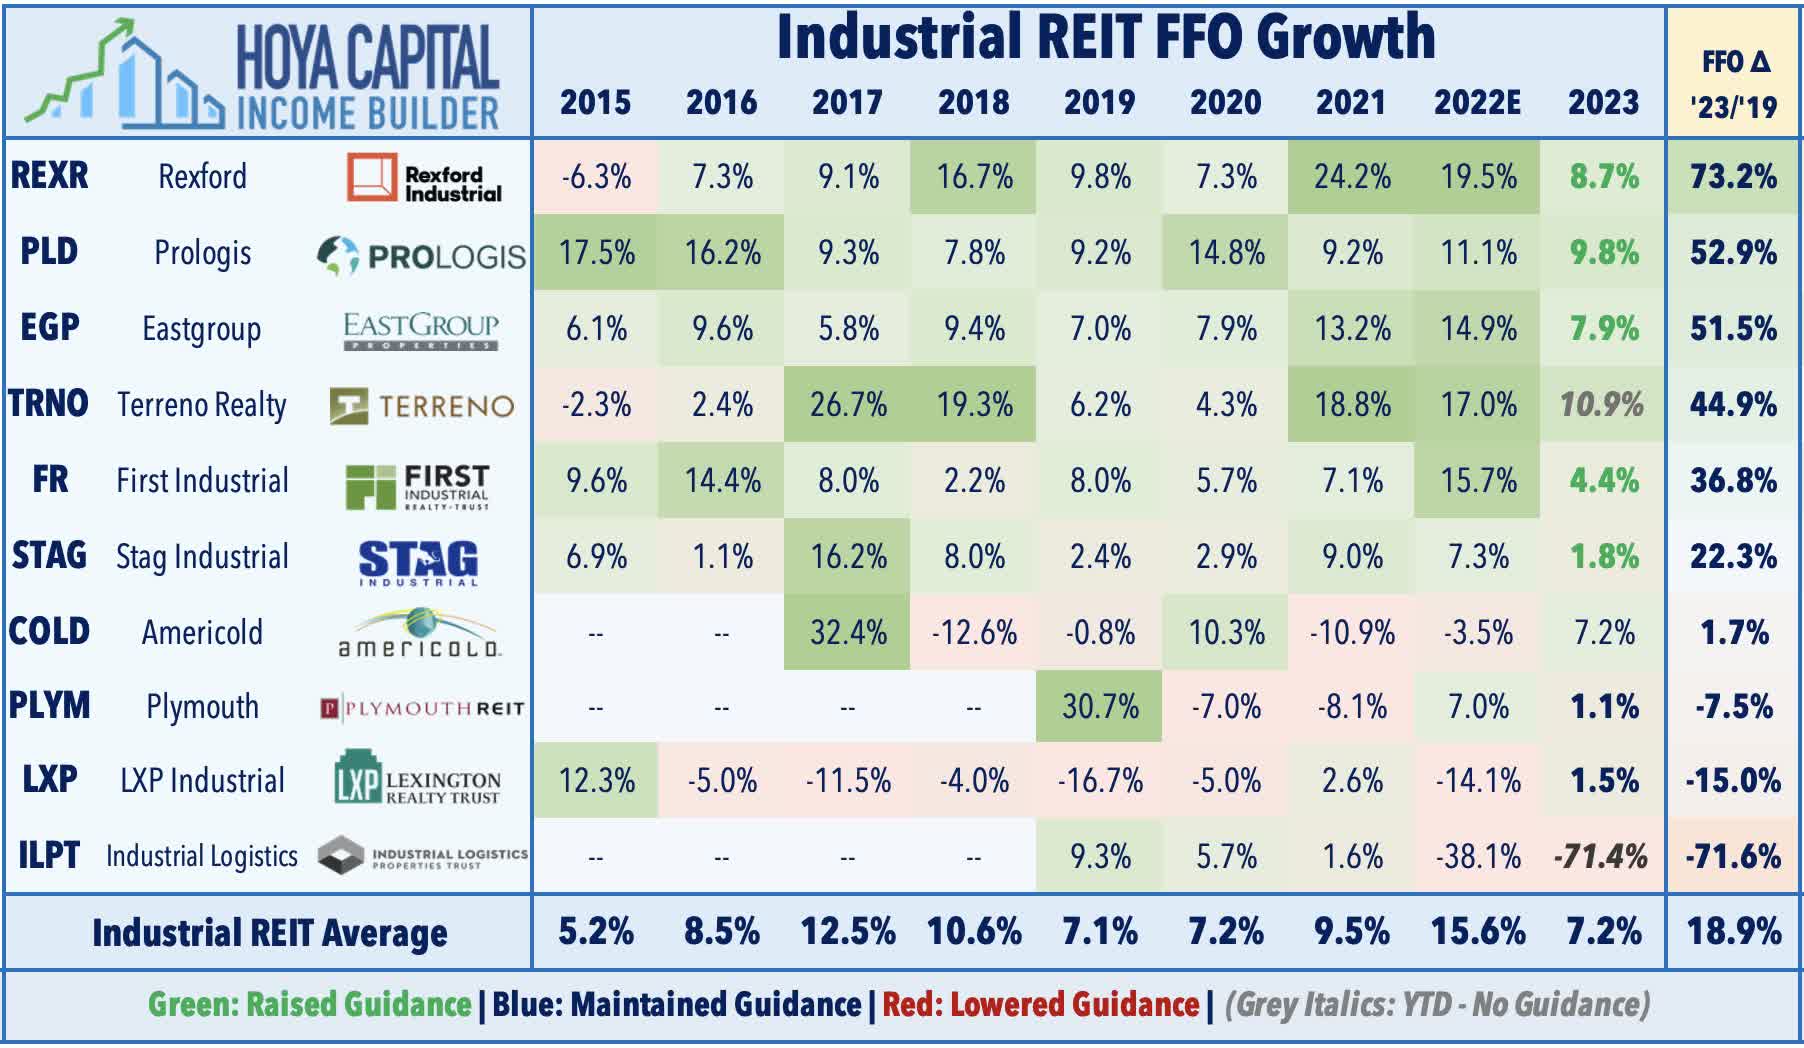
The five largest industrial REITs by market cap all raised full-year FFO guidance when reporting Q1 results, as Industrial REITs grew FFO much faster than the next closest major property sector. EastGroup Properties ( EGP ) raised FFO guidance by 200 bps (basis points), while First Industrial ( FR ) raised guidance by 175 bps , Rexford Industrial Realty ( REXR ) raised by 150 bps and Prologis ( PLD ), the 500-pound gorilla of this sector, raised by 30 points.
Industrial REITs are more "expensive" than the average REIT, as measured by Price/FFO multiple. Industrial also pay lower initial dividends, but grow their dividends much faster.
FFO multiples for various REIT sectors (Hoya Capital Income Builder)
As a result, within 7 years, Industrial REITs reach a higher yield on cost than the average REIT. A yield of 2.86% at purchase grows to 7.20% in that time frame, at an annual growth rate of 14.1%. From year 8 onward, Industrials leave the average REIT in the dust.
| Sector |
| 3-Yr FFO Growth |
| 5-Yr FFO Growth |
| Price/FFO 2023 |
| Yield |
| 3-Yr Div. Growth |
| Industrial REITs |
| 31% |
| 21% |
| (-3)% |
| 48% |
| 12% |
| 62% |
| (-30)% |
| 20.1% |
| VNQ |
| 9% |
| 5% |
| (-4)% |
| 29% |
| 12% |
| 41% |
| (-26)% |
| 9.4% |
Source: Hoya Capital Income Builder and TD Ameritrade
This article examines 11 Industrial REITs, to single out the one company best poised to deliver outperformance over the next 2 to 5 years.
What the numbers say
My FROG-hunting approach to REIT investing relies on just 7 numbers:
- Liquidity ratio (Assets/Liabilities)
- Growth in Funds From Operations (FFO)
- Growth in Total Cash From Operations (TCFO)
- Growth in Dividends
- Market Cap
- Growth in share price
- Volatility
Hey, what is a FROG anyway?
FROG stands for Fast Rate of Growth. FROG REITs are significant , because they usually outperform the market in total return (Gain + Yield). The criteria for identifying a FROG are as follows:
- Positive price gain over the past 3 years
- Liquidity Ratio >= 1.66 (preferably >=2.00)
- FFO and TCFO Growth rate >= 10% (preferably >=20%)
- Market cap of at least $1.4 billion.
- Modeled Return greater than the return posted by the Vanguard Real Estate ETF ( VNQ ) over the past 3 years.
Modeled Return is my own Rube Goldberg invention that combines price gain, dividend yield, dividend growth rate, and volatility to arrive at one number, for comparison to VNQ.
The opposite of a FROG is a COW (Cash Only Wanted), which is a company notable for its prodigious stream of cash dividends and plodding or mediocre revenue growth.
How do the candidates stack up?
There are 11 Industrial REITs I track. The candidates are as follows:
- Prologis ( PLD )
- Rexford Industrial Realty ( REXR )
- EastGroup Properties ( EGP )
- Americold Realty ( COLD )
- First Industrial Realty ( FR )
- STAG Industrial ( STAG )
- Terreno Realty ( TRNO )
- LXP Industrial ( LXP )
- Plymouth Industrial ( PLYM )
- Indus Realty ( INDT )
-
Industrial Logistics ( ILPT )
First we screen on Liquidity, FFO growth rate, TCFO growth rate, and Market Cap, using the criteria above.
| Ticker |
| Liquidity |
| FFO Growth % |
| TCFO Growth % |
| Market Cap |
| TRNO |
| 8.5 |
| 2.57 |
| 12.6 |
| 3.67 |
| 27.0 |
| 11.68 |
| EGP |
| 17.5 |
| 2.99 |
| 16.5 |
| 4.73 |
| 28.7 |
| 20.86 |
| FR |
| 16.3 |
| 2.40 |
| 8.6 |
| 3.07 |
| 25.6 |
| 18.85 |
| REXR |
| 12.6 |
| 2.74 |
| 20.9 |
| 4.84 |
| 30.4 |
| 16.24 |
| PLD |
| 14.2 |
| 2.78 |
| 14.5 |
| 4.17 |
| 32.7 |
| 16.62 |
| VNQ |
| 5.1 |
| 4.17 |
| 6.75 |
| 5.07 |
| 25.6 |
| 10.20 |
Source: Hoya Capital Income Builder, MarketWatch.com, and author calculations
Note: Modeled Return is not an attempt to predict total return for the coming year, but rather a measuring stick to identify companies that will outperform. The wider the margin by which a company's Modeled Return exceeds that of the VNQ, the better its chances of outperforming in the coming year.
We have a new front-runner. EGP has the highest Modeled Return, 200 bps ahead of FR, with PLD and REXR in a virtual dead heat for third place. TRNO drops to the bottom of the list (note that FR is by far the poorest dividend payer of our contenders, so is more a pure growth play than the others).
Still, it's an embarrassment of riches. All of these companies are bona fide FROGs, with Modeled Returns easily outdistancing the VNQ. I personally have shares in all these REITs except FR. All appear to be good investments.
So how do we choose between them?
On to the finals: Future Growth
So far, our growth metrics have been backward-looking. Now we sort our 5 candidates by projected FFO growth for 2023 and 2024. These analyst consensus figures (a.k.a. educated guesses) are based mostly on company guidance. Since next year's FFO is much easier to predict than two years down the road, I give double the weight to expected growth rate for 2023 versus the projected rate for 2024.
| Ticker |
| FFO '22 |
| FFO '23* |
| % incr |
| FFO '24* |
| % incr |
| Incr score |
| EGP |
| 4.73 |
| 70% |
| C+ |
| 22.4 |
| (- 1.6) |
| REXR |
| 4.84 |
| 80% |
| A- |
| 25.4 |
| (-11.8) |
| VNQ |
| 5.07 |
| 65% |
| C |
| 16.9 |
| (-18.0) |
Source: Author's calculations, Seeking Alpha Premium, and Hoya Capital Income Builder
From a value investor standpoint, it is a toss-up, since REXR's dividend score is higher and safer, and its discount to NAV is better, but EGP's payout ratio and price/FFO are lower, and EGP's dividend safety rating of C+ is in the ideal range, for a value investor. A C+ rating means the company is erring neither on the side of paying cash out to investors, nor on the side of retaining earnings for other purposes.
From a FROG hunter's standpoint, REXR's higher price/FFO actually doesn't bother me, particularly since the company is selling near the low end of its historical range over the past 5 years, and selling for a better discount to NAV than EGP. The Dividend Safety rating of A- means the company is erring on the side of retaining cash for further expansion.
When FROG hunting for total return, rather than milking COWs (Cash Only Wanted) for dividend cash flow, Price/FFO ratio doesn't work the way conventional wisdom says it does. Meaningful research by Hoya Capital has shown that:
splitting the REIT universe into thirds, our analysis indicates that the "cheapest" REITs, as measured by FFO per share multiples, have persistently underperformed while the more expensive third of REITs have delivered outperformance by roughly 2.8% per year over the past decade.
May I have the envelope, please?
It's a photo finish, but if I have to choose just one, the best REIT for increasing exposure to the Industrial sector, by a nose, is...
Rexford Industrial Realty
... with by far the best growth prospects over the next two years, the best track record for FFO and dividend growth, and the highest dividend score of the 5 contenders.
The runner-up is last year's winner...
EastGroup Properties
... which sits in the market cap sweet spot, with the highest Modeled Return and steady growth prospects over the next two years, high quality assets, and an excellent track record for dividend growth and balance.
As always, however, the opinion that matters most is yours.
For further details see:
Picking A Winner In Industrial REITs