VWO - PIE Vs. VWO: EM Momentum Approach Radically Changes The Allocations
2023-09-07 08:00:00 ET
Summary
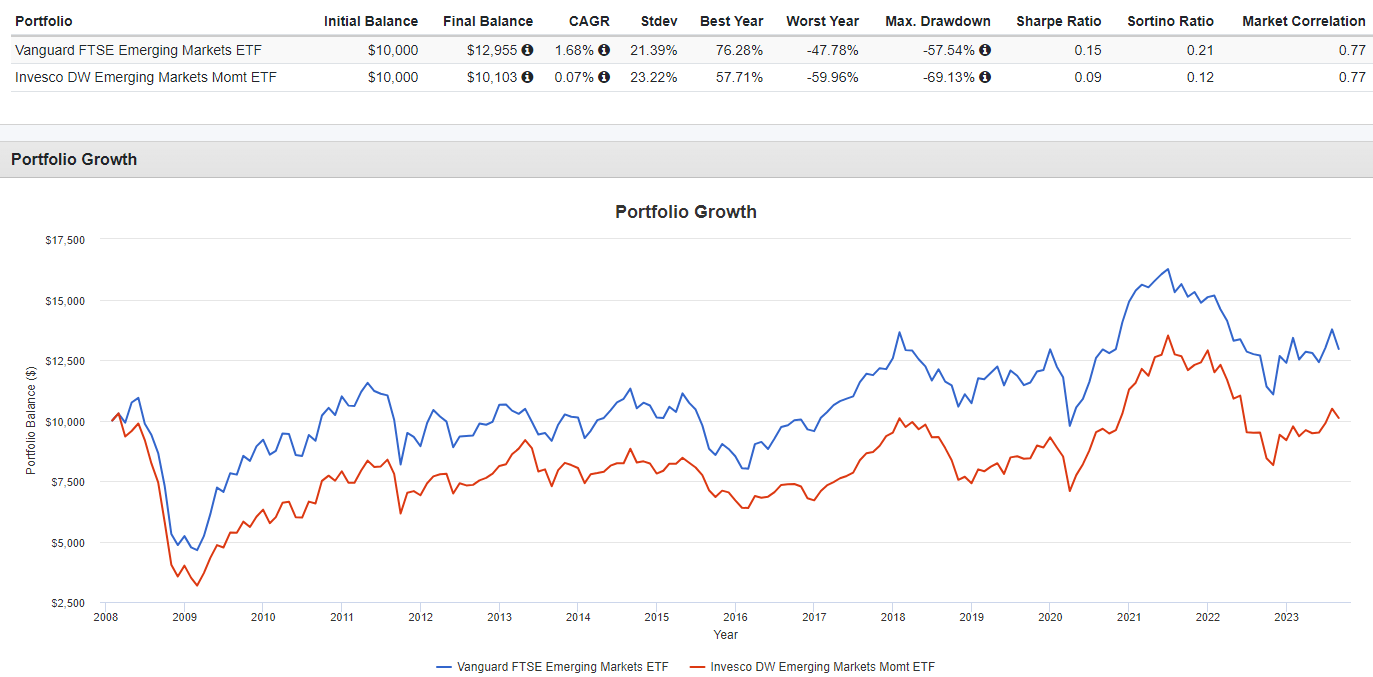
- Vanguard FTSE Emerging Markets ETF and Invesco DWA Emerging Markets Momentum ETF use different indices to invest in emerging market stocks.
- The choice of index affects country, market-cap, and sector allocations, but neither strategy has consistently outperformed.
- I rate the VWO ETF as a buy as a core EM ETF. I think there are better funds to actively invest in EM stocks than PIE offers; look elsewhere.
Introduction
These two Emerging Market ETFs are based on two indices that take different approaches into the universe of stocks that invest in. One, the well-known Vanguard FTSE Emerging Markets ETF ( VWO ) uses the popular FTSE Emerging Markets All Cap China A Inclusion Index. The second one reviewed, the Invesco DWA Emerging Markets Momentum ETF ( PIE ) barely makes a dent in the assets invested in this segment, invests based on the Dorsey Wright Emerging Markets Technical Leaders Index .
The choice of the index radically changes the country and market-cap allocations between the ETFs, but neither strategy has consistently proven superior. I give the VWO a Buy rating as a Core ETF, but would pass on the PIE ETF unless one has a good timing model to use with it.
Vanguard FTSE Emerging Markets ETF review
Seeking Alpha describes this ETF as:
The investment seeks to track the performance of a benchmark index that measures the investment return of stocks issued by companies located in emerging market countries. The fund employs an indexing investment approach designed to track the performance of the FTSE Emerging Markets All Cap China A Inclusion Index . It invests by sampling the index, meaning that it holds a broadly diversified collection of securities that, in the aggregate, approximates the index in terms of key characteristics. The ETF was formed on May 4, 1994.
Source: Seeking Alpha
VWO has $73.7b in AUM and comes with the usual low Vanguard fee: 8bps. The TTM yield is 3.46%.
Index review
FTSE Russell describe their index as:
The FTSE Emerging Markets All Cap China A Inclusion Index is a market-capitalisation weighted index representing the performance of large, mid and small cap stocks in Emerging markets. The index is part of the FTSE China A Inclusion Indexes which contain FTSE China A All Cap Index securities adjusted for the aggregate approved QFII and RQFII quotas available to international investors. The Index covers 24 countries, with China being the largest component at 33%.
Source: research.ftserussell.com Index
VWO holdings review
Vanguard also provided how the ETF sector allocations compare to the benchmark.
advisors.vanguard.com VWO sectors
Considering Taiwan is included in the country list, shown next, and that banks are large in many EM countries, no surprise that Technology and Financial stocks comprise 43% of the total portfolio. Here we see that Asia dominates this allocation at over 75%.
advisors.vanguard.com VWO countries
Top holdings
advisors.vanguard.com VWO holdings
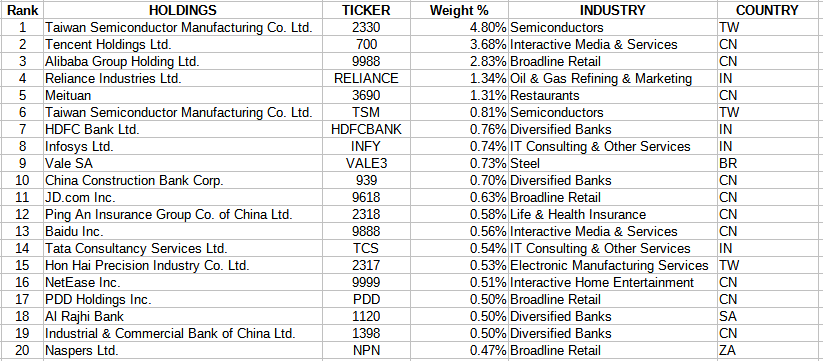
Even with over 5700 stocks, the Top 20 still account for 23% of the portfolio weight. It takes the smallest 4900 holdings to match that allocation total!
VWO distributions review
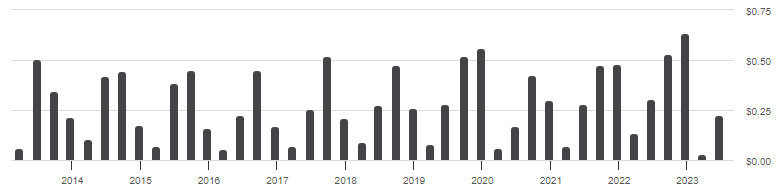
As is typical with International ETFs, payouts vary greatly by quarter, as many non-US stocks pay on different semi-annual calendars. While dividends have grown over 5% since 2018, they are down since 2013. Seeking Alpha gives VWO a "B+" grade for this factor.
Invesco DWA Emerging Markets Momentum ETF review
Seeking Alpha describes this ETF as:
The investment seeks to track the investment results (before fees and expenses) of the Dorsey Wright® Emerging Markets Technical Leaders Index (the "underlying index"). The fund will invest at least 90% of its total assets in the securities that comprise the underlying index. The underlying index is comprised of equity securities of large capitalization companies based in countries classified as emerging markets. The ETF was formed on December 27, 2007.
Source: Seeking Alpha
PIE is very small compared to the VWO ET at only $137m in AUM. At 90bps, the fee difference puts this ETF at a large performance disadvantage to VWO too. Investors also are getting a smaller yield: 2.83%.
Prior to 8/25/2023, the Fund's name was Invesco DWA Emerging Markets Momentum ETF. I would describe the PIE ETF not as an actively managed ETF, but a factor managed one since it invests based on an index that takes momentum and other factors into consideration in picking and weighting the index used by PIE.
Index review
Based on my last statement, understanding the index is paramount to understanding the PIE ETF. The index used by PIE comes with this description:
The Dorsey Wright® Emerging Markets Technical Leaders Index selects 100 securities with powerful relative strength characteristics from a universe of large cap securities in countries classified as Emerging Markets. The Indexes employ a modified market capitalization weighted methodology. At each quarter, the Indexes are rebalanced by weighting each Index Security by their proprietary relative strength score. A final check is run to ensure that all securities with Index weights greater than 5% do not, in aggregate, exceed 25%. If this occurs, a redistribution of weight from these issuers' issues will take place until the rule is met. The process is repeated, if necessary, to derive the final weights. The weights of the Index Securities are determined on the third Friday of March, June, September and December. The Index began on September 28, 2007 at a base value of 100.00.
Source: indexes.nasdaq.com/Index/Overview/DWAEM
PIE holdings review
As with VWO, Technology and Financials are the top sectors, with Industrials moving up one place here. More comparisons on sectors will be shown later.
invesco.com; compiled by Author
The country allocations differ greatly too, with China only a minor allocation in PIE. More on this later too.
invesco.com PIE countries
Top holdings
With only 100 holdings, not counting currency positions, another major difference compared to VWO is the concentration risk that presents. Here, the Top 20 positions equate to 43% of the total weight.
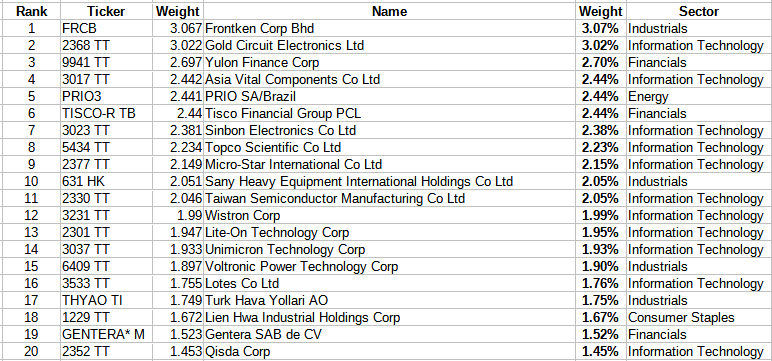
One benefit of the concentration is the bottom part of the portfolio still provides 29% of the weight, meaning they still impact the results.
PIE distributions review
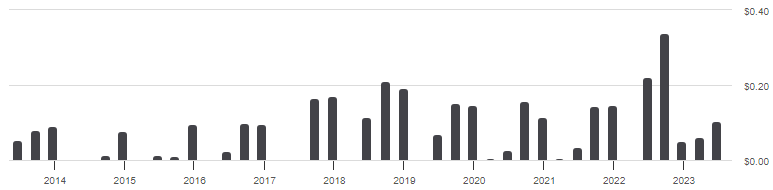
This ETF has a very erratic payout history, including skipping some quarters. Seeking Alpha also gave this ETF a "B+" rating for this factor.
Comparing ETFs
I like to start my ETFs comparisons using Vanguard's style boxes.
advisors.vanguard.com compare
I see two influences that PIE's momentum strategy caused. The most notable is a much larger concentration in mid-Cap stocks where almost half of PIE's allocation is, compared to just 17% for VWO. The small, subtle one is PIE's move into both Pure Value stocks (31% vs. 27%) and Pure Growth stocks (24% vs. 22%). Investors wanting mostly Large-Cap exposure to EM stocks would need to pick VWO over PIE.
I picked Morningstar for these comparisons so the data is from a common source. Where the two ETFs differ the most is in their country allocation.
morningstar.com; compiled by Author
Don't want China much exposure, PIE fits that bill, but you better like Taiwan then. Mexico is favored by a factor of 5X in PIE versus VWO, the other big country difference. PIE's strategy also effected several sector allocations by large amounts.
morningstar.com; compiled by Author
The widest spread is PIE's Technology allocation, which is more than twice that of VWO's. A second Sensitive sector, Industrials, is also almost doubled in PIE. Offsetting those are VWO's higher weights to Consumer Cyclicals and Communication Services. Overall, VWO is more exposed to the Cyclical sectors; PIE to the Sensitive sectors, with Defensive exposure being close.
Factor data seems to indicate VWO has a Value slant; PIE a Growth one, as better values are shaded in green. That said, many of the differences are minor, as indicated in the Style boxes above.
morningstar.com; compiled by Author
The results
While total history clearly favors VWO over PIE, momentum strategies are better held over shorter periods. This is reflected in the fact the PIE ETF has better results at the 1,3, and 5-year intervals. I suspect one could develop a model to help capture the better periods and avoid the downtimes.
Portfolio strategy
There are two parts of the equity market where I believe active managers stand a chance of beating index-based ETFs. One is Emerging Markets, the other is Small-Cap stocks. EM for the fact that not only do you have to decide on sectors and stocks, but the country comes into play, which means multiple currency exposure worries are there too. As with non Large-Cap US stocks, the smaller ones PIE focuses on should outperform if the Efficient Market Hypothesis is worth its salt. Its premise is the market is based on all known information. Since smaller stocks have fewer analysts coverage, thus the greater chance (both positive and negative) of new information coming out that drives the stock's price. That would be even more so with Emerging Market stocks, except for the large ones that dominate indices like that used by the VWO ETF.
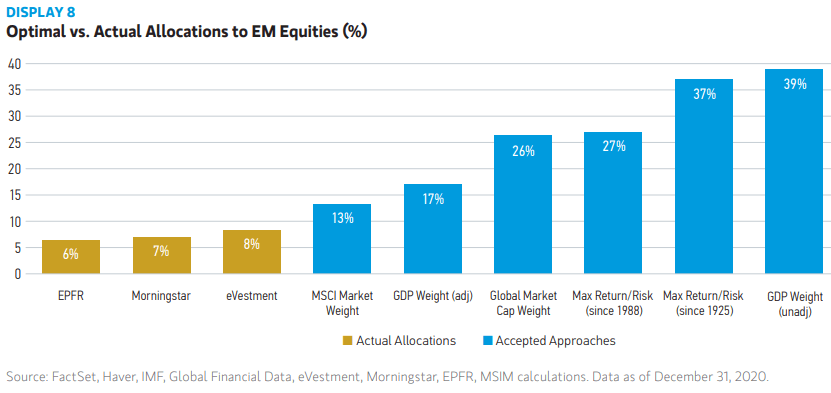
Most investors are underweight when it comes to Emerging Market stocks. What that weight should be varies based on different measures, according to a Morgan Stanley report.
Even using the first blue bar, MSCI market weight, global investors could be up to 50% underweight EM stocks. Two charts were presented showing the optimal allocations to be between 27-37% using the Information ratio between EM and DM markets and altering the time period studied. It appears investors are being rational, though, as US stocks have outpaced both international DM and EM stocks over most extended time periods.
That said, there are supporters for EM stocks. Lazard Asset Management listed five reasons to own EM stocks in a recent article.
1. Composition: Emerging markets are much less dependent on energy and materials than they once were, while entrepreneurial information technology and internet-related businesses are ascendant.
2. Innovation: Emerging markets have leapfrogged the developed world in several key technologies, while spending on research and development in China, in particular, rivals that of the US.
3. Driving Force of Global Growth: Emerging markets account for almost 60% of global growth, a proportion due to rise given their relatively young populations and ongoing urbanization.
4. Recovery Potential: History suggests the current rebound has more room to run.
5. Underestimated Value: Emerging markets equities are trading near historical discounts, and we believe the data suggest that investors are under-allocated to the asset class.
Source: lazardassetmanagement.com EM stocks
Final thoughts
The VWO ETF makes for an excellent Core holding for Emerging Market exposure. For that, it gets a Buy rating. As for the PIE ETF, while factor based, it is still dependent on an index, not my preference for EM stocks thus I use two Wasatch MFs:
I have two articles comparing WAINX to EM index ETFs.
For further details see:
PIE Vs. VWO: EM Momentum Approach Radically Changes The Allocations