PYN - PIMCO California Muni CEFs Teach A Lesson On Valuation
Summary
- PIMCO California muni funds teach a lesson on CEF valuation.
- The most expensive fund declined by the most after the cut.
- Remember CEF investors, don't just look at the yield!
Author's note: This article was released to CEF/ETF Income Laboratory members as part of our CEF Weekly Roundup on January 10, 2022. Please check latest data before investing.
In last week's Weekly CEF Roundup ( public link ) we reported on broad distribution cuts from PIMCO's suite of municipal bond CEFs. These cuts ranged from -20% to PNF to -45% to PCQ.
I decided to do an updated analysis of the price action after the cuts for these set of funds. The 5-day price changes for the three national muni funds, PMF, PML, and PMX, ranged from -1.93% to -7.05%.
YCharts
The 5-day price changes for the three California muni funds, PCQ, PCK, and PZC, ranged from -7.26% to -10.25%.
YCharts
The 5-day price changes for the three New York muni funds, PNF, PNI, and PYN, ranged from +4.71%% to -6.05%.
YCharts
The following table includes the size of the distribution cut (absolute and percentage), the premium before the cut, the current premium, the yield before the cut ,the current yield, and the 5-day price change after the cut.
| Fund |
| Ticker |
| % Cut |
| NAV Yield Before Cut |
| Market Yield Before Cut |
| Current Market Yield |
| Premium Before Cut |
| Current Premium |
| 5-Day Price Change |
| National |
| PIMCO Municipal Income Fund |
| ( PMF ) |
| -22% |
| 6.76% |
| 5.97% |
| 4.91% |
| 13.26% |
| 3.74% |
| -5.44% |
| PIMCO Municipal Income Fund II |
| ( PML ) |
| -33% |
| 8.02% |
| 7.60% |
| 5.19% |
| 5.56% |
| 0.44% |
| -1.93% |
| PIMCO Municipal Income Fund III |
| ( PMX ) |
| -28% |
| 6.83% |
| 6.22% |
| 4.81% |
| 9.78% |
| -1.44% |
| -7.05% |
| California |
| PIMCO California Municipal Income Fund |
| ( PCQ ) |
| -45% |
| 7.52% |
| 5.09% |
| 3.89% |
| 47.73% |
| 3.57% |
| -27.35% |
| PIMCO California Municipal Income Fund II |
| ( PCK ) |
| -33% |
| 5.83% |
| 5.54% |
| 4.15% |
| 5.16% |
| -8.53% |
| -10.25% |
| PIMCO California Municipal Income Fund III |
| ( PZC ) |
| -22% |
| 5.89% |
| 5.43% |
| 4.53% |
| 8.39% |
| -1.88% |
| -7.26% |
| New York |
| PIMCO New York Municipal Income Fund |
| ( PNF ) |
| -20% |
| 5.75% |
| 5.52% |
| 4.18% |
| 6.54% |
| 6.31% |
| +4.71% |
| PIMCO New York Municipal Income Fund II |
| ( PNI ) |
| -26% |
| 5.75% |
| 6.02% |
| 4.46% |
| -8.11% |
| -5.54% |
| -1.00% |
| PIMCO New York Municipal Income Fund III |
| ( PYN ) |
| -30% |
| 6.35% |
| 6.14% |
| 4.55% |
| -5.35% |
| -1.18% |
| -6.05% |
What is interesting is the wide dispersion of 5-day returns. The New York muni fund PNF actually rose by +4.71% after its -20% cut, whilst the California muni fund PCQ crashed and burned by -27.35% after its -45% cut.
As we alluded to last week, one reason for PCQ's biggest drawdown was the fact that its premium was the highest before the cut, standing at +47.73% which was head-and-shoulders after the rest of the suite.
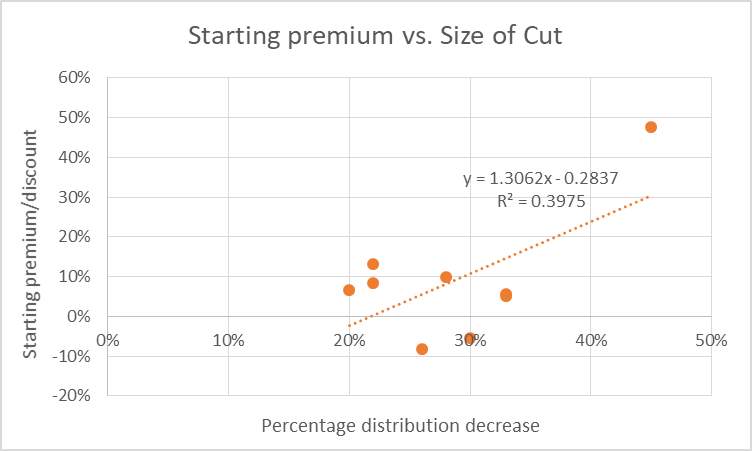
Not surprisingly, there was a negative correlation between the starting premium/discount of the CEF and the 5-day price change in response to the cut. As we have written about many times, a high CEF valuation reduces the margin of safety because there is more room to fall upon of a negative catalyst, such a distribution cut.
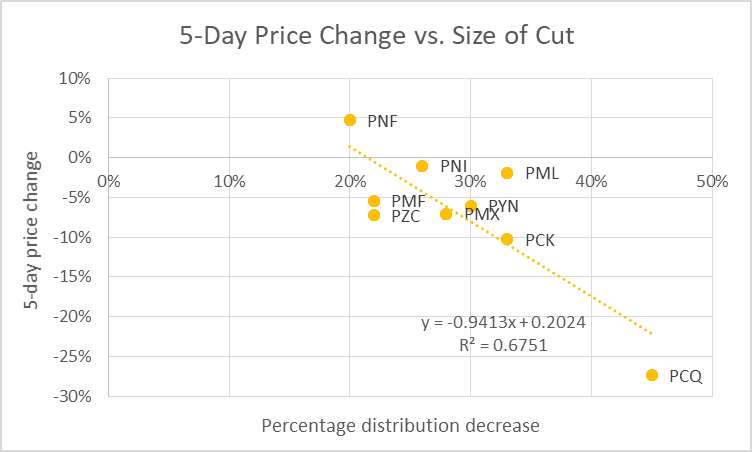
There was also a negative correlation between the 5-day price change and the size of the cut. Funds that cut deeper, saw greater decreases in price due to a more rapidly deflating premium.
The more astute among you may already have managed to put two-and-two together. The fact that both of the above charts (price change vs. starting premium and price change vs. size of cut) show a negative correlation suggests that the starting premium is also positively correlated with the size of the cut.
Why might that be? What does the premium/discount of the fund have to do with the size of the distribution cut?
There's no direct effect between the two, but there is an indirect one. Many CEF investors (few at the Income Lab , hopefully!) make the mistake of only focusing on the yield of the fund.
When a group of funds are investing in the same sector, we'd expect them to all "earn" (whether from dividends, income, or capital appreciation) a similar rate of return from their assets. However, because CEFs often pay out return-of-capital ("ROC") distributions as part of their managed distribution programs, the actual yields exhibited by funds from the same sector can vary. The simple truth is that a fund manager can basically choose to pay out as much yield as they want without restriction. What this means is that, when we're looking at funds from the same sector, what one fund lacks in the yield department is made up for by better capital stability and returns. Conversely, a higher-yielding fund would be expected to show weaker capital sustainability.
We can see this in action for the PIMCO CA muni CEFs. While the three funds have had very similar total return NAV return profiles over the last 5 years (with PCQ being the best at +4.37%), there is a greater divergence in the raw NAV change values (with PCQ being the worst at -23.95%) due to PCQ paying the highest distribution yield out of the three funds.
YCharts
Perhaps investors didn't notice this, or perhaps they didn't care. Despite the three portfolios earning about at about the same rate at the portfolio NAV level, the higher NAV yield of PCQ lured in buyers who pushed up the premium of PCQ until its market yield became even lower than its sister funds, PCK and PZC.
Hence, this is why PCQ, the fund that cut by the most, was also trading at the most expensive premium. Unwary investors were bidding up funds with the highest NAV yields until their market yields became equalized with their peers. However, PIMCO managers realized that the high NAV yield of PCQ was unsustainable, and thus brought it back down in line with its peers via a -45% distribution cut. It's not like investors weren't warned either. As PIMCO's latest UNII report shows, PCQ had the most negative UNII and the worst coverage numbers out of the three CA muni CEFs.
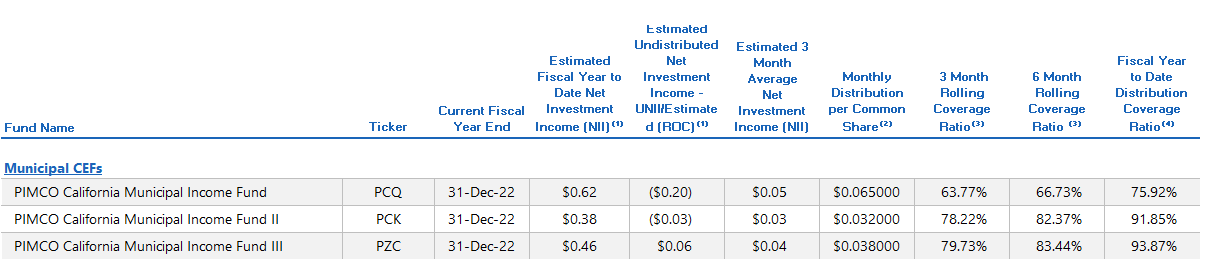
This is yet again another lesson on why premium/discount valuation matters! When CEFs are at a large premium, they have much greater room to fall should sentiment sour for any reason. PCQ's premium decreased from 47.73% to 3.74% in only 5 days, one of the quickest deflation of premium/discount valuation that we've witnessed over the past several years.
YCharts
Remember CEF investors, don't just look at the yield!
It is also worth noting the great call by Dividend Seeker, a member of the CEF/ETF Income Laboratory team, last month: PCQ: It Looks Like A Sell To Me
For CA muni investors, PCQ (+3.97% premium, 3.84% yield) still remains the most expensive after the cut. I would be favoring PCK (-8.87% discount, 4.11%) or PZC (-2.73%, 4.52% yield) instead.
For further details see:
PIMCO California Muni CEFs Teach A Lesson On Valuation