PAXS - PIMCO CEF Update: Bad But Not As Bad As It Looks
2023-04-04 12:41:57 ET
Summary
- We provide a February update for the PIMCO CEF taxable suite.
- Taxable CEFs continued to deleverage despite NAVs largely holding steady through February, possibly as a result of a low level of net income generated by leveraged assets.
- Six-month rolling coverage continued to fall. Steadily falling coverage overstates the extent of net income damage.
- We discuss the misleadingly "cheap" PAXS in relation to PDO.
- And highlight a couple of risks on the radar.
This article was first released to Systematic Income subscribers and free trials on Mar. 27.
In this article, we provide an update on the PIMCO CEF suite. Specifically, we discuss the changes in leverage and distribution coverage for the month of February. We also touch on some of the misleading optics surrounding fund fees on the PIMCO website. Finally, we highlight a couple of risks on the radar.
Leverage Update
PIMCO taxable borrowings continued to fall, reaching a new low over the past year and likely a multi-year low.
Systematic Income
The funds deleveraged for the sixth month in a row and for 11 out of the last 12 months.
Systematic Income
In percentage terms, PHK, PFL and PGP deleveraged the most while PCM and PTY actually added borrowings.
Systematic Income
The continued deleveraging over the first two months of the year stands in contrast to the fact that the average PIMCO taxable CEF NAV was actually up through February. In other words, PIMCO continued to deleverage as a conscious choice rather than something that was forced by the market. This could be due to concerns over market weakness (fairly prescient if that was the case given the banking difficulties over March) or a low level of net income generated by leveraged assets.
Systematic Income
About half of the taxable funds have deleveraged by at least 50% over the past year.
Systematic Income
The average fund leverage in the taxable suite is at the lowest level in over a year.
Systematic Income
PCM has moved into the lead as the highest leveraged fund in the taxable suite.
Systematic Income
Checking in on the latest ARPS rates, we continue to see a steady increase in interest rates for a fund like PTY which is paying north of 9% on its ARPS. In other words, assets that are leveraged via ARPS start close to 10% in the hole (given the additional management fee that is applied to leveraged assets). In other words, these assets need to have yields around 10% to generate any net income. This is about 1% above the yield on the high yield corporate bond market and corresponds to corporate bonds rated around B-.
Systematic Income
PTY, PFL and PFN have the highest ARPS interest rates in the suite.
Systematic Income
Coverage Update
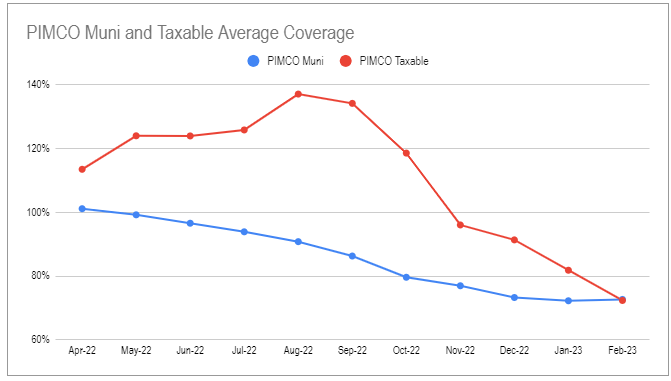
Six-month rolling Municipal CEF coverage stabilized this month while taxable CEF coverage continued to move lower.
Only PGP saw an increase in its (very volatile) six-month rolling coverage figure. PAXS remains the fund with the highest coverage.
Systematic Income CEF Tool
Although coverage numbers remain grim, they overstate the net income problems for the suite. What’s happened is that net income in the suite reset to a lower level about six months ago however because higher net income months continue to fall out of the 6-month window and are replaced with lower numbers it looks like the situation continues to get worse for the sector which isn’t actually the case.
Systematic Income CEF Tool
The sum of monthly net income numbers was actually the second highest in the last five months. We expect another drop in the six-month rolling coverage next month until coverage stabilizes somewhat. At that point we will have 4-5 CEFs with coverage of 50-60% which will be, obviously, quite uncomfortable for many investors.
Market Themes
PIMCO generally does a decent job of providing useful metrics about its funds. However, this disclosure can also give investors the wrong impression if it's not used in the right context.
For example, investors who glance at the total expense profile of two funds PAXS and PDO will view PAXS as a "cheaper" fund given its significantly lower total expense ratio which is 1% below that of PDO. In our view this is not actually the case.
PIMCO
The clue is provided in the first two lines in the table above - the management fee and the total expense ratio excluding interest expense. The difference between those two lines is the effect of leverage and expenses other than management fees. We can disregard this second item as these additional expenses are pro-rated across the entire suite in relation to fund assets and don't drive the overall difference in overall expenses ratios. And because the two funds have nearly identical leverage ratios of about 45%, there is a clear question as to why PAXS ends up with a lower total expense ratio of 1.51% despite having a higher management fee and a similar level of leverage.
Another clue is provided by the definition of these figures as being estimates over the current fiscal year. Investors who have paid attention to these funds know that PAXS is the more recently launched fund and that it was levering up over the first half year of its life or so. We can see this in the following chart.
Systematic Income
This subdued level of leverage generated a lower level of interest expense and a lower level of management fees on net assets. However, now that the fund is fully leveraged up, its overall fees will now exceed those of PDO.
We should expect this to be reflected in the next update of the fee figures on the website. It also means that PAXS should trade at a wider discount than PDO which has indeed mostly been the case.
Stance And Takeaways
In early December we downsized our exposure to PIMCO taxable CEFs in favor of, in our view, more resilient income securities. Our allocation within the suite was in PAXS and, so far, this switch has worked out well. As a sidenote, other PIMCO taxable funds have also underperformed our rotation choices.
Systematic Income
We still carry a minimum allocation to PAXS as a decent modest duration / multi-sector option. There are two key risks we are watching. First is the development in the CMBS space (which PAXS is overweight) where delinquencies have ticked up, particularly in the Office collateral space. The pullback in regional bank lending could hit commercial real estate fairly hard given regional banks do most of the lending in that sector.
TCW
We are also mindful that the suite is vulnerable to distribution cuts given poor coverage metrics. The suite tends to make cuts every 1-2 years or so and we are around that time since the last cut. PAXS is less vulnerable to cuts given its high leverage, low NAV distribution yield and widest discount so it should outperform in case of a cut by other PIMCO funds.
For further details see:
PIMCO CEF Update: Bad But Not As Bad As It Looks