PTY - PIMCO CEF Update: Deleveraging And Swaps Take A Toll On Income
Summary
- We provide a December update for the PIMCO CEF taxable suite.
- Most funds deleveraged further while PDO added borrowings.
- Coverage continued to drop across all funds except PGP with only two funds now having coverage over 100%.
- We discuss the recent shift in the swaps portfolio of PDI and what it means for the fund's income-generating capacity.
- PIMCO CEFs have traded up strongly with the average premium rising to 10%, offering less value at current levels.
This article was first released to Systematic Income subscribers and free trials on Jan. 27 .
In this article, we provide an update on the PIMCO CEF suite. Specifically, we discuss the changes in leverage and distribution coverage for the month of December. We also highlight the significant changes in the interest rate swap portfolios of the funds. Although this may seem like an esoteric topic, changes in the swaps portfolio have a significant knock-on impact on the funds' income profile. The taxable suite has traded up strongly this year, with most of the rally due to a rise in valuations. We expect better entry levels for new capital over the coming year.
Leverage Update
What was interesting in December is that while most taxable CEFs actually continued to deleverage apace, the net number was small due to a large increase in borrowings of [[PDO]] as the chart below shows which hiked borrowings by nearly 10%. Since March of last year when total taxable fund borrowings peaked, total borrowings are down by 26% across the entire suite - by a total of nearly $2.5bn.
Systematic Income
The 12-month change in borrowings looks like the following. What's interesting here is that apart from the biggest losers of 2022 - [[RCS]] and [[PGP]] (a greater loss typically necessitates a greater deleveraging), the funds that deleveraged the most were largely the funds that rely in part on ARPS to source leverage which is significantly more expensive than repo.
Systematic Income
PDO, [[PCM]] and [[PAXS]] remain the highest-leveraged funds. Interestingly, [[PTY]] leverage has moved to a more modest profile (that is, by PIMCO standards) of being in the high 30s from being as high as slightly above 50% last March.
Systematic Income
Coverage Update
December was another month of falling coverage levels across both the taxable and tax-exempt suites. Only one taxable fund managed an increase in 6-month coverage - PGP. All but two funds now have sub-100% levels of coverage (PDO and PAXS are still above 100%).
Systematic Income CEF Tool
The last three months have seen a significant drop-off in monthly net income levels for the funds as the table from our CEF Tool shows.
Systematic Income CEF Tool
In the taxable suite the lowest coverage fund is PTY with 58%. The fund's 6-month rolling coverage level has fallen sharply off its 139% peak last year.
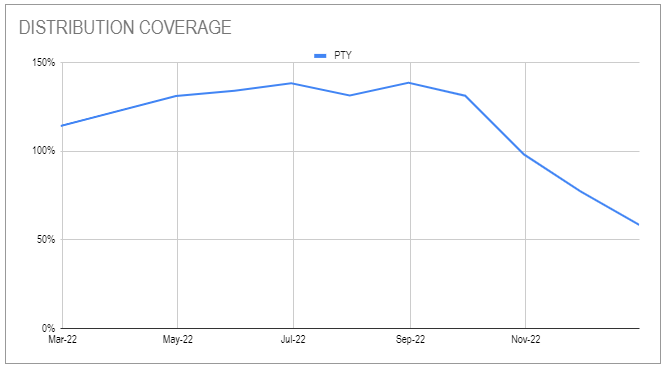
What could be driving such a big drop in net income for PTY?
One factor is deleveraging - as the following chart shows PTY shares the largest deleveraging with RCS from March of last year.
Systematic Income
The second factor in the coverage drop is the fund's ARPS. The dividend rate on the fund's ARPS have grown very quickly and now stand above that of high-yield corporate bonds, making it difficult for the fund to generate much net income using assets funded with ARPS.
Systematic Income
PTY ARPS are particularly expensive, having the highest dividend rate in the taxable suite.
Systematic Income
Another possible reason, as we discuss below for [[PDI]], are the changes in the funds' swap portfolios which have reduced the amount of cash the funds are receiving.
Finally, PTY has the highest NAV distribution rate among funds with ARPS which means that, all else equal, its coverage will tend to be lower.
Swap Portfolio Changes
In this update we focus on the changes in the swap portfolio of PDI. This is because PDI is the largest and best-known of PIMCO CEFs. It is also because the entire taxable suite is broadly managed with the same strategy so changes in the swaps population of one fund are typically replicated across the rest of the suite as well.
The key information is below. The first table shows swaps that were dropped and the second table shows swaps that were added. 6 new swaps to replace 5 old swaps doesn't seem like a big deal, however, the economics of this switch are significant.
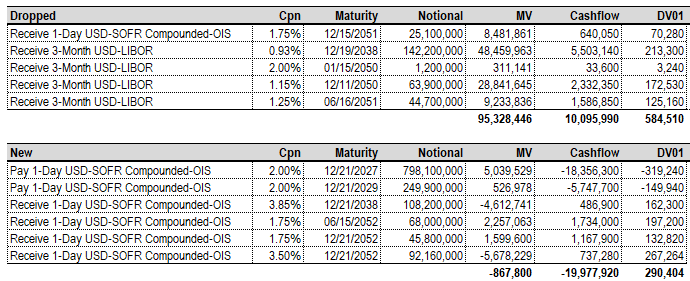
One key economic change of the switch is the change in market value (MV column). The market value of the dropped swaps was +$95m in favor of PIMCO while the new swaps were $-1m against PDI. Net net the switch released $94m as cash to PDI. It's important to keep in mind that this did not change the fund's total assets, it's only that the value locked up in these 5 swaps was released as cash.
Now let's look at the cashflow profile of the switch. The old swaps generated about $10m in cash for PIMCO annually based on current Libor while the new swaps would generate about $-20m as an annual outflow based on today's Libor. Net net the switch has created a drag of about -$30m against PDI annually.
These two figures (+$94m mark-to-market / cash release and -$30m annual cash drag) are related. The mark-to-market of a swap is simply the discounted value of its future cashflows. In other words, the $94m mark-to-market is simply several years' worth of the cashflows derived from the swaps. This dynamic also highlights that swaps are an efficient way to generate income. For example, a 5-year swap with a mark-to-market of $100m is expected to generate $20m a year or a "yield" of 20%. The reason the yield is in quotes is because this strategy is a kind of return-of-capital rather than an actual organic yield-generation strategy. This drop in cashflows is equivalent to a yield of 0.7% on net assets which is not massive but certainly noticeable.
Finally, we can look at the DV01 (i.e. dollar-value of 1 basis point) figures. DV01 is a measure of interest rate sensitivity. What we see is that the interest rate sensitivity of the portfolio to rising rates fell by about $300k for each 0.01%. Or in other words, the duration of the fund increased, all else equal. The contribution from the swaps caused the duration of the fund to increase by a significant 0.7 or around 20%. This makes sense in the context of higher interest rates and is echoed by the increase in the fund's duration as shown on its website.
This shift in the fund's swaps portfolio gives rise to two questions. First, what is PDI going to do with the $94m in cash it unlocked from the swaps?
The answer to the first question is that the fund likely used the cash when it cut its borrowings. The fund has reduced its borrowings by around $1bn over the past year so the $94m amount would have been part of this process.
Systematic Income
The second question is - is the drop in the swap-based income what's behind the recent drop in coverage? The answer to the second question is yes but that's not the whole story. In other words, a drop in income from the swap portfolio of around 0.8% is too small by itself to explain the larger drop in the fund's income profile. However, it is likely a contributing driver to the fund's drop in coverage since the end of Q3.
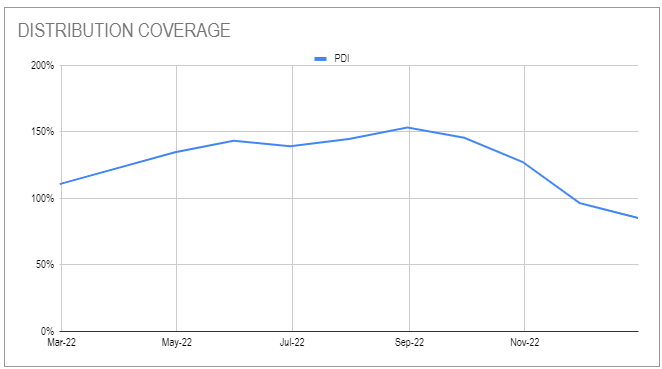
We can't know exactly what PDI was trying to achieve with the change in the swaps portfolio however the move certainly makes sense. There was a lot of cash locked in the swaps portfolio so using some of this capital to deleverage is arguably better than having to sell assets that generate real income. It also made sense to increase the fund's duration profile given the rise in yields and achieving this via the swap portfolio could be done more easily than by shifting the securities portfolio. Finally, with coverage of 150% as of Q3, PDI was generating enough organic income to not really need the additional income from the swaps. So sacrificing the swaps-based income to facilitate the deleveraging and the increase in duration made sense. Perhaps this was actually the fund's strategy - to lock away capital in the swaps portfolio during "good" times and use it up when necessary.
Stance And Takeaways
PIMCO CEFs have traded up nicely at the start of the year with total returns of 7-13%. The bulk of that return has been due to the rise in valuation. At the moment, the valuation in the taxable suite is no longer as attractive in aggregate as it was for most of last year.
Systematic Income
Furthermore, with a drop in corporate bond yields as well as continued deleveraging across most of the taxable space, the funds are generating less yield today than they were for most of 2022. If the current rally continues and valuations continue to richen it can make sense to lighten up on PIMCO CEFs in expectation of further air pockets over the coming year.
For further details see:
PIMCO CEF Update: Deleveraging And Swaps Take A Toll On Income