PAXS - PIMCO CEF Update: Gauging The Impact Of Rising Short-Term Rates On Income
- We provide another update on the PIMCO tax-exempt and taxable suites of CEFs.
- Most taxable funds continued to deleverage in June, bringing total deleveraging for some funds to around 20-25% over the last 3 months.
- Muni coverage has continued to move lower on the back of rising leverage costs while taxable leverage has been more resilient.
- We take a look at the likely impact of the recent rise in short-term rates on taxable fund income levels.
- We continue to favor PDO but would consider rotating to PAXS if the fund cheapens further relative to PDO.
This article was first released to Systematic Income subscribers and free trials on July 21.
In this article, we provide an update on the PIMCO CEF suite. Specifically, we discuss the changes in leverage and coverage for the month of June. We also take a look at whether the rise in short-term rates this year should boost or detract from taxable fund income levels.
Leverage Update
As we touched on in our last PIMCO update, the continued sell off in credit in June has pushed the taxable suite of funds to deleverage further.
Systematic Income
The Access Income Fund ( PAXS ) is an exception because, as a recently-launched fund, its leverage was still at low levels so it has had room to catch up. The fund has continued to add borrowings as shown in the chart below with a total of nearly $500m in mostly repo.
PCM and PDI have now moved out to be leverage toppers with a level of near 50%.
Systematic Income
The taxable suite has been deleveraging each of the last 3 months. The chart below shows the total amount of deleveraging (i.e. decrease in total borrowings) over that period. The bounce in credit performance in July will likely put, at least a temporary, end to this and may even allow room for PIMCO to add to assets that were shed over the last few months.
Systematic Income
As a back-of-the-envelope, a drop in borrowings of 20% for a 50% leveraged fund will cause its net income to fall by around 7.5% if it keeps leverage at the same level, all else equal. Obviously, we don't know exactly which assets the funds sold down. Each fund maintains some level of money-market and lower-yielding assets so if these were let go then income levels will be hurt to a lesser extent.
For example PDO cut its repo liabilities by $171m from March to June and also cut its cash (i.e. repo assets + Treasury bills) by $87m. So, only about half of its deleveraging were in "real" higher-yielding income assets. This is certainly better than more income assets being purged from its portfolio. However, this strategy of carrying a significant cash asset balance is not ideal since cash assets of a leveraged fund earn, in effect, no interest since they require the fund to finance them via repo. In other words, if these cash assets weren't there the cash would simply repay a part of the repo, lowering the fund's leverage cost.
If we look at the borrowing levels of the larger funds we see that PIMCO added assets in March but was then forced to backtrack as the continued fall in prices made it necessary for the funds to deleverage. It's not exactly clear what happened and PIMCO aren't going to discuss it but it does look like they added assets too early and were caught on the back foot when asset prices kept falling.
Systematic Income
The picture in the PIMCO Muni CEFs is, arguably, even more interesting. Recall that PIMCO tend to run their Muni funds (as their taxable funds, for that matter) at an elevated leverage level. The drop in municipal bonds this year has mechanically pushed up leverage levels of the funds. However, what's interesting is that PIMCO actually added borrowings in their Muni funds (i.e. further increasing leverage) in January and April.
Systematic Income
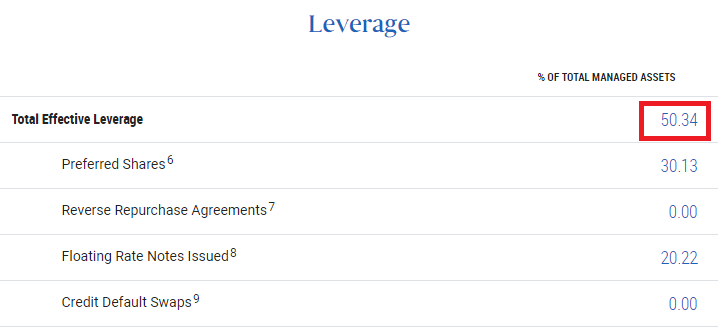
This combination of bond price falls and additional borrowings has resulted in the average PIMCO Muni leverage level to creep up to 50% - well above the 35-40% level of the average tax-exempt CEF.
Systematic Income
In fact, as of June, 4 of 9 funds registered leverage levels north of 50%.
Systematic Income
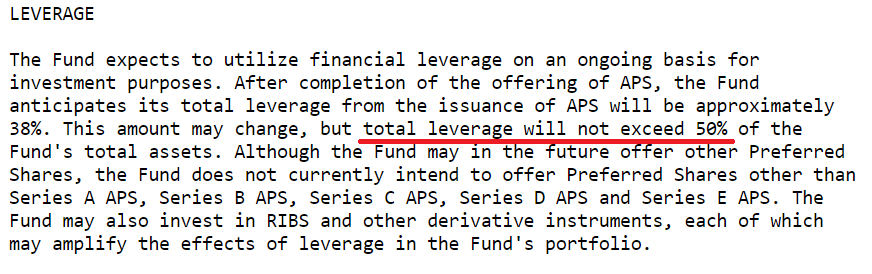
This one is a bit of a head-scratcher. The PIMCO muni funds have a 50% leverage cap mandate such as the one shown below from the PML prospectus so it's not clear what's going on here.
And it's true that leverage at month-end was not miles above 50% (though it was closer to 51-52% on an intra-month basis most likely) so maybe the view is 50.3% is close enough to 50%.
Coverage Update
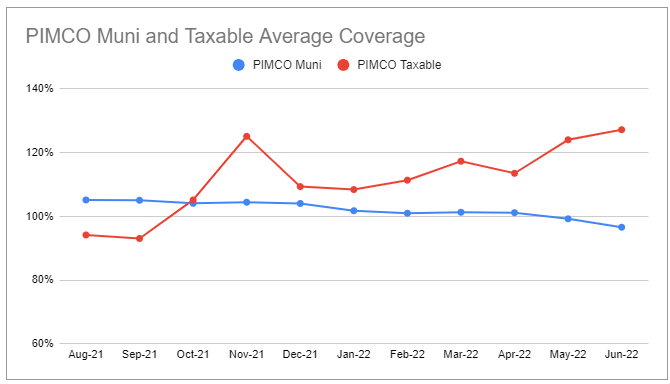
The key coverage takeaway for PIMCO CEF investors has to do with the recent divergence between their Muni and taxable funds. Despite the fact that Muni funds have added some borrowings, the fact that their assets are fixed-rate while their liabilities are floating-rate has caused their coverage levels to move lower (particularly, given they have not cut their distributions).
Taxable funds, on the other hand and as we discuss below, can and do hold floating-rate assets and have recourse to derivatives which can easily change exposure between fixed and floating rates. This has caused taxable coverage levels to hold up much better.
The pattern of coverage in the Muni funds is pretty simple - those funds with the lowest coverage are those with the highest NAV distribution rates. As we have discussed earlier there is nothing magical about the PIMCO funds like PML, PYN and PCQ which have unusually high NAV distribution rates - these funds just have lower coverage.
Systematic Income CEF Tool
Muni UNII levels have started to dip as well for all funds.
Systematic Income CEF Tool
PIMCO doesn't disclose tax-exempt leverage costs but we can get a decent sense from Nuveen which do. The chart below shows leverage costs for a large Muni fund Nuveen Quality Municipal Income Fund ( NAD ) which have almost doubled since last year. This will continue to move up in a more-or-less straight line until the peak in the Fed Funds rate and will continue to put pressure on tax-exempt fund income levels.
Systematic Income
Taxable coverage look a bit more stable though there is wide variation. PDO is, as usually, there with comically high coverage which will probably keep moving higher despite a modest increase in its distribution.
Systematic Income CEF Tool
Taxable UNII levels are all above zero with PDO, again, playing the role of a hero which points to another large special to come later this year. PAXS UNII has also been increasing rapidly despite its recent launch and we expect a special later this year from this fund as well.
Systematic Income CEF Tool
A Look At The Income Profile
Broadly speaking, the income profile of a credit CEF is a function of sector allocation, the mix of fixed-coupon and floating-rate assets, its leverage structure and changes to these factors over time.
The most important factor in CEF income levels at the moment is the sharp rise in short-term rates this year. Few funds outside of unleveraged equity CEFs have remained immune to this driver.
To understand how the income of a given fund is impacted by the change in short-term rates we need to break down the fund's sensitivity to changing short-term rates in its assets, its liabilities and any off balance-sheet derivatives.
In this section, we use PDO as a case study to understand how the PIMCO taxable suite income level might respond to the rise in short-term rates. PDO is a decent fund to use as it's large and more representative of the broader PIMCO taxable suite than a fund like PDI which is overweight MBS.
Unfortunately, PIMCO don't spell out exactly which assets in their portfolio are floating-rate or fixed-rate (at least not fully as they would show a capped floating-rate as a non floating-rate asset, for instance), however, we can make some estimates. For instance, we can assume that 100% of loans are floating-rate while 100% of bonds, preferreds and mortgage REITs are fixed-rate. We assume half of non-agency MBS holdings are floating-rate which is likely conservative as is the 75% ABS assumption. From this floating-rate asset figure of $1669mm we subtract all of the repo (i.e. where PIMCO borrows cash against collateral, paying a floating-rate). We also add the net pay-fixed / receive-Libor swaps.
If we do this back-of-the-envelope calculation we see that the net floating-rate exposure of PDO is about $260m or 16% of its net assets. There is clearly some uncertainty about this figure so it's far from exact. However, what we can conclude is it's probably not negative, meaning the income of PDO is either neutral to rising short-term rates or benefits from it in a modest way.
Systematic Income
Takeaways
Within the taxable suite, we continue to hold PDO. As we highlighted recently, the fund has benefited from its not unexpected distribution hike with its discount compressing towards the rest of the taxable suite, though a significant gap remains. We continue to view the fund as attractive but keep an eye on PAXS as a potential alternative if it cheapens further relative to PDO.
For further details see:
PIMCO CEF Update: Gauging The Impact Of Rising Short-Term Rates On Income