BORR - Precision Drilling: On The Move For Better Returns
2023-08-22 10:16:12 ET
Summary
- Precision Drilling Corporation provides onshore drilling and production services to E&P companies in the oil and gas industry.
- The company has the opportunity to leverage free cash flow generation through higher rig activity and better rates.
- Precision Drilling is focused on reducing debt, increasing operating efficiency, and implementing organic innovations to boost rig efficiency.
- The valuation makes sense. There are a lot of scenarios which can offer upside from current levels.
Precision Drilling Corporation (PDS), gives onshore drilling, finalization, and production services to E&P companies. Under its two segments, Contract Drilling and Completion and Production Services, the company offers various services to the oil and gas industry. With a capacity of 225 land drilling rigs, the company is one of the largest operators in North America.
Investment Thesis
As a result of higher rig activity and better rates, the company has the opportunity to leverage FCF generation. An effective debt reduction strategy and increased operating efficiency will enhance equity upside potential. Industry trends will be an essential factor for the company as well as maintaining favorable operating margins. In addition, organic innovation has been key throughout the process as rising CapEx will boost rig efficiency. All these upgrades are part of the investment thesis, which could make sense for a buy at the current valuation levels.
Company Analysis
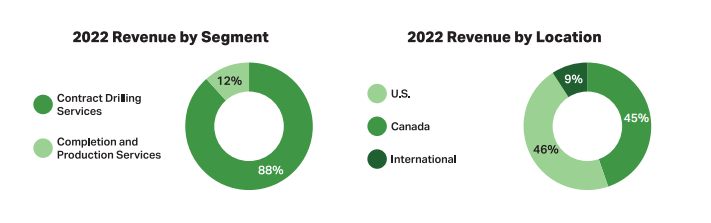
At the end of 2022, PDS's revenue could be broken down into two pieces. First by segment, Contract Drilling Services ((CDS)) and Completion and Production Services ((CPS)), or by Revenue location. In the latest annual report , shows that revenue by segment has been constant over the last five years. Geographically the US's based revenue has become the largest portion. Later, I will evaluate the implications of such splits and the margins, ultimately leading to the company's earnings.
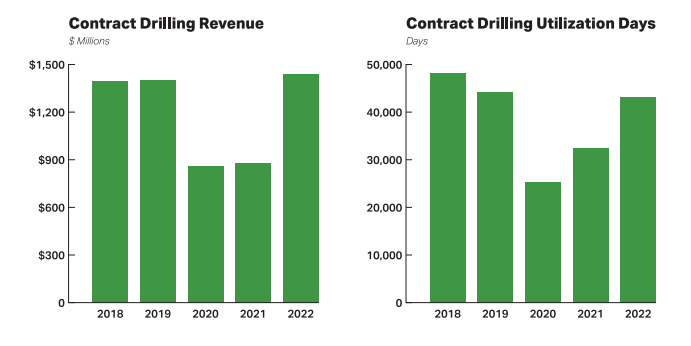
In more detail, the two segments operate differently by nature. The CDS segment provides onshore drilling services to E&P companies. Obviously, this is the most important segment, so taking a closer look seems in order. Here, it is important to note that PDS serves 32% of the total active drilling market in Canada and 8% of the total market in the US. However, the 225 rig count splits between 111 units in Canada, 101 in the US, and 13 in the Middle East. Below, there is a snapshot of the CDS revenue and utilization days over the last five years. Importantly, revenues have surpassed pre-pandemic levels despite fewer utilization days. This is a result of higher industry rates, the implementation of Alpha and EverGreen technologies, and other organic innovations that I will touch on later on.
Importantly demand seems to be robust, and the management team mentioned a tighter supply in Canada in the latest earnings call . While it may seem optimistic, CEO Kevin Neveu hinted at the possibility of having all super-spec rigs near full utilization by next year. In particular triple rigs seem more in demand, and those are generating upwards of CAD 35,000 a day in revenues. All in all, the company even had an over-demand of 5 rigs in Canada that could not satisfy.
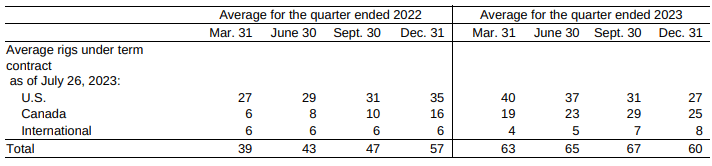
Additionally, PDS is weighing options for locking in longer-term contracts in its CDS segment. In the last quarter alone, the company secured 10 long-term contracts. Some clients appear to be requesting 1-3 year contracts for the rigs, while the management team is reluctant to fully award those at current rates. Some examples here come as reported in the last quarter. Take-or-pay contracts have increased from 18 to 27 in the US and from 15 to 25 in Canada. E&P clients are increasingly willing to lock in for longer terms. Internationally, the company expects to secure two extra long-term contracts up from the current six. At this point, it seems that PDS is awarding some contracts at high rates while having some room to secure further contracts should there be more demand upside. The flexibility is there while the trend is favorable as seen below.
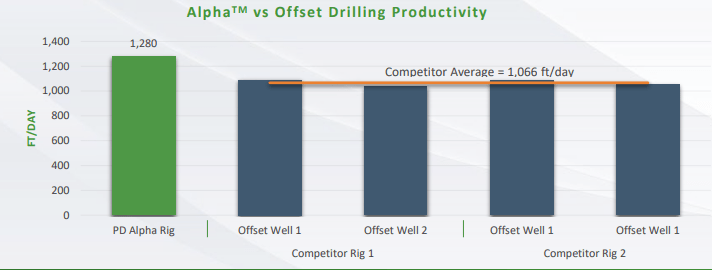
Now, talking about the operating efficiencies, this is largely due to the Alpha and EverGreen technologies. These systems offer a whole suite of pad drilling capabilities, operating efficiencies, fuel management, and more. As of Q2, over 75% of the North American Super Triple fleet had Alpha incorporated, a 38% increase from a year prior. Importantly, Alpha and EverGreen revenues increase 60% YoY while no customers turned off those services in the rigs. The company presented a case in its latest investor presentation outlining the benefits of Alpha as depicted in the image. For the company, the software systems roughly add a range of CAD 1500-2500 in extra revenues per day. At current rates, that is roughly 6% in extra revenues, give or take.
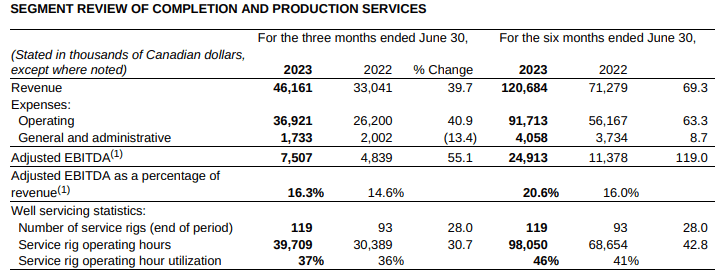
Turning the page to the CPS segment, the trend seems to move in lock-step with the CDS business. Intuitively, higher activity calls for more services in the wells and renting of equipment. There is one thing to take note of though: service rig operating hours are returning to levels not seen since 2015. In the figure below, note how service hours are up over 30% on a YoY basis and EBITDA margins are improving on higher top-line revenues. In the end, a larger number of active rigs, not only benefits the CDS segment but it boosts the activity in the entire business. The operating activity is in my opinion one of the key drivers to watch in the following quarters.
Industry Snapshot
As mentioned before, higher commodity prices are good for drillers, as the E&P clients lose their capital constraints and benefit from higher prices. In the North American industry, the demand appears to be strong. According to this report , the global onshore drilling market is poised to expand at a 5.1% CAGR. Several other sources agree with that estimate.
The main drivers of such growth are the operating efficiencies allowing a better return for the effort for drillers. Pad drilling, for instance, has marked a new way of drilling, focusing on higher efficiencies and productivity. Also, increased exploration activities have contributed to the trend. Many competitors in the industry are renewing their fleets and upgrading in terms of horsepower to serve this demand. As a result, I would expect some intense capital investment by the companies as they try to upgrade their fleets. Which in turn will favor the healthier cash flow generators and solid balance sheets in the industry.
Many larger projects on the energy transportation side, are helping the cause here. The Trans Mountain Pipeline is set to increase capacity in Canada by nearly threefold. In connection to the US, the Line 3 pipeline replacement will also contribute to increased capacity. LNG will also become a main character in Canada. The Coastal GasLink pipeline is currently under construction and upon completion, it will unlock ( 91% completed ) about 2.1 billion cubic feet per day of LNG with potential of up to 5 billion. For context, the US industrial sector uses about 29 billion cubic feet per day of gas.
Financial Assessment
Moving to the financial assessment, there are a few considerations to bear in mind before jumping right into the heart of the company. The drilling industry is a capital-intensive heavy-asset type of business industry. Financing plays an important role in the company's operations as usually large amounts of debt are employed. As a result periods of higher FCF generation are commonly used to delever the balance sheet, improve equipment or add new pieces.
I will start by analyzing the liquidity. Obviously, after the pandemic, the liquidity position deteriorated. The declining trend, however, started about 10 years ago when industry activity took a hit. CFO during that time, for instance, was in the CAD 400-600MM levels (2011-2015), while last year's was just CAD 237 million. As a result, the company has lost some organic cash generation power to fund its operations. Moving forward, the catalysts could turn the story into a similar 2011-2015 environment.
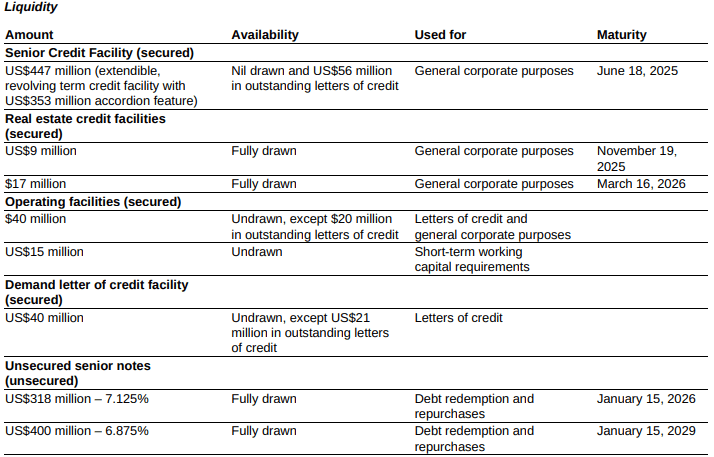
Over the last five years, current assets have been within a reasonable range. After the pandemic struggles, accounts receivables increased as a result of higher activity. Besides the cash on hand in the balance sheet, PDS has a pool of liquidity available if needed of about $575 million. The breakdown is below.
Now let's take a look at the long-term debt. As a capital intense business, PDS historically has maintained large sums of debt, taking advantage of favorable financing rates. Lately, that regime has changed, and servicing that amount of principal has cut much of the FCF potential. Intelligently the company has come ahead of the curve and it has targeted a very conservative debt level. Over the following years, the company is targeting a CAD 500 million debt level. So far, the count sits at CAD 100 million of total debt repaid YTD. If the company achieves these goals by 2025 - it would mean a Net Debt to EBITDA ratio of less than 1x. For reference, at the end of 2022, that figure stood at 3.4 times.
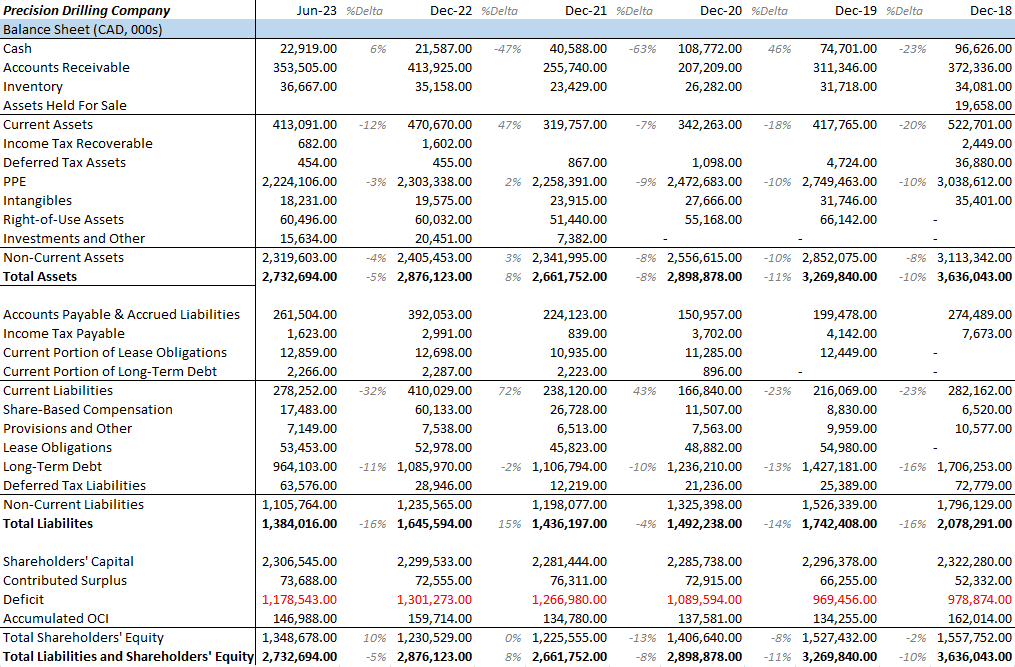
More in detail, long-term debt reported in Q2 is CAD 964 million, down from CAD 1.7 billion at the end of 2018. All while surviving a multi-quarter-long disruption. Aggressively, I believe the net debt to EBITDA will reach at least the 1.4 times ballpark by year-end. That would assume debt to sit around CAD 900 million and EBITDA getting north of CAD 600 million, but more on EBITDA estimates later. On the other hand, a weakening CAD over USD hurts the company's service cost, as USD interest payments, become more expensive. At the moment, the cost of debt rounds about 7%.The major long-term debt breakdown is as follows, USD 318 million at 7.125% due 2026 and USD 400 million at 6.875% due 2029. Accordingly, interest expense will come down significantly, especially from 2024 onwards unlocking a new upside for FCF. For more color, take a look at the Balance sheet progression over the last five years.
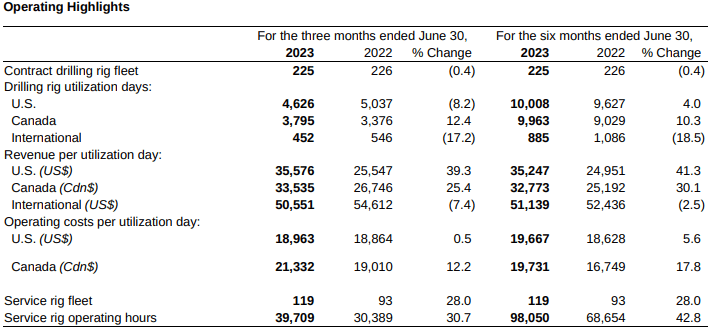
Turning the page to the income statement, there are a few details that the company is taking advantage of. Starting from revenues, we can see that the latest quarters have been remarkable. The better top-line results come as higher activity in Canada and better rates across the fleet have made an impact. For instance, active rigs for the first six months of the year came at 55 in the US and 55 in Canada, up from 53 and 50 respectively. Rates during the same period, have increased 41.3% in the US and 30.1% in Canada. In contrast, operating costs have been managed more effectively with changes of 5.6% in the US and 17.8% in Canada, which are significantly less than the top-line rate increases. Here is a little color on more operating metrics.
While the operating metrics are encouraging, I would like to explore a little more the margin side of the story. In the latest quarter, Adjusted EBITDA came in at CAD 142 million or a 33% margin. Fueled by lower operating costs and less share-based compensation, the company recorded its highest quarterly margin since 1Q16. Additionally, Adj EBITDA reached CAD 345 million in the first 6 months of 2023, far exceeding 2022's entire year numbers. In addition, net income totaled CAD 122 million up from a loss of CAD 68 million in 2022 during the same six-month period. All of this took place despite oil and gas prices declining during the quarter. The signs of higher activity coupled with higher drilling rates appear to offset lower commodity prices that remain in a comfortable range.
On the lower end of the income statement, there will be some upgrades as well. Obviously, the PPE base is lower than say, 4-5 years ago, and currently, rig equipment accounts for CAD 2 billion out of the CAD 2.3 billion at the end of 2022. Rig equipment has a useful life of 5 to 20 years, depending on the asset. As a result, I expect D&A to lower in the coming years to around CAD 260-270 million annually, partially offset by new capital spending improvement. In 2022 and 2021, D&A totaled CAD 279 million and 282 million respectively.
Finance charges are also poised to come down during the coming years. The debt reduction efforts will have an impact on that line of the income statement, for instance, a 7% interest on CAD 500 million (2025 debt target) will account for roughly CAD 35 million in interest expense. Naturally, there may be refinancing in the meantime and other charges such as interest on lease obligations. All in all, I think it would be fair to see finance charges down to CAD 50-60 million in the next year or so. Finance charges in 2021 and 2022 amounted to CAD 91 million and 87 million respectively. These efforts can add around CAD 35-50 million a year to the bottom line.
Lastly, I would like to touch on the cash flow statement. Particularly I will like to outline the underlying moves happening which could improve the overall profitability of the company. At the moment it is fair to assume that CFO is gaining momentum. CFO during the first two quarters of the year came in at CAD 241 million up from CAD 70 million during the same period in 2022. The last time the company started the year in such fashion was in 2015, back when the industry was enjoying the bonanza from the start of the decade. This period has significant similarities, as the reader has probably noticed.
Capital spending is now moving upward as the management team is preparing PDS for a more efficient and innovative asset base. Starting in 2022, there has been a focus to use more capital to maintain and improve the asset base. In 2022, CapEx net of asset sales totaled CAD 184 million, a CAD 108 increase versus 2021. So far this year CapEx sits at CAD million compared to 75 million on a YoY basis. Importantly, a considerable part of the CapEx budget is going towards expansion and upgrade of the rigs. This year alone management expects that part to be around CAD 50 million. In aggregate, I believe that the upgrades and technology efficiencies are beneficial for PDS. Moving forward counting some rig activation, CapEx could be around the CAD 200 million figure per year in the coming periods. The last time PDS spent around those numbers was in 2016 back when the company counted CAD 3.6 billion in PPE.
Peer Comps
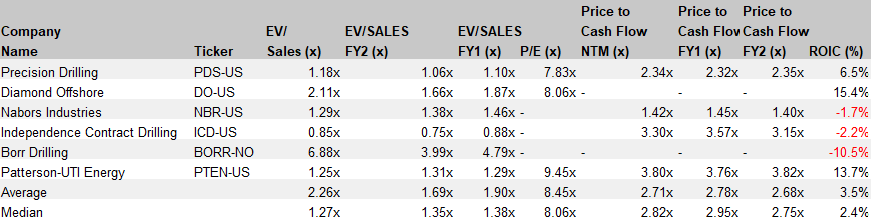
Having established the current situation of the company and observed it versus its past, it is now time to compare it to the comp group. I have picked the closest oil and gas drillers in the industry, by size and geographic revenues. At first glance, it is important to see how the FCF margin stands out over the rest of the players except PTEN . Importantly, DO numbers may be substantially different as the company operates in the offshore drilling industry. In the table below PDS seems to be ahead of the peer group in all the profitability categories. A promising trend that can improve further in the coming years.
FactSet
Given the difficulty of becoming profitable in such a business, one might expect to pay a premium. Surprisingly this is not the case across multiple valuation metrics. PDS comes as one of the cheapest players in the industry, albeit ICD which is heavily leveraged and investors have been reluctant to offer their confidence. Having above-average profitability with below-average valuation multiples sounds like a good deal to me. Depicted below is the complete peer group illustrating various valuation metrics.
In the latest point, I would like to draw a picture of Alpha & EverGreen technologies vs the peers' systems. For instance, PTEN's technology systems are reported under 'Other' in the financial statements. Revenue for that segment decreased to $21 million from $24 million a year prior. At NBR , Rig Technologies (the comparable service to PDS) grew to $63.5 million up from $45 million a year earlier. The robust revenue growth of 41% is still a little short of PDS' 60% rate. ICD's Impact, the comparable technology, increases between $500-1500 extra in operating profit per rig. However, only about 30% of the company's rigs are up to date with the latest technology. By contrast, over 90% of Canadian rigs enjoy Alpha's enhancements, with similar numbers in the US rigs. It is obviously hard to extract clear conclusions from such numbers without the express content from the clients. Nevertheless, I believe PDS's systems have proved to be on point, and clients are awarding that with near 0 churn rates.
Valuation
Inevitably, the valuation needs to make sense in order for this investment to be attractive. The multiples as we have seen before appear depressed compared to the other peers. In trying to see the big picture and multiple scenarios I have opted to go in for a multi-stage sensitivity analysis. Before anything else, let me walk you through my logic here.
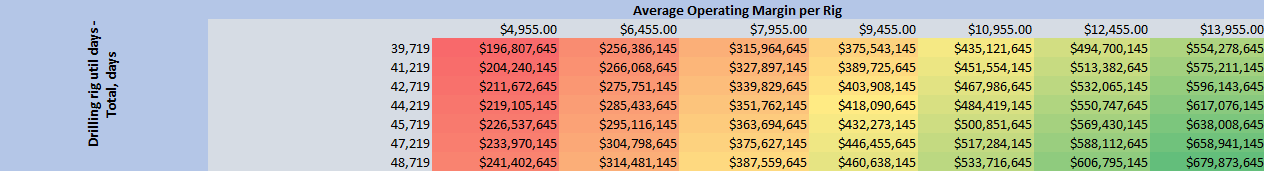
In the first stage of my valuation analysis, I outlined a range of potential operating margins per rig. The lowest being CAD 4,955 to a high of CAD 13,955, this is for all the rigs in the company, not only the ones located in the US. On a TTM basis, the average operating margin per rig stood at CAD 9,455. Based on the operating margin per rig, the lowest year since 2009 was 2017, at about CAD 5,400. The latest quarter margins, came at CAD 11,500 overall, one of the highest on record. For operating days, I started with a base case equal to the TTM numbers at 44,219 operating days. Below you can see how the matrix plays out based on the inputs.
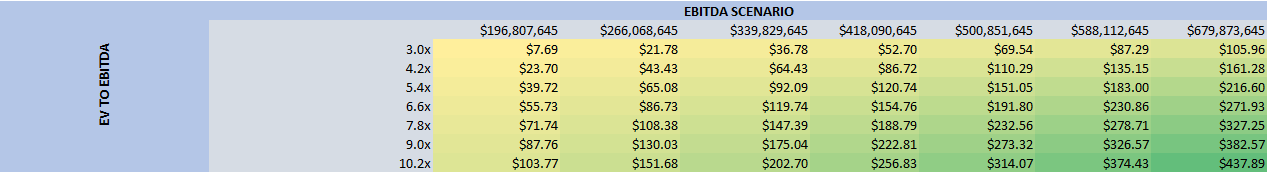
After getting a sense of the potential EBITDAs, I concerned myself with the share price could be affected by each level and multiple. In the matrix above I have used the diagonal as the row input and extracted the high and low points of NTM EV/EBITDA multiples over the last five years. Note that consensus projects EBITDA to be CAD 648 million and CAD 658 million in 2023 and 2024. The average EV/EBITDA multiple for the peer group stands at 6.2 times. It is revealing to see the results for potential share prices.
Certainly, the most optimistic case in the matrix below is far too high in my opinion. The middle point arrives at an implied share price of about $155. For that scenario to play out, the company would need to deliver constant EBITDA margins of about CAD 420 million, which has been rare in the past. Instead, I believe the most realistic point, in the long run, lies between $92 and $120 a share. A multiple expansion from current levels (3.6x) to around 5.4x-6.6x, along with an EBITDA in the range of CAD 340 million, seems more likely. The power of a lower debt level accompanied by consistent profitability can result in hefty returns for the shareholders.
Risks
For one, labor seems to significantly impact the company's operations. Besides, the industry is suffering from a skilled-labor shortage. In Q1 of this year, in the mining, quarrying, and oil and gas extraction industry, the unemployment rate was reportedly 0.4% vs 8.4% YoY. Salaries have increased to attract more workforce but currently, the market is pretty tight. Expansion of operations can be affected by the labor market. I will probably keep an eye on the situation and see if it could affect the company's operations.
Customer financing could be affected by higher and longer rates, cutting the refi possibilities. Here I am taking a more intuitive approach. As of 2022, 41% of the company's revenue came from 10 clients alone. The industry heavily relies on financing to continue operations. There is a possibility that many pieces could fall apart if any of the larger customers were to have trouble financing in what appears to be higher rates for longer environment. The network is highly interconnected and one large player could have an impact on the market.
Conclusion
Precision Drilling appears to be in a good position to unlock a number of milestones. As we have established, there are a few points where the market has punished PDS in excess. Such as excessive leverage, low profitability, and below-average activity rates. Nevertheless, I consider the upcoming years promising for the company, and at current levels, there is fair room for upside. All the major points that seemed the main reason for lower performance can also result in the catalysts for better share returns.
For further details see:
Precision Drilling: On The Move For Better Returns