IBB - Private Domestic Sector Prints $113 Billion Surplus Pointing To Better Markets In October
2023-10-12 18:06:30 ET
Summary
- September 2023 saw a surplus of $113B in the US domestic private sector, boosting financial balances.
- Bank credit creation showed signs of improvement, potentially signaling the start of a speculative credit creation boom.
- The US sectoral balances and fiscal flows suggest higher markets in October, with positive change rates and rising financial aggregates.
The purpose of this article is to examine the US sectoral flows for September 2023 and assess the likely impact on markets as we advance further into October 2023. This is pertinent as a change in the fiscal flow rate has an approximately one-month lagged effect on asset markets and is a useful investment forecasting tool. Other macro-fiscal flows can point to events months or years ahead.
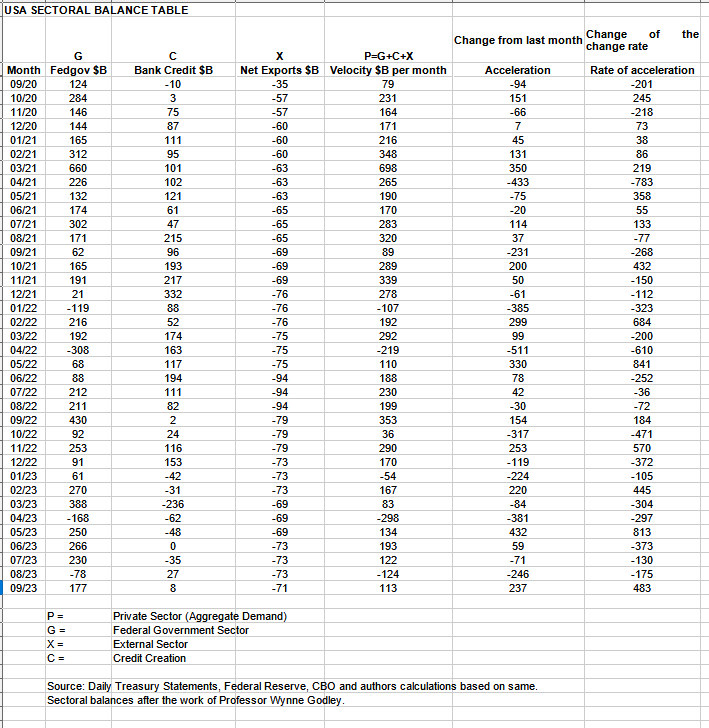
The table below shows the sectoral balances for the US which are produced from the national accounts.
In September 2023, the domestic private sector recorded a surplus of $113B and this is a positive result and lifted financial balances in the private domestic sector by that amount.
From the table, one can see that the $113+ billion private domestic sector addition of funds came from a healthy $177 billion injection of funds by the federal government (and this includes the new injection channel from the Fed of around $11B from interest on reserves that went directly into the banking sector), less the -$71B billion that flowed out of the private domestic sector and into foreign bank accounts at the Fed (the external sector X) in return for imported goods and services. Bank credit creation was a weak $8B and breaks the chain of consecutive negative results that have plagued the banking sector all year. This again points to the possible start of the bank-led speculative credit creation boom that is a symptom of the last and most spectacular part of the land cycle that potentially booms and then busts in 2026 reaching a bottom in 2029-30.
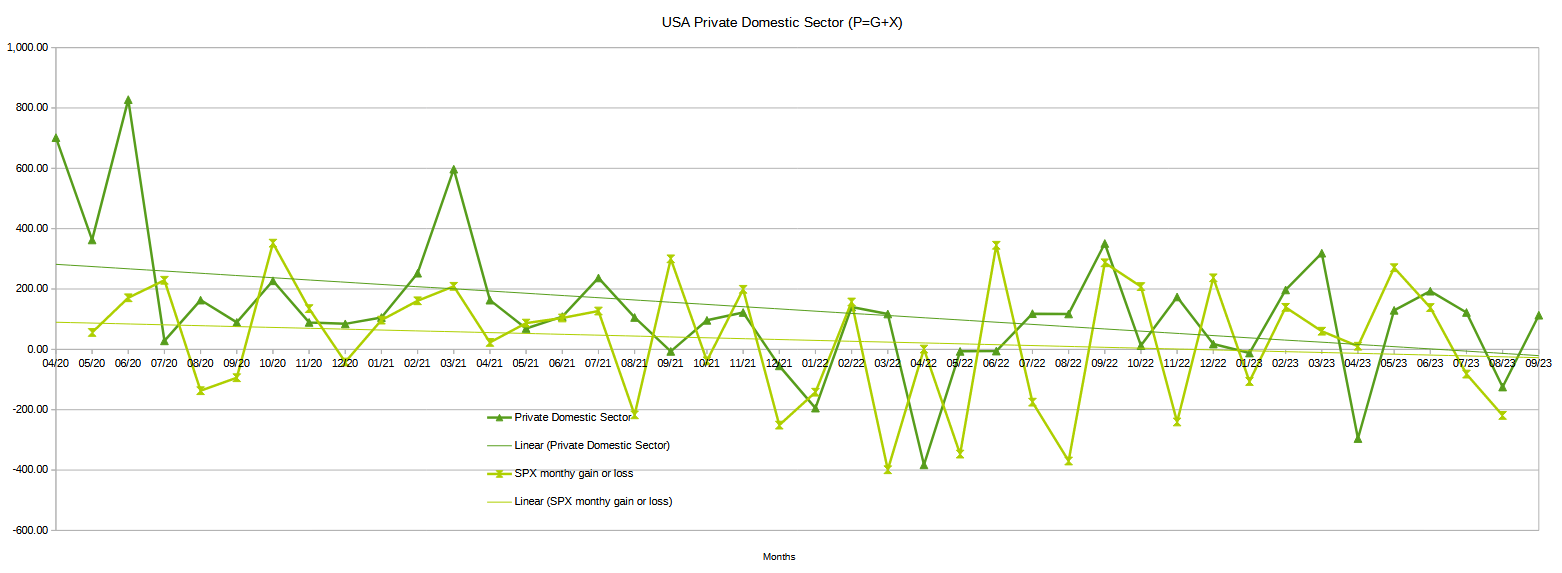
The chart below shows the sectoral balance data plotted in nominal terms. The calculation is federal government spending or G, plus the external sector (X and usually a negative factor) to leave that amount of money left to the private domestic sector, or P, an accounting identity true by definition.
The chart suggests that the SPX's next move would be for higher markets heading into October given that financial balances in the private domestic sector have risen in September by a substantial amount and all the change rates are positive and quite large month over month.
This simple model proved correct for last month where the SPX did indeed finish lower for the month than the month before and was worse still than the month before and the model was correct on that basis as well.
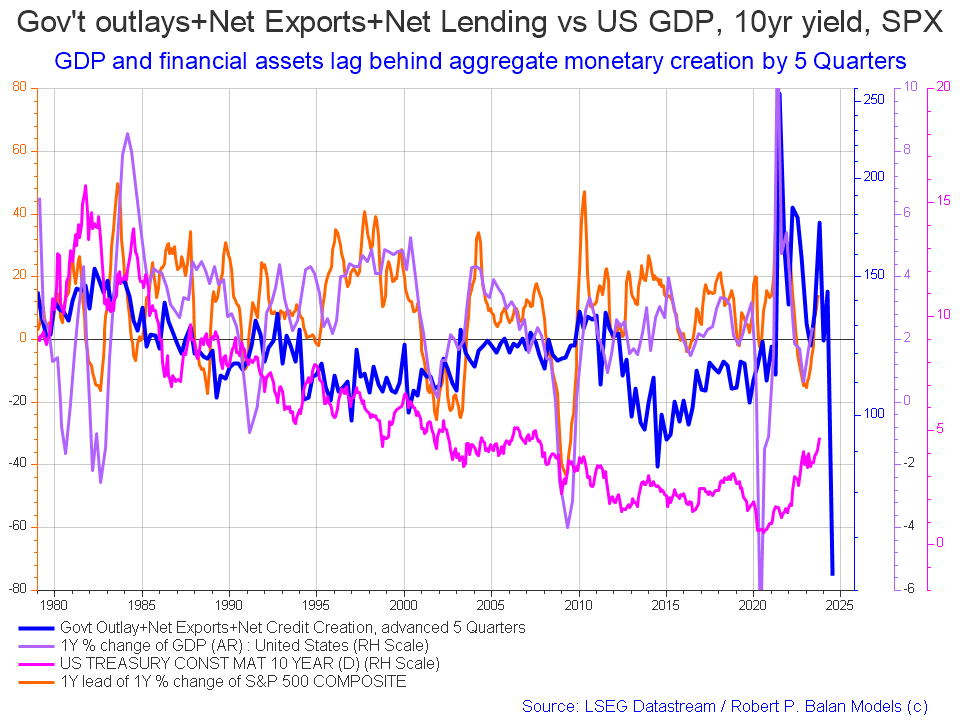
The following chart emerges when one graphs the change rate of the information in the US sectoral balances table above and adjusts for impact time lags. This is like a long-range market radar set.
The blue line shows the fiscal impulse from federal government outlays plus bank credit creation and less the current account balance and leads by up to five quarters (a year and three months). Short term, the financial aggregates, and following co-variant factors, are rising into 2024 whereupon they come down sharply. They come down so low in mid-2024 that such a low has not been seen along the X-axis of the chart and it goes back to 1980!
The change over the last month is that the 10-year yield has risen.
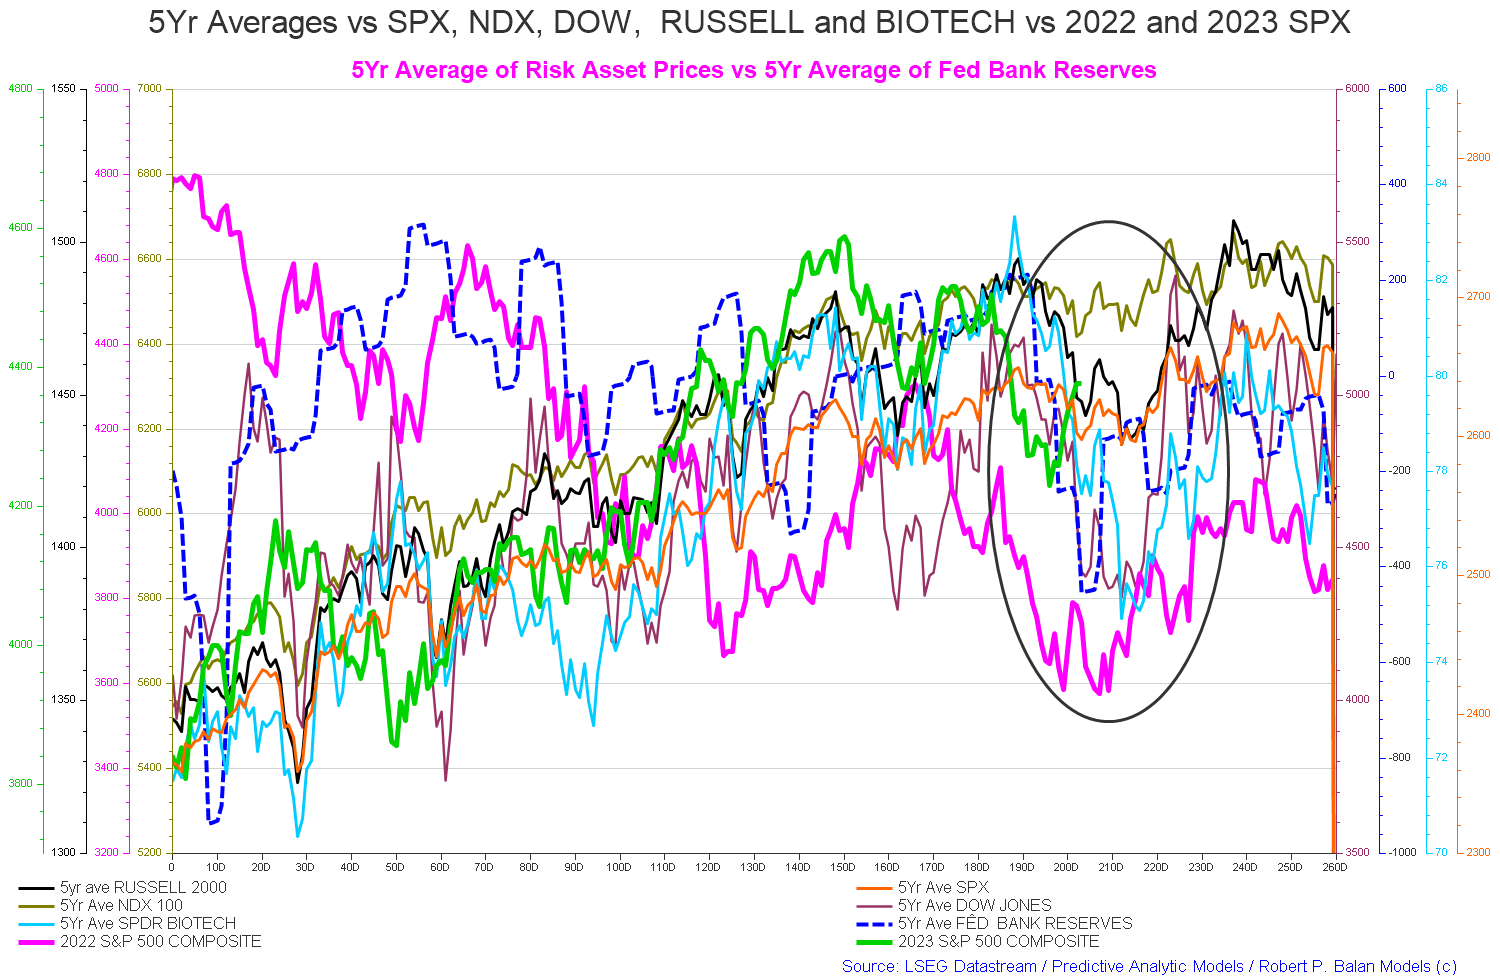
The chart below shows the five-year average of the seasonal stock market patterns for the SPX ( SPX ), NDX ( NDX ), Dow ( DIA ), Russell 2000 ( RTY ), and Biotech ( IBB ) market indexes. The black oval shows roughly where we are (trading day 204) at the time of writing and the end of the green line on the chart below.
The five-year index averages call for a sideways movement from now (trading day 204 at the time of writing) into trading day 210 (the last third of October) and then rising markets up to about trading day 240 (early December) being the seasonal Xmas/New Year rally. Note that the overall trend is one of rising markets from left to right driven by overall positive fiscal flows in the order of a private sector surplus of about $1.7T or which about half of this flowed into the US private domestic sector.
The model was exceedingly accurate this month just gone and went exactly as predicted with markets helped down by negative news sentiment from the government shutdown nonsense and the war in the Middle East.
The table below shows the total federal government withdrawals from their account at the Federal Reserve Bank. A withdrawal by the federal government is a receipt/credit for the private sector and therefore a positive for asset markets.
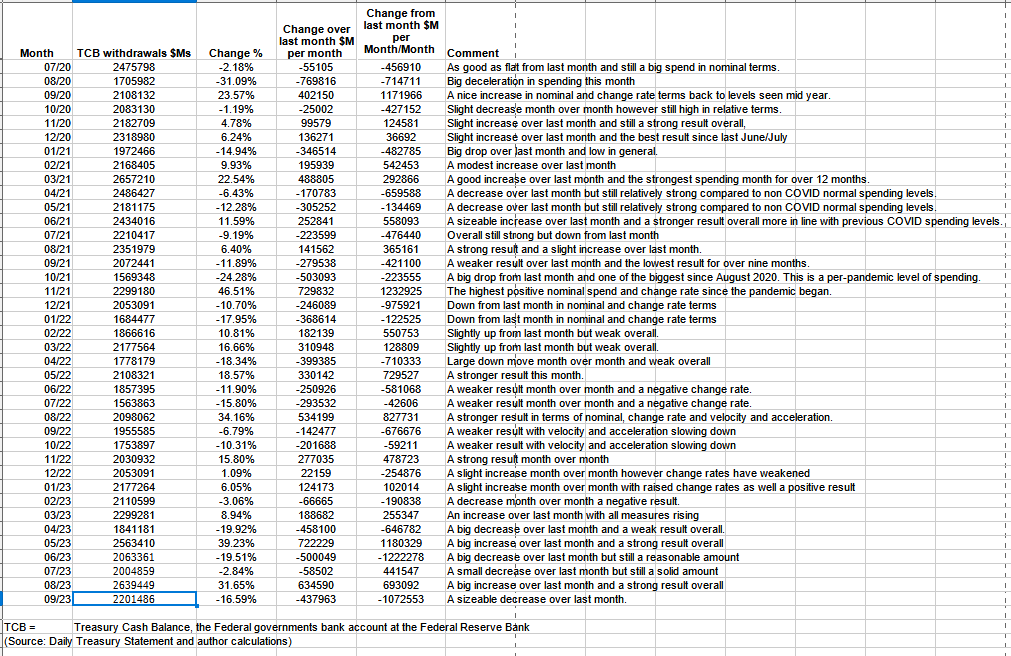
The table shows that total outlays were over -16% less than the previous month but still a strong $2.2T.
The bottom panel highlights in red and green the financial relationship between the currency creator (red area) and currency users (green area). One's loss is the other's gain and vice versa, the difference is that the federal government creates the money via its central bank while the private sector does not have this luxury. Federal taxation removes spending power from the private sector but the federal government does not "need" the money as it can create, ad hoc, as much as it needs at any time. This information has been cleaned of the treasury churn and is a truer representation of federal outlays.
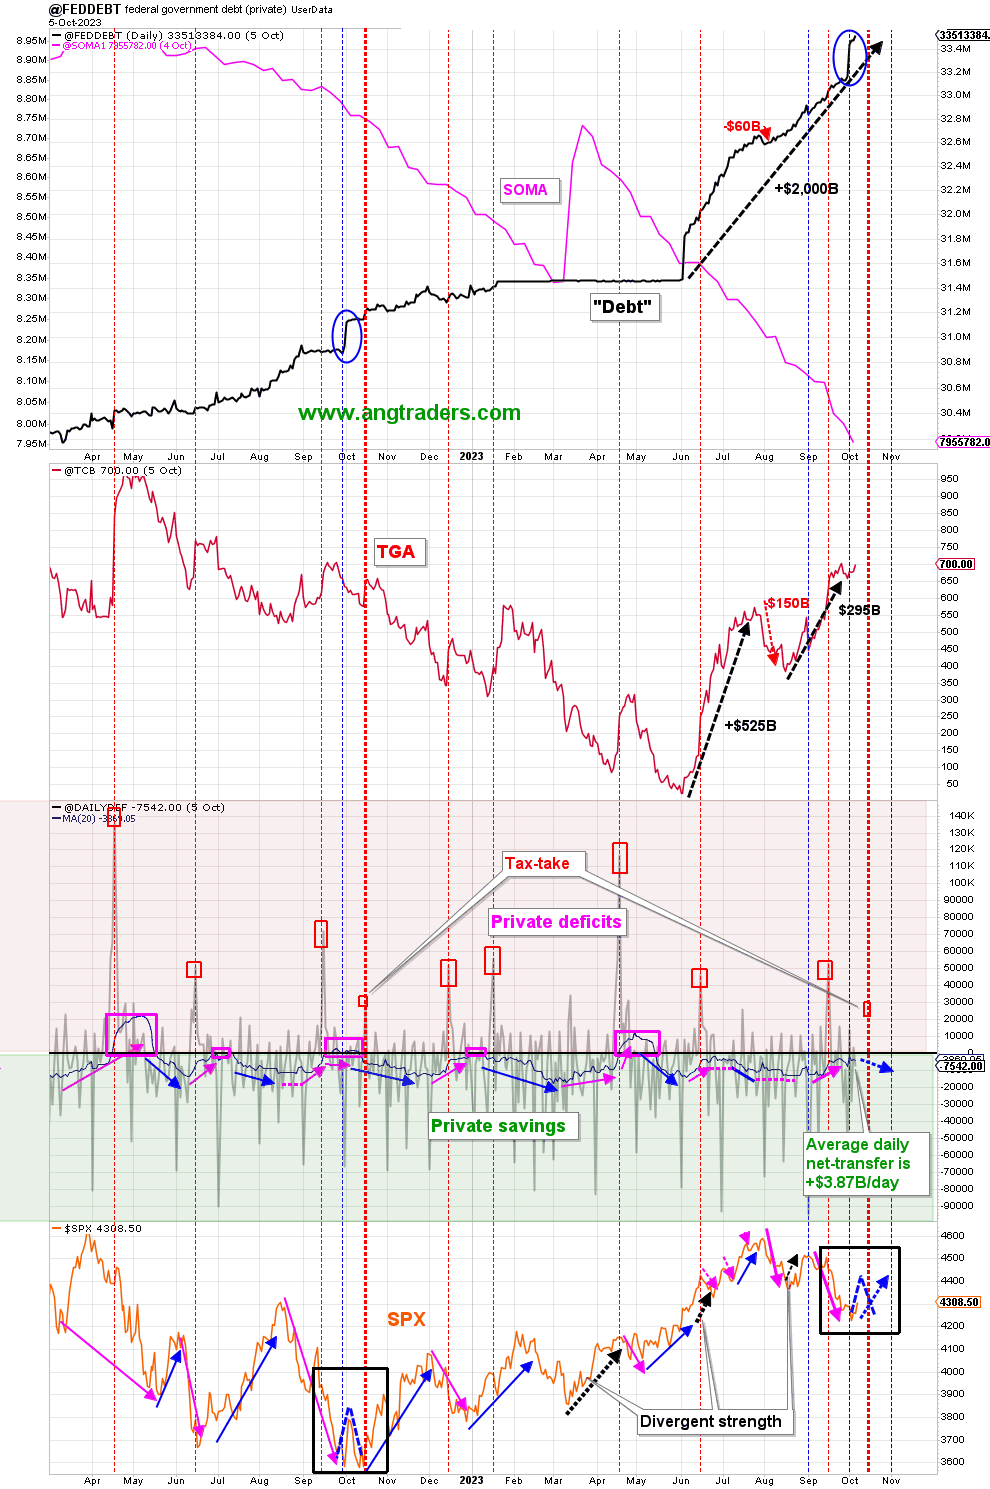
Fund-Flows
- September's net-transfer was +$141B, compared to last September's +$48B.
- The full-year (fiscal-2023) net-transfer was +$1,720B, compared to +$1,166B in 2022...a 48% increase.
- The 20-day average of the daily net-transfers is +$3.87B/day which is well above last year's drain of -$1.50B/day on the same date.
(Source: Mr. Nick Gomez, ANG Traders, Weekly Report for Subscribers the Away from the Herd SA Market Service).
ANG Traders
Note circled with a blue oval the surge in funding (treasury creation) that occurs each year at this time. This sort of fiscal surge will have a knock-on positive effect on asset markets approximately one month from when it occurred and is related to the government charging up department budgets and spending authorizations for the new fiscal year.
The next major fiscal milestone is a small fiscal surge from a small Treasury interest payment at the end of this month. This month is free of major federal taxation events and is one of the reasons why asset markets tend to rise into the end of the month and into the beginning of December and sometimes beyond. Remember that there is a major federal taxation event in mid-December and it is a clear run from now until then.
There is a “liquidity flood” from early November to early January (of the subsequent year), which also tend to boost prices into year-end. “Santa Claus Rally” starting early November."
Source : Mr Robert P Balan
At the White House in the last month, amid threats of a government shutdown, a continuing funding resolution was passed to keep normal fiscal flows operating. No new budget has been authorized yet and as each continuing resolution terminates the threat of a government shutdown reemerges and sends negative fiscal and market sentiment shock waves into asset markets that lower highs and deepen lows that would have occurred otherwise due to the institutionalized fiscal flows. It is likely that there will not be a formal budget passed in fiscal year 2024 and the US federal government will lurch from one continuing resolution to another with the ever-present threat of government shutdowns.
The end of the federal government's fiscal year has ended and a new one has begun and one can put together an overall macro picture of overall spending and taxation levels.
In fiscal year 2023, the federal government spent $6.1T into the economy and removed $4.4T leaving a balance of $1.7T as additional financial balances in the private sector. One could say the universal tax rate was 27% across the whole economy.
Below is a table from the CBO that contrasts the 2023 year with the 2022 year. One can see that the federal government contributed more to the private sector surplus this year than last. One will remember that 2022 was a bad year for asset markets due to the large step down from the 2021 year as the COVID spending wound down. It is the change rate that is critical and in 2023 we have seen a positive change rate year over year in the private sector surplus.
Congressional Budget Office
To ascertain the impact on the US domestic asset markets one must subtract from the $1.7T private sector surplus the portion that went to the external sector and this is expressed as the current account balance after the formulae:
0 = G + P + X
Where
G = Government Sector
P = Private Domestic Sector
X = External Sector
0 = $1.7T + P + (- $0.864T*)
P = $1.7T + (-$0.864T*)
P = $0.836T
* The year-end data is not yet out and I have extrapolated data to get a result to work with.
One can say that of the $1.7T private sector surplus (Federal government deficit) 49% or about one-half flowed into the US economy and the other half flowed into reserve accounts at the Fed owned by foreign entities who then would have saved the bulk of that money as a treasury security in order to get a positive return on their bank balance. One must remember that in return for this money, the external sector sent real goods and services into the US economy. Real things for fiat data entries on a computerized ledger at the Fed.
The drain to the external sector is more or less constant. In any one year what makes the difference between a good private domestic sector surplus and a poor one is the size of the government deficit. In a year where the external sector drain is larger than normal and the government deficit smaller than normal, it means that the private domestic sector is also smaller than normal and one would have a bad year for asset markets. 2022 is a good example of this.
In the first chart in this article, the above formula is calculated and charted on a monthly basis across a zero X-axis line. One sees from the chart that for much of 2022 the private domestic sector balance was negative and so was the SPX index.
2020 and 2021 were strong years for markets and those years had bumper levels of federal government deficit spending that not only over-matched the external sector drain but added a large private domestic sector surplus as well. One sees from the chart that the dark green private domestic sector balance was well into positive territory all through 2020 and 2021 and the light green SPX line was mostly in positive territory as well.
By contrast, the private domestic sector balance and SPX are moving at lower levels now and both often have a negative monthly result.
The next Fed meeting is at the end of this month where most likely another small rate rise will be made that will make life harder for people on variable interest loans such as for cars and credit cards. An in-depth look at the impact of a rate rise or pause is covered in this FOMC article for October/November 2023 that I wrote earlier this month.
Generally speaking, I believe the Fed will raise the interest rate from now until the peak of the real estate cycle in about 2026 at every clear opportunity and then bring it down again close to zero as it did in 2007 and more recently in 2019 once a recession or serious financial crisis has occurred. It takes a clear and present stock market crash and recession for the Fed to change its policy path once it has started raising rates.
The housing chart that was shown last month indicating that the home builder ETFs were peaking and heading downwards has been confirmed by this month's version of the same chart shown below.
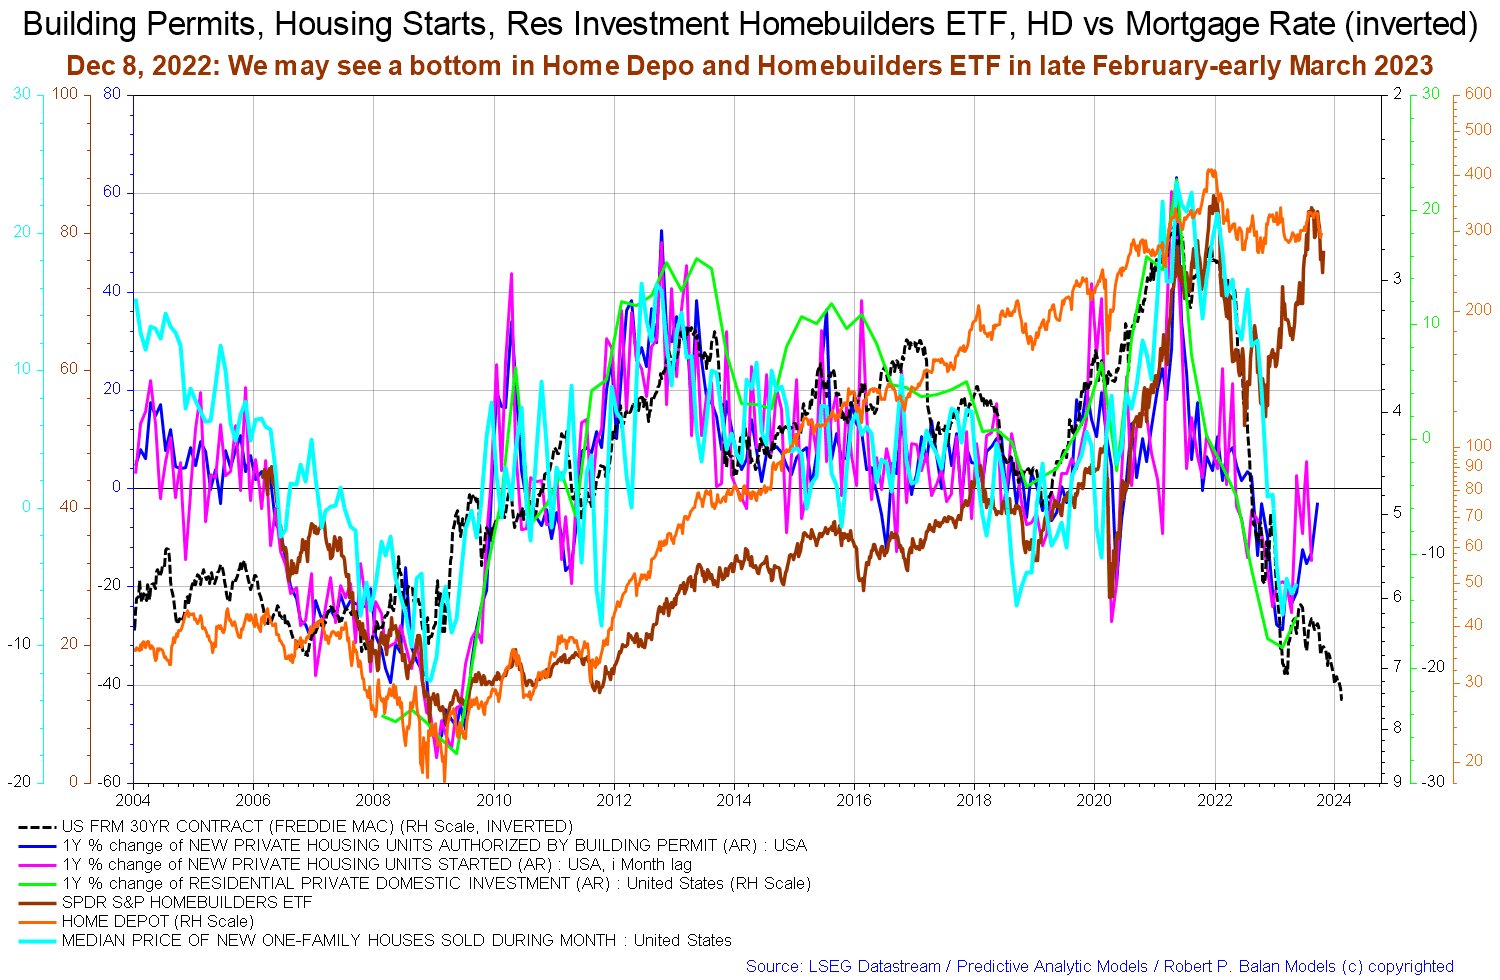
Note that the main changes month over month are that the 30-year mortgage contract (black dotted line and inverted) has risen still further and the brown home-builder ETF line has dropped further confirming the change of trend.
It is important to review the housing market regularly because the housing cycle is the business cycle.
On the larger world macroeconomic side, we have the G5 chart below. The chart below comes from Mr. Robert P. Balan. The chart shows the level of money creation by the top five world governments (the G5) in a change rate format, along with a host of other indexes. This chart gives a sense of important inflection points and direction.
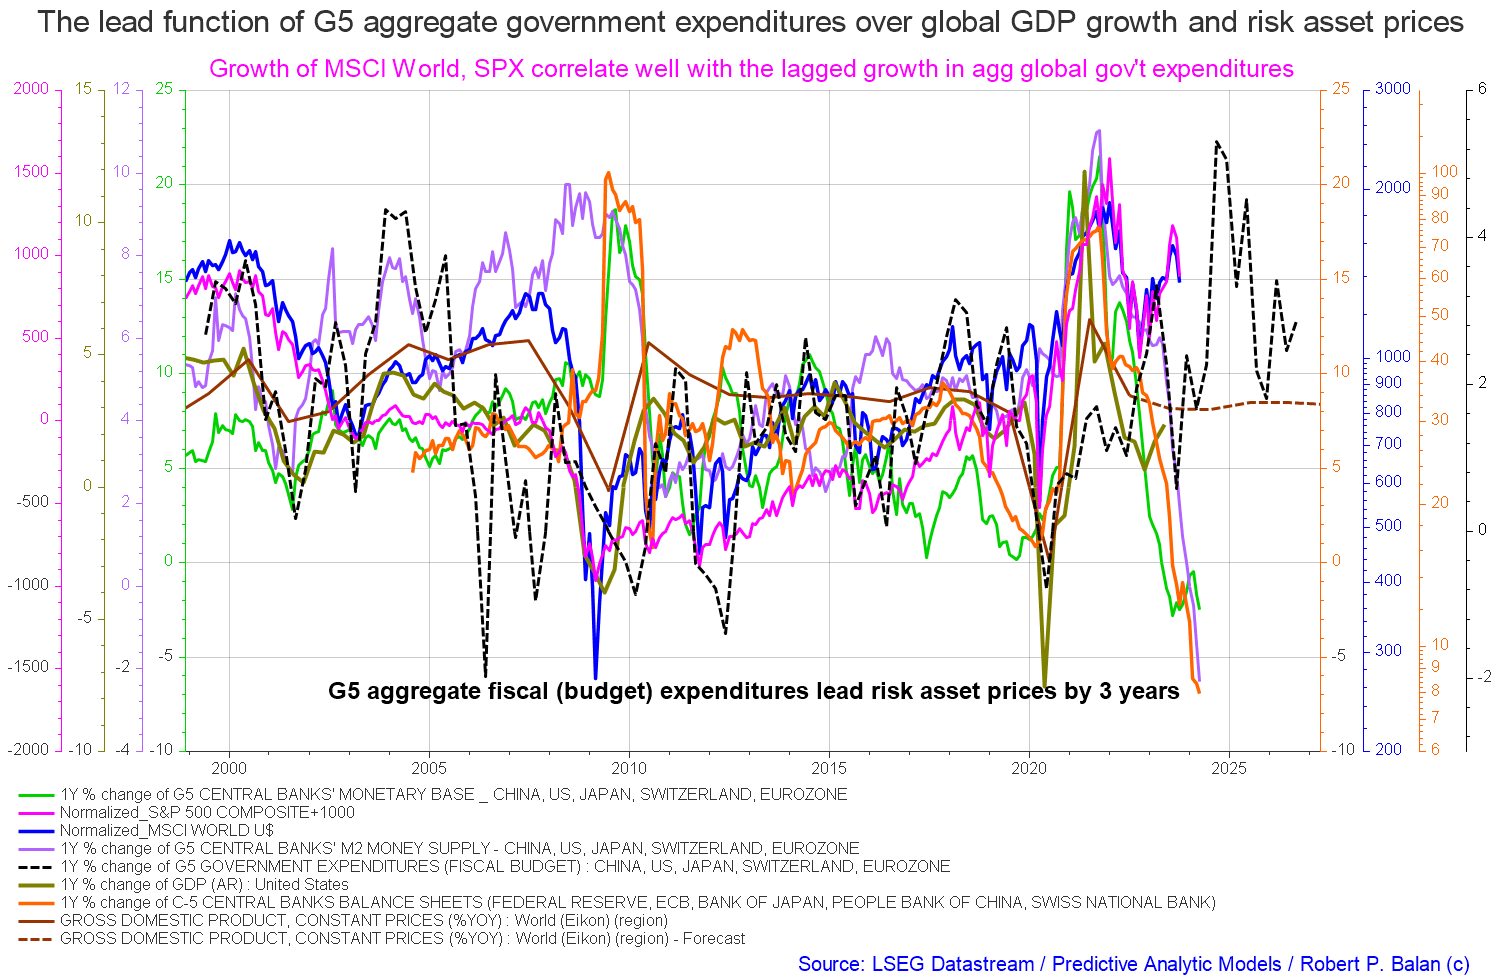
The good news is that after navigating a large drop in monetary aggregates they are now broadly rising to a peak in mid-2024 with some turbulence along the way. They come down again at that point and tally with the second chart shown in this article.
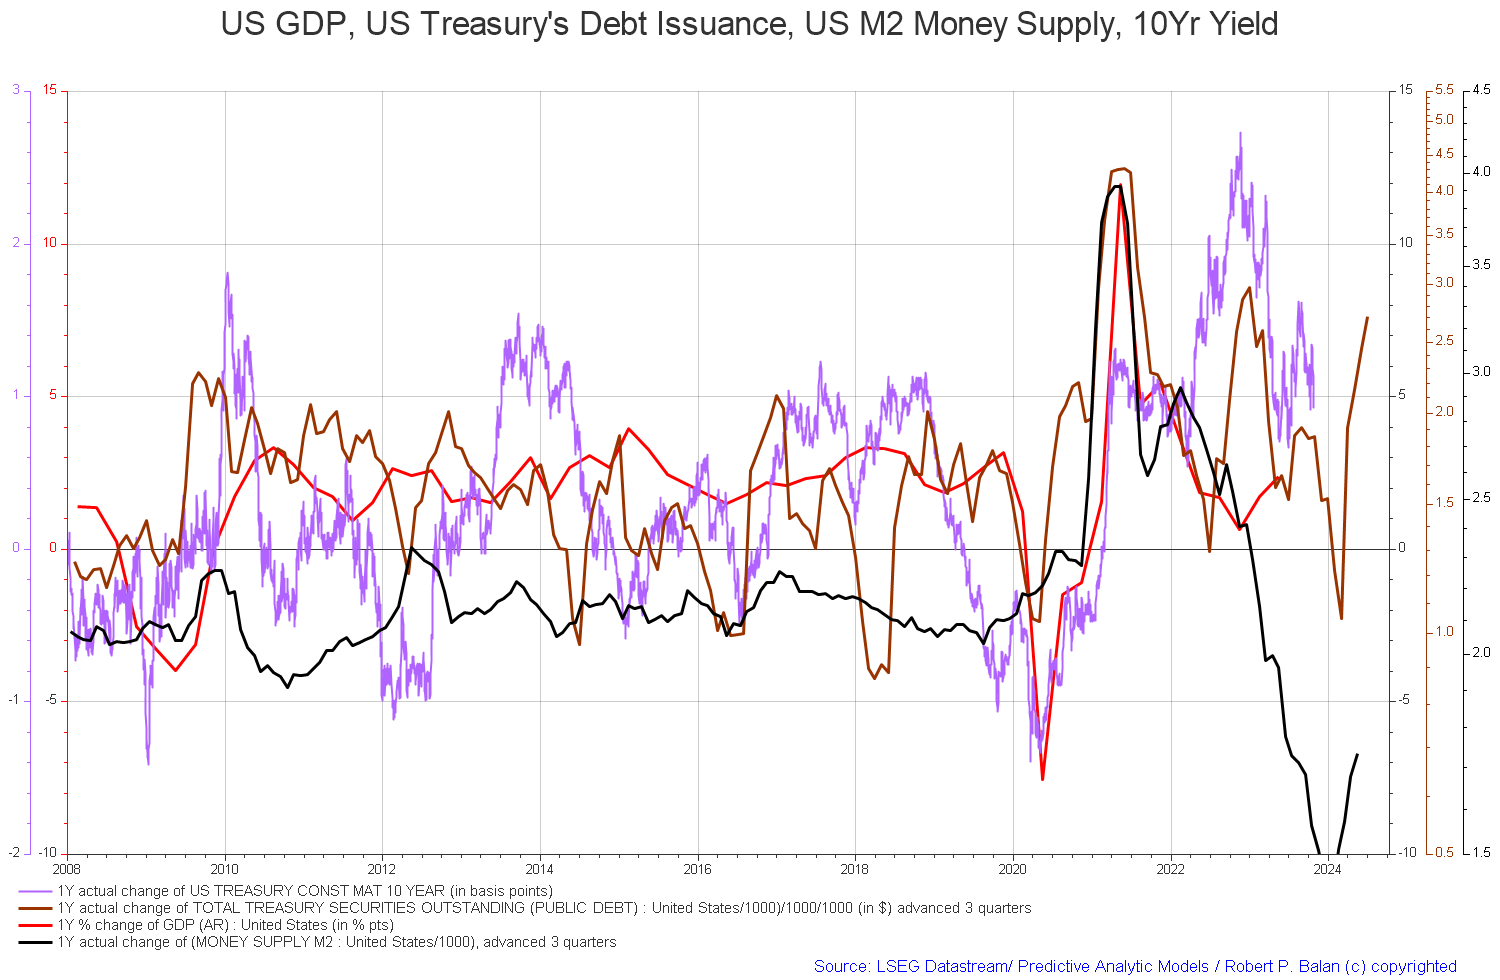
The chart above is similar to the one above it however shows the M2 money supply is now rising in tandem with the total amount of treasuries outstanding. A rising money supply is essential for a growing economy and rising asset markets and has been in effect now for at least two quarters.
If you are looking to make a market entry, sometime in the last quarter of 2023, or the first quarter of 2024 is likely to be a good time judging by the macro tidal forces that underpin the asset markets. The seasonal pattern and macro pattern are pointing to a strong Xmas/New Year rally and a good first quarter to 2024 for asset markets.
For further details see:
Private Domestic Sector Prints $113 Billion Surplus Pointing To Better Markets In October