SPHY - Q3 2023 Fixed Income Outlook: A Recession On The Horizon
2023-07-12 03:30:00 ET
Summary
- The high-yield sector offers attractive absolute and relative return prospects due to resilient corporate fundamentals.
- Consumers and labor market conditions remain on solid footing.
- Spreads have mostly widened from the end of 2022 through the end of March 2023.
With the likelihood of a recession growing, the landscape for fixed-income investors is shifting as we enter the third quarter of 2023.
1. After raising policy rates 500 basis points (bps) over sixteen months, the end of the Federal Reserve's hiking cycle is now within sight, shifting duration from a headwind to a tailwind.
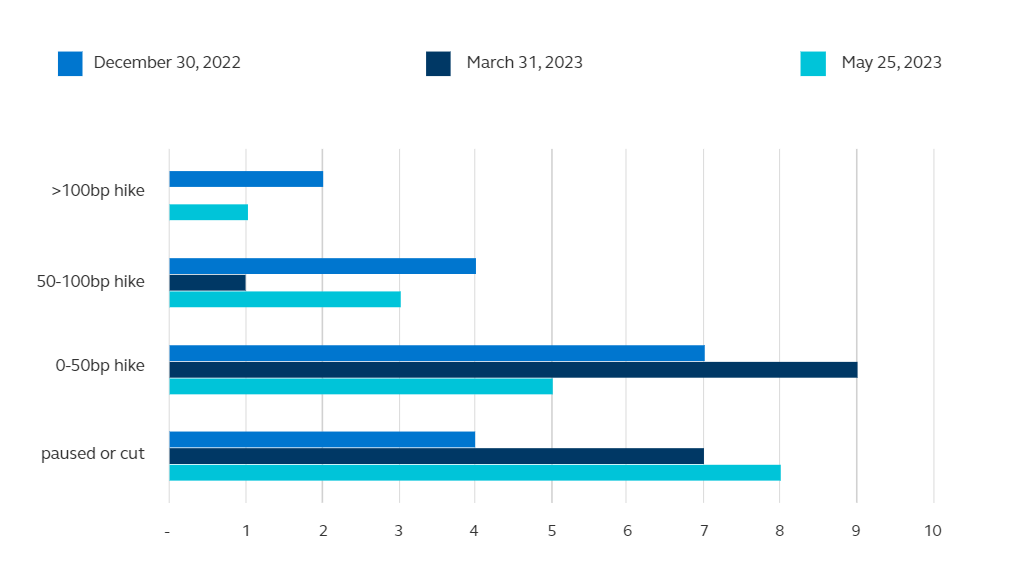
2. The forward-looking trend for global policymakers in aggregate has become clearer, with fewer hiking more, more hiking less, and some not hiking at all.
3. With several historically reliable economic indicators signaling that a recession is on the horizon, the stage is set for fixed income to perform well; particularly, high-quality assets.
Macro outlook
U.S.
Reflecting on our Q2 macro outlook, we anticipated that the Federal Reserve (Fed) was approaching the final stage of its hiking cycle based on improving inflation, slowing economic data, and "long and variable lags" in monetary policy. As the Fed moves into a pause phase, we look ahead to the long and variable lags. With the economy slowing, the labor market showing signs of better balance, generally resilient data, and gradually improving inflation, we find ourselves asking if the Fed will successfully engineer a soft landing to this cycle after all.
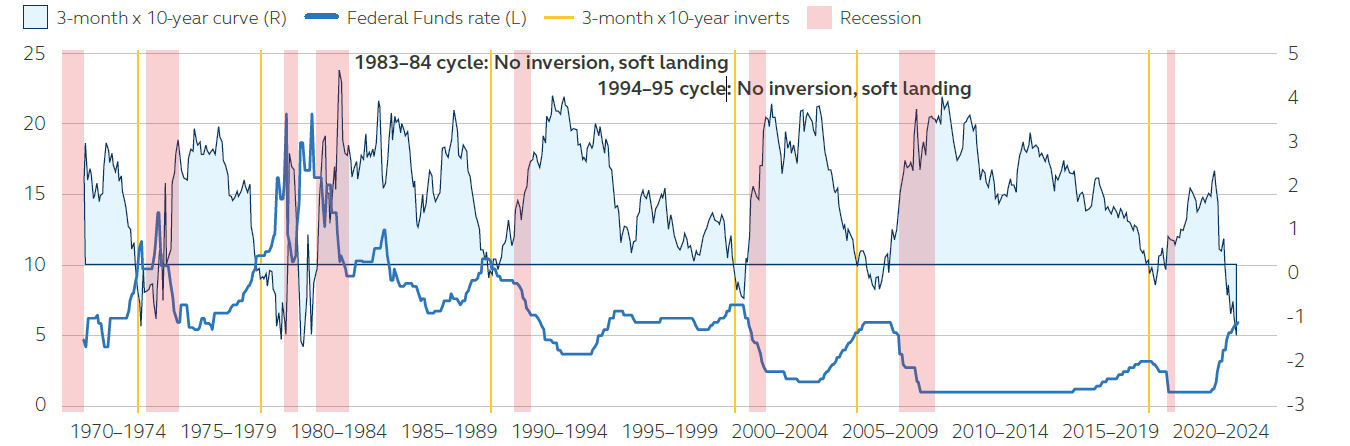
Perhaps the most reliable leading indicator of a recession is the yield curve or the difference between long- and short-maturity U.S. Treasury yields. As a recent research paper by the San Francisco Fed stated: "While economic forecasting is complex, one forecasting rule has an excellent track record: when short-term interest rates rise above the level of long-term rates, a recession almost invariably follows within the next year or two."[1] Exhibit 1 clearly demonstrates the predictive power of the yield curve, as measured by the 3-month vs. 10-year points in this case. Since 1970, only two of eight hiking cycles (the present cycle excluded) have ended with a soft landing. In both cases (1983-84 and 1994-95), the curve did not invert. An inversion in the 3-month vs. 10-year curve occurred in six of the eight cycles, and a recession followed each of those episodes. Not only is the 3-month vs. 10-year curve currently inverted, but it is also as deeply inverted as it has been in over forty years.
EXHIBIT 1
Power of the yield curve as measured by 3-month vs. 10-year curve
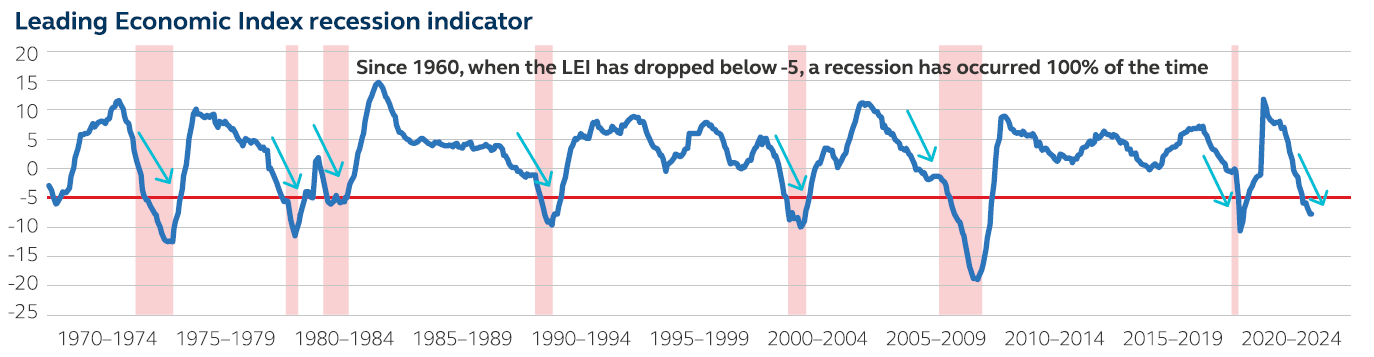
Another key recession indicator is the Conference Board's monthly Leading Economic Index ((LEI)). While the LEI utilizes a yield curve measure within its construction, it is only one of ten subcomponents along with labor, manufacturing new orders, stock indices, and other measures. As Exhibit 2 demonstrates, in each of the six times since 1970 that the LEI declined below -5, a recession has been underway or soon followed. The current level is -8.
EXHIBIT 2
Leading Economic Index recession indicator
While a soft landing cannot be completely ruled out, the confluence of leading recession indicators signaling an imminent slowdown suggests that a recession is a far more probable outcome in the near term.
Global
The trend for global policymakers in aggregate is clearer; compared to the two previous quarters, fewer are hiking more, and more are hiking less - or not hiking at all. Policymakers recognize that policy actions taken so far will continue to have lagged, uneven transmission effects on their economies. Further, the recent banking crisis likely accelerated the tightening of credit conditions, giving policymakers more reason for a period of observation. This coming observation period will buy time for a slowdown in underlying growth to be better reflected in the data.
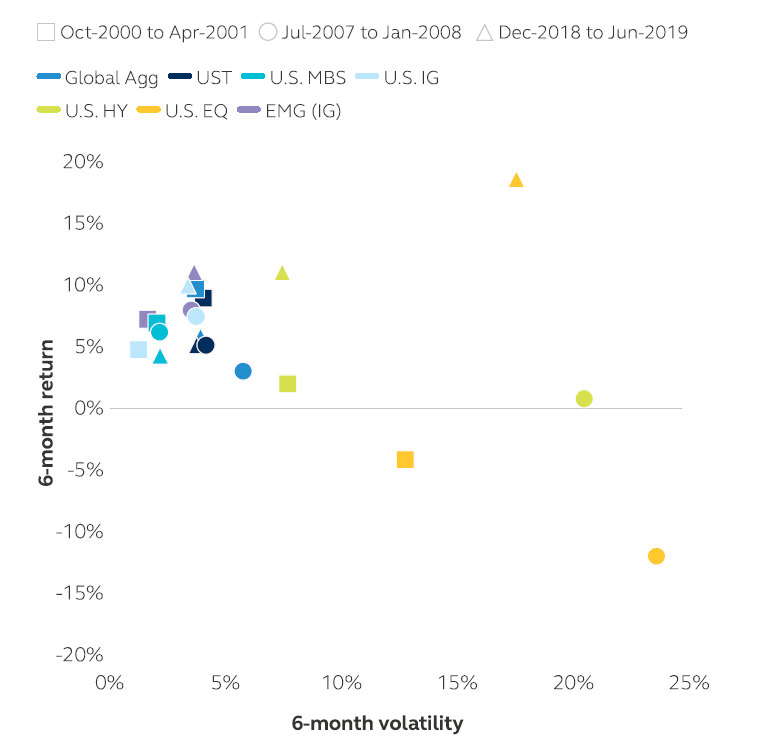
As monetary policy heads toward a pause, most asset classes will do well; however, historically, high-quality fixed income tends to deliver the most consistent returns on a risk-adjusted basis with lower variability (Exhibit 4). This is also consistent with the current observation that fixed income volatility has come down substantially since the March banking crisis. Attractive performance should continue well into the first-rate cuts, suggesting plenty of longevity for an overweight strategy in high-quality fixed income in this environment. It also provides ample compensation for near-term underperformance if the Fed reacts to upside surprises in the data with another hike.
It would be prudent to note that whilst most central banks are heading towards a pause, one major central bank is in a completely different part of the monetary policy cycle. The Bank of Japan (BOJ) has yet to tighten monetary policy, as they chose to remain patient given their long fight against deflation. However, conditions are ripening for further stimulus unwinding. Inflation and wage growth over the past few months are the highest in three decades. New BOJ Governor Kazuo Ueda's steadfastly dovish stance led to further weakness in the currency, approaching levels that will likely require intervention. Based on last December's experience when the yield curve control band was loosened, any policy adjustments in that direction tend to temporarily increase global yields, so it is important for investors to keep an eye on this risk event amidst the broader constructive environment.
EXHIBIT 3
Number of economies (G20) hiking interest rates
EXHIBIT 4
6-month risk-adjusted returns following a G3 pause
Indices represented: Global Agg: Bloomberg Global-Aggregate Total Return Index Value Unhedged USD; UST Bloomberg US Treasury Total Return Unhedged USD Index; U.S. MBS: Bloomberg US MBS Index Total Return Value Unhedged USD; U.S. IG: Bloomberg US Corporate Total Return Value Unhedged USD; U.S. HY: Bloomberg High Yield Total Return Index Value Unhedged USD; U.S. EQ: S&P 500 Ex-Information Technology Index; EMD ((IG)): J.P. Morgan EM Bond Index Global Diversified IG.
Summary of investment implications
Investment Grade Credit
Countervailing forces of weakening fundamentals and strengthening technicals are acting in tandem in the high-grade bond market. As the two forces play out, investment grade spreads will likely be rangebound.
High Yield Credit
While the second half of 2023 is unlikely to be a smooth ride for high yield, the asset class continues to present an attractive long-term risk/reward profile.
Securitized Debt
The investment outlook for short, high-quality consumer asset-backed securities is attractive. With consumer fundamentals normalizing and securitized debt structures exhibiting resilience, investors can potentially benefit from this investment theme while enjoying credit support.
Municipals
When measured versus Treasurys or investment-grade corporate debt, municipals offer an opportunity for tax-sensitive investors. A favorable technical backdrop should aid performance over the next several months.
Emerging Market Debt
Away from the epicenter of U.S. banking sector issues, emerging markets have traded relatively well in the context of the risk environment developed markets are facing. In the commodity-sensitive economies, growth will likely weaken from the strong 2022 rebound albeit with a fair amount of variation.
Private Credit
Over the coming quarter, market recessionary fears, persistently high inflation, and public market volatility may cause investors to pause when considering a new or incremental allocation to middle-market direct lending; however, we believe the loans originated during the upcoming period will deliver investors value.
Investment grade credit
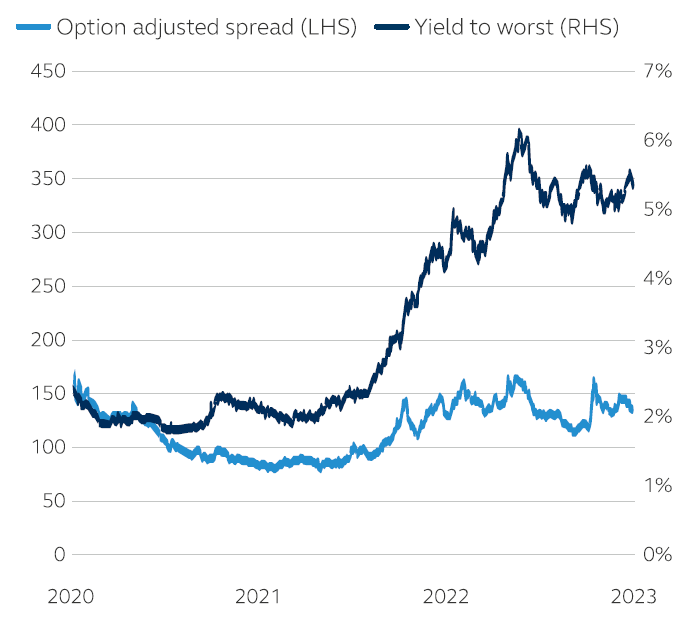
Just as bumper guards guide a bowling ball down the lane, today's corporate bond market finds its spreads in a similar state. On one side, recessionary headwinds appear with profit margins contracting, leverage levels coming off their lows, and consumers contending with higher rates, which may lead to lower discretionary spending - signs of which are already appearing. On the other side, yields and breakeven spread levels are attractive, supply may be slowing, corporate balance sheets remain solid, and investors' cash levels are high. Thus, we see countervailing forces of weakening fundamentals and strengthening technicals acting in tandem, guiding spreads away from the gutter. Absent any major macro or geopolitical event, the high-grade bond market may continue its recent rangebound pattern of toggling back and forth between the bumper guards.
Despite starting the year from a position of strength, fundamentals are now weakening. When compared to Q4 2022, Q1 2023 earnings showed companies' profit margins contracting with EBITDA margins dropping to 18.4% from 18.9%, gross/net debt rising, and gross leverage ticking up to 2.63x from 2.56x. Furthermore, we're seeing signs in some retailers' releases that consumers have slowed discretionary spending. Despite stubborn wage pressures persisting in the labor market, inflation remains in focus but has moderated. And with the Fed's diligent work to fight inflation - raising the policy rate 500 bps over sixteen months-we have seen prices abide as inflation somewhat cools. With all the new debt issued, it is more costly to borrow money in the corporate debt market, as the weighted average coupon of the index is 3.87% while the average cost of new debt issued is 5.26%.
For all the fundamental reasons spreads should drift wider, the case can be made on the technical side that they should remain anchored. With spreads in the mid-130s, breakeven levels of nearly 20 bps appear compelling. Yields topping 5.4% remain attractive for would-be investors, as 60% of institutional investment-grade buyers are yield-focused. Furthermore, a looming recession caused investors to stockpile cash, so there is plenty of it on the sidelines waiting to be deployed. Finally, the argument that limited supply may create its own demand comes into focus as we may see supply slow into the summer with some pulled-forward bond issuance. In fact, with nearly $150 billion in new supply issued in May, the year-on-year supply shortfall of nearly -20% a month ago closed to just -5% at the start of June. 2 The spigot for new bonds that remained wide open will likely see its flow slow.
In the end, it boils down to fundamentals on one side of the lane and technicals on the other. While the former is weakening, the latter is strengthening. As the two forces play out, investment grade ((IG)) spreads will likely bounce back and forth. Just as a bowler benefits from bumper guards, the bowling ball (representing spreads) will likely roll down the lane with the concurrent and opposing forces of fundamentals and technicals guiding it back to the center.
EXHIBIT 5
U.S. Corporate IG
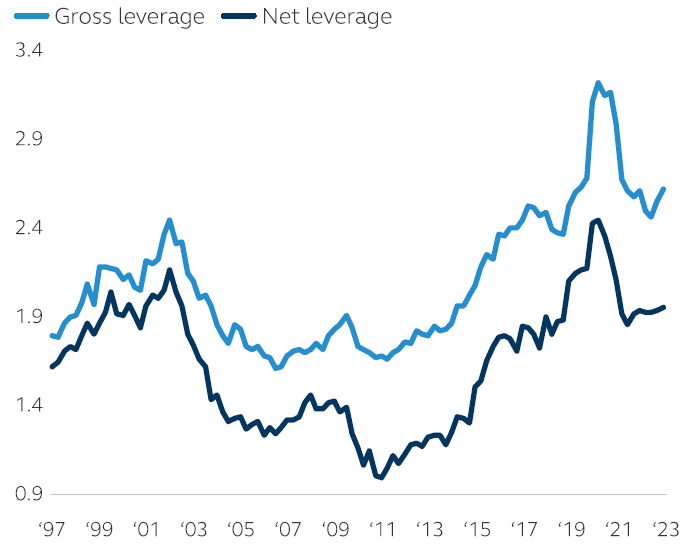
EXHIBIT 6
Median leverage: non-financial non-utility U.S. IG issuers
Gross leverage rose to 2.63x, net leverage increased modestly to 1.96x in Q1 20
Based on medians for U.S. investment grade non-financial non-utility issuers. 1Q23 values are preliminary. Net debt is gross debt minus cash and marketable securities. 2 As of May 31, 2023. Source: Bloomberg Fixed Income Indices and Barclays Research.
High yield credit
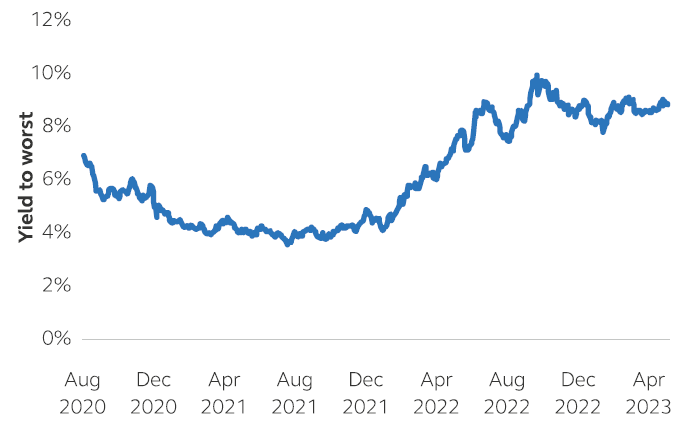
We are in a stage of slowing global economies, softer earnings, and rising defaults. Our base case scenario is for widening credit spreads in the high-yield market, but this shouldn't necessarily scare investors away from the asset class. In fact, the high-yield sector offers attractive absolute and relative return prospects due to resilient corporate fundamentals and, as we highlighted in our last quarterly outlook, high-yield leverage and interest coverage remain at their strongest levels historically. Although earnings have softened, most companies reported more beats than misses. According to JPMorgan, over 80% of companies gave neutral to positive guidance vs. expectations, implying confidence that companies can weather forthcoming macro headwinds. Even assuming we see only a modest spread widening, the elevated yield environment still generates attractive income and a reasonable total return (Exhibit 7).
EXHIBIT 7
U.S. Corporate High Yield 2% Issuer Cap Index
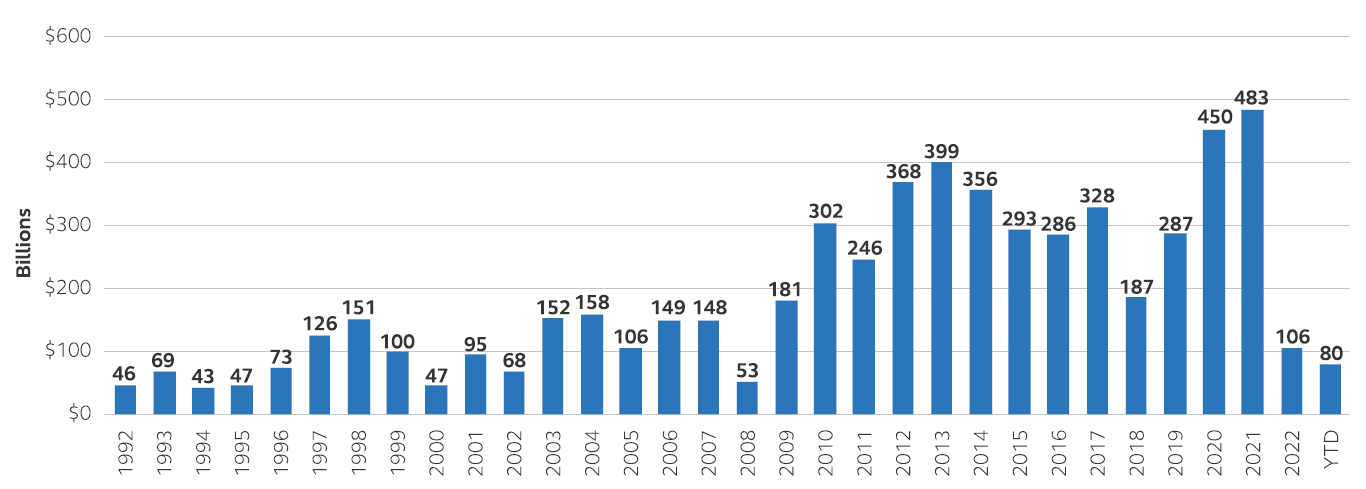
Another notable positive for the high-yield market is that issuers continue to have ready access to the new issue market. Although issuance in 2023 is below the historical average, it remains on track to rise well above 2022 levels (Exhibit 8). As of the end of May, there has already been close to $80 billion of issuance compared to $106 billion in 2022. The primary market remains healthy and willing to absorb refinancing debt as well as opportunistic acquisition financing. As we approached the end of Q2, we've seen deals where the proceeds were earmarked for acquisitions. Companies will face headwinds for a variety of reasons, but an inability to refinance will not likely be an issue for those not in secular decline.
Concerns - such as inflation, tighter central bank policy, and the potential for a global recession - remain, but issuer fundamentals and a receptive primary market provide support for high yield. Again, we expect spreads to slightly widen from current levels, but with the starting yield around 9%, there is still potential for attractive total returns for the rest of 2023. Volatility will persist in the high-yield sector, but at these levels and fundamentals, investors are not taking undue duration or credit risk. The asset class continues to present an advantageous long-term risk/reward profile.
EXHIBIT 8
Yearly high-yield issuance in billions
Securitized debt
U.S. agency mortgage-backed securities
The banking crisis in March 2023 had an unforeseen technical implication for agency mortgage-backed securities (MBS). Mortgage supply, which was improving dramatically due to lower/negative home price appreciation and reduced activity in the housing market, was suddenly forced to contend with $60 billion in MBS pass-throughs formerly held by Signature Bank and Silicon Valley Bank. The Federal Deposit Insurance Corporation (FDIC) took those assets into receivership and began a four-day per week auction process, providing a steady incremental supply of MBS for the foreseeable future. The good news is that the auction process has been met with very strong demand which should clear the supply much more rapidly than initially forecast.
Nevertheless, the change in technicals cheapened valuations with the current coupon spread to 5-year/10-year Treasurys near the highest level of the past decade. Recent technical pressure in the sector represents an opportunity for investors over the longer run. Agency MBS enjoys a government guarantee of credit risk, which should bode well if the economy slows into a recession in the coming quarters. Fundamentals remain strong with no refinancing risk based upon current rate levels and high implied interest rate volatility, which will be a tailwind for the sector thanks to reduced option costs if it normalizes.
Commercial mortgage-backed securities
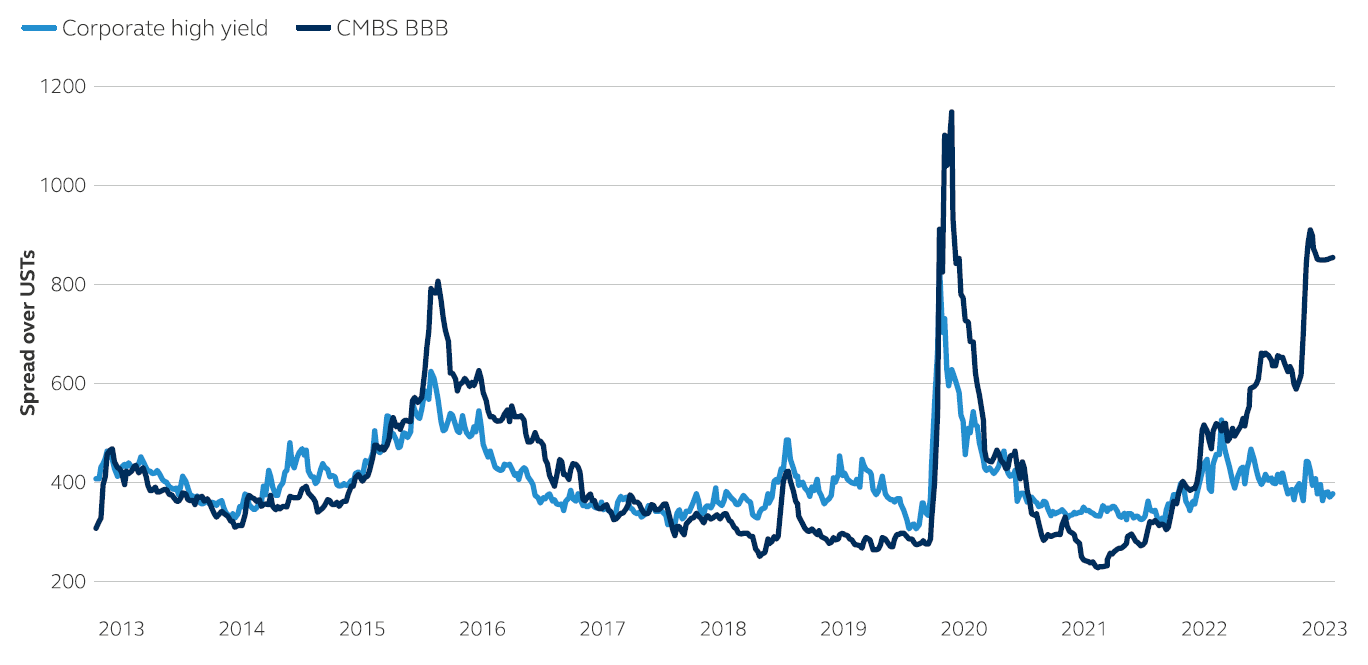
Commercial mortgage-backed securities ((CMBS)) continue to trade significantly wider than similarly-rated fixed-income alternatives, reflecting stress in the office sector and a potential pull-back in bank lending. Despite the negative headlines, CMBS credit risk is heavily weighted toward maturity as most fixed-rate loans originated over the past 10 years carry low-interest rates and high debt service coverage ratios supported by the income generated via diverse pools of properties, tenants, and lease terms. Investors are pricing in a high level of office stress alongside an elevated risk of recession, driving a dramatic disconnect between BBB CMBS and high-yield corporate spreads (Exhibit 9). With so much risk priced in, we believe opportunities exist for investors who can look deeper than the headlines and perform real estate-driven security selection. In the current market, we favor floating rate AAA bonds for defensive carry, fixed-rate AA/A and select BBB bonds based on relative value and the steepness of the credit curve, and interest-only STRIPS due to their shorter duration, high current yield, and portfolio diversification characteristics.
EXHIBIT 9
CMBS BBB and corporate high-yield spreads
As of May 30, 2023 (JPMorgan Dataquery, BofA Securities, Principal Real Estate)
CMBS: On-the-Run BBB Index. Corporates: J.P. Morgan Developed Market High Yield 7-10 Index. Y-axis truncated to preserve scale; CMBS BBB spread hit 1,152 in April 2020.
Asset-backed securities
Short, high-quality consumer asset-backed securities ((ABS)) offer a particularly attractive investment opportunity in the current market. The inverted yield curve and market technical factors have led to high benchmark yields and wide spreads, while prime consumer credit remains strong despite recent normalization. Importantly, expected credit trends remain well inside the performance envelope of ABS structures that have proven their resilience through multiple economic cycles. This combination of attractive pricing and solid starting fundamentals should result in enticing all-in, risk-adjusted yields even if economic conditions deteriorate in the second half of the year.
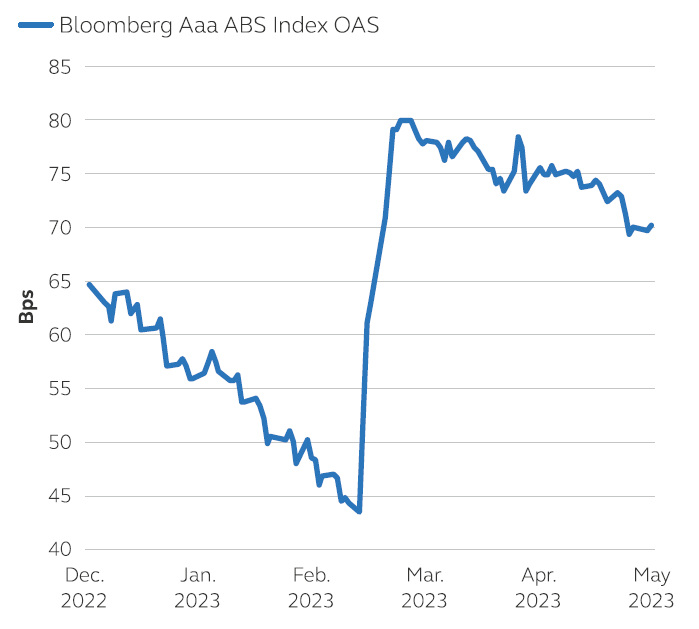
Banks typically comprise 12-14% of the ABS new issue investor base, and the U.S. regional banking crisis pushed spreads wider by approximately 35 bps (Exhibit 10). Their share dropped dramatically in the first quarter amid deposit flight, and ABS spreads widened with primary supply having to find new homes with asset managers. As banks look to issue new ABS backed by auto loans, credit cards, or other receivables that would have previously been financed with low-cost bank deposits, this supply-demand imbalance could be further stressed.
EXHIBIT 10
ABS spreads
Consumers and labor market conditions remain on solid footing. Prime credit has normalized post-pandemic, but delinquencies and defaults remain below pre-pandemic levels. Further normalization is expected given consumer headwinds, but tight post-Great Financial Crisis credit underwriting should keep performance in check. On the other hand, subprime credit has weakened more noticeably. Inflation has weighed on lower-income households, while delinquencies and defaults among riskier borrowers are now above pre-pandemic levels. As we move into more challenging economic conditions, we favor prime credit in well-structured deals from strong sponsors.
Municipals
With a U.S. debt default avoided in Q2, investors can once again pivot back to assessing the relative value proposition among various fixed-income sectors. We believe municipals when measured vs. Treasurys or investment-grade corporate debt, offer a compelling opportunity for tax-sensitive investors as we move into the second half of 2023.
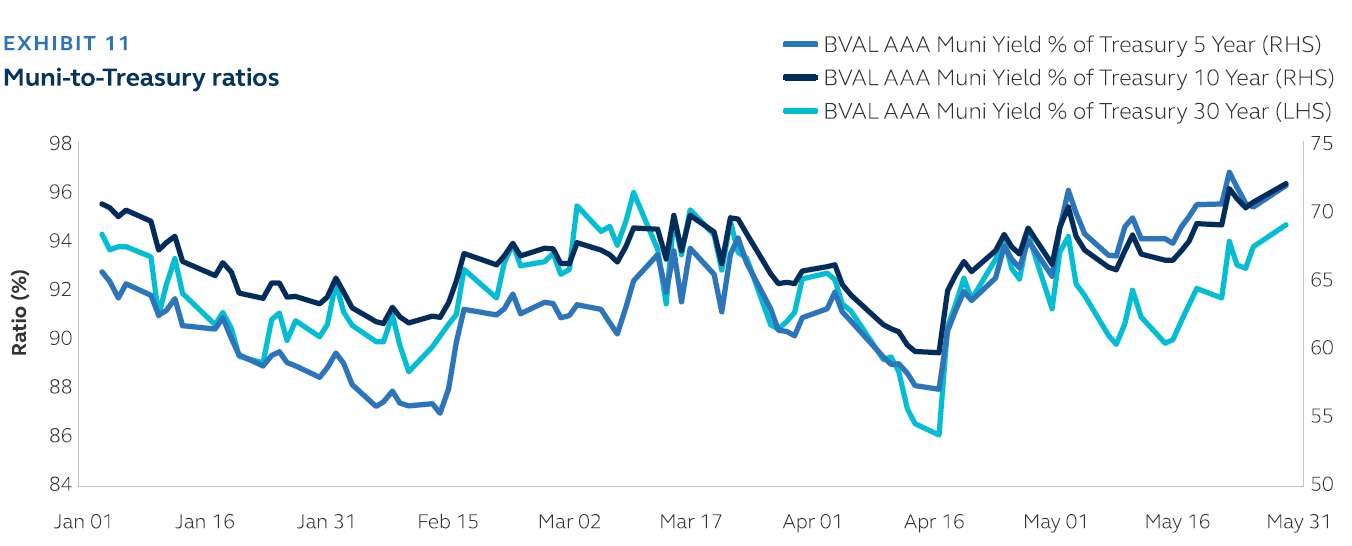
Relative to Treasurys, municipals are offering some of the most attractive entry points for several months. After falling to 55% in February, the 5-year municipal-to-Treasury ratio has risen to nearly 72% - the cheapest level in 2023. The 10-year municipal-to-Treasury ratio reflects a similar story - cheapening to 72% from a low of 60% recorded in mid-April (ratios are calculated by dividing the municipal yield by the Treasury yield at specific maturity points).
EXHIBIT 11
Muni-to-Treasury ratios
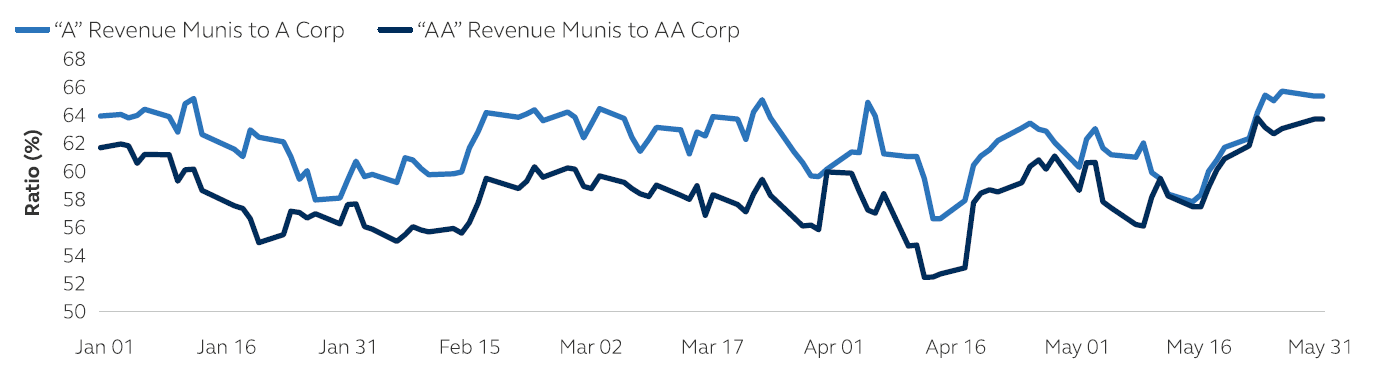
And the relative attractiveness of tax-exempt municipals is not limited to only Treasurys. The ratios of AA and A-rated municipals to similarly rated investment-grade corporate bonds have also risen. The AA municipal-to-corporates ratio currently stands at 64%, well off April 2023's high-water mark of 52%, while the A-rated ratio sits at 64%, a 2023 high.
EXHIBIT 12
Revenue Munis vs. Corporates
The favorable technical backdrop that frames the asset class gives us confidence that municipals will reverse recent cheapening and outperform over the next several months. The third quarter's cash flow coming back to investors is expected to be over $106 billion, the highest of any quarter in 2023. This number includes all bonds maturing over July to September along with previously announced bond calls as well as interest payments. At just $140 billion to date, new issue debt is trailing 2022's level by about 27% through the first six months of 2023.[2] July, August, and September are historically among the lowest months of the year in terms of supply, further providing a tailwind to municipal levels.
Emerging market debt
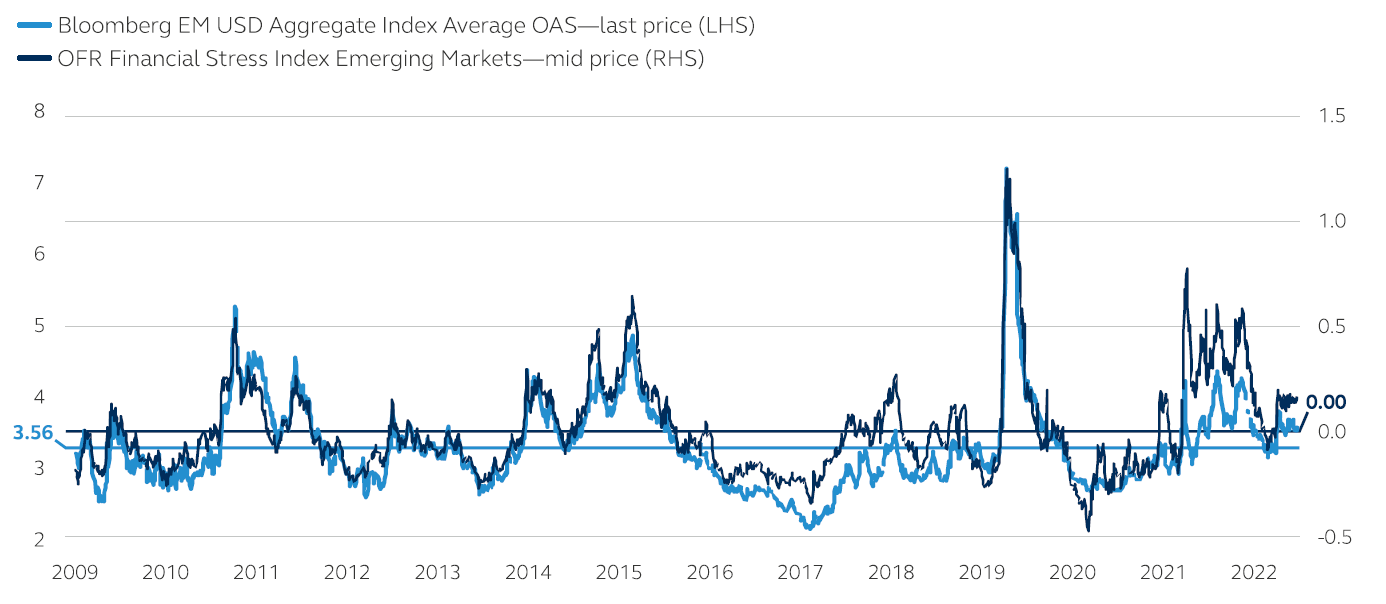
Away from the epicenter of U.S. banking sector issues, emerging market debt ((EMD)) has traded relatively well in the context of the risk environment faced by developed markets. Both financial stresses faced by the asset class and EMD aggregate spreads are trading slightly above long-term averages (Exhibit 13). Inflation in parts of the advanced economies remains sticky although the equilibrium between growth and inflation has become more balanced compared to last year. Inflation and growth in emerging markets ((EM)) have been more balanced as many EM central banks are nearing peak policy rates in this cycle and going into pausing mode although the cuts would be less forthcoming until the Fed can pivot into a more dovish stance.
While recovery is underway in China, momentum has lost steam relative to market expectations. Along with the new government and broader shifts in the economic structure, the lack of an immediate positive policy catalyst has made it more challenging for Chinese asset prices to find a strong basis for a clearer rebound. Inflation remains fairly muted, providing the central bank room to ease if needed. We see a gradual regulatory easing in some sectors such as technology and platform companies which will eventually be supportive of overall growth.
The moderating rebound in Chinese growth as well as the slowing growth in developed markets put pressure on commodities. In the commodity-sensitive economies in emerging markets, growth will likely weaken from the strong 2022 rebound albeit with a fair amount of variation. While crude has remained above longer-term averages, slowing global growth may drive oil-producing economies in EM to face the headwind combination of lower oil prices and OPEC+ quota restrictions. Metal-exporting sovereigns, primarily those in Latin America that have been heavily reliant on buoyant Chinese demand, may also face challenges as cost inflation, lower ore grades, and lower prices reduce export revenues. In the medium term, however, Latin America is home to some of the world's largest reserves of copper and lithium, two metals that are critical in the renewable energy transition. Agricultural producers may find themselves in the most advantageous position in 2023 as food demand grows and Russia/Ukraine-related supply constraints remain in place. Overall, EM commodity producers that make the adjustments to focus less on hard commodity-related infrastructure and more on domestic consumption will be more suited to adapt to China's rebalancing of its economy.
EXHIBIT 13
EM financial stress and spreads are trading just above long-term averages
Private credit
Though public markets continued their year-end rally into 2023, opportunities remain attractive for investors in middle market private credit.
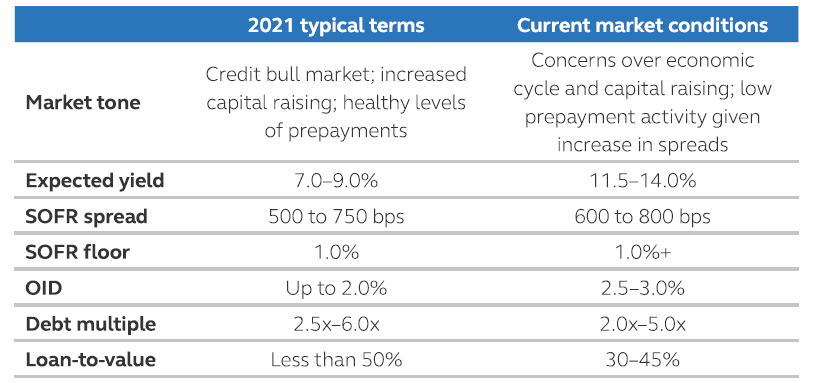
With an uncertain macro environment and less stable credit conditions, it's important for direct lenders to be diligent and assess the actual underlying credit risk of prospective borrowers as well as overlaying expectations for more challenging economic conditions. Coincidingly, public credit markets are being revalued on liquidity, sentiment, and a potential Fed pivot. Private credit lenders are focused on more resilient industries and borrowers while requiring relatively low leverage on newly originated transactions along with tighter credit terms and attractive pricing for investors. This has led to fewer loan origination for the year compared to 2022.
EXHIBIT 14
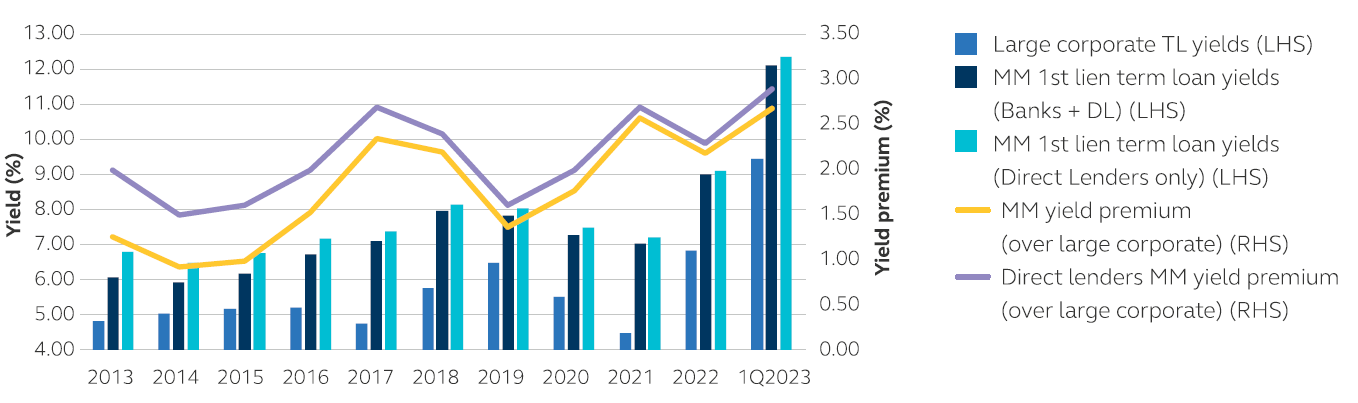
Over the coming quarters, recessionary fears, high inflation, and public market volatility may cause investors to pause when considering an allocation to middle-market direct lending; however, we believe the loans originated during the current and upcoming period will deliver value. The combination of lower valuations, lenders reducing hold sizes, and higher borrowing costs has made larger deals more challenging in the current market. In addition to lenders being very selective, private equity sponsors are pursuing financing for companies they expect to realize attractive financial performance through more challenging economic conditions. Having less cyclical industry exposure and generally lower leverage than the public market, the private middle market should offer the opportunity for attractive absolute/relative performance, as has been the case during many prior economic cycles and periods of market volatility.
EXHIBIT 15
1st lien term loan (TL) yield and middle market ((MM)) yield premium, annual
Above are the current views and opinions of Principal Global Investors and are not intended to be nor should they be relied upon in any way as a forecast or guarantee of future events regarding particular investments or the markets in general.
Investment-grade private credit
In investment-grade private credit, the number of deals to date is on pace with prior years with flow volume expected to continue at that pace in Q3. Tightened lending standards by regional banks could prove favorable to deal volume, though most IG private placement issuers do not use the regional/super-regional banks, relying instead on the too-big-to-fail lenders that are currently on solid footing. There has been a marked decrease in infrastructure and project deals vs. 2022 and 2021, most likely due to the high competition private placements see from banks for the financing of projects and infra-acquisition. Relative value over public comps is more than double the long-term average with significant relative value coming from alternative asset managers and fund-level borrowers. Spreads have mostly widened from the end of 2022 through the end of March 2023. With expectations for the severity of a recession diminishing and the debt ceiling bill passed, we may start to see some compression in relative value in Q3, but enough uncertainty remains that any impact should be minimal. After a strong start of the year by median and entertainment issuers (e.g., national U.S. sports leagues), Q2 issuance has been led by technology, food and beverage, and natural gas borrowers. We are expecting to see a good mix of issuers in the second half of the year.
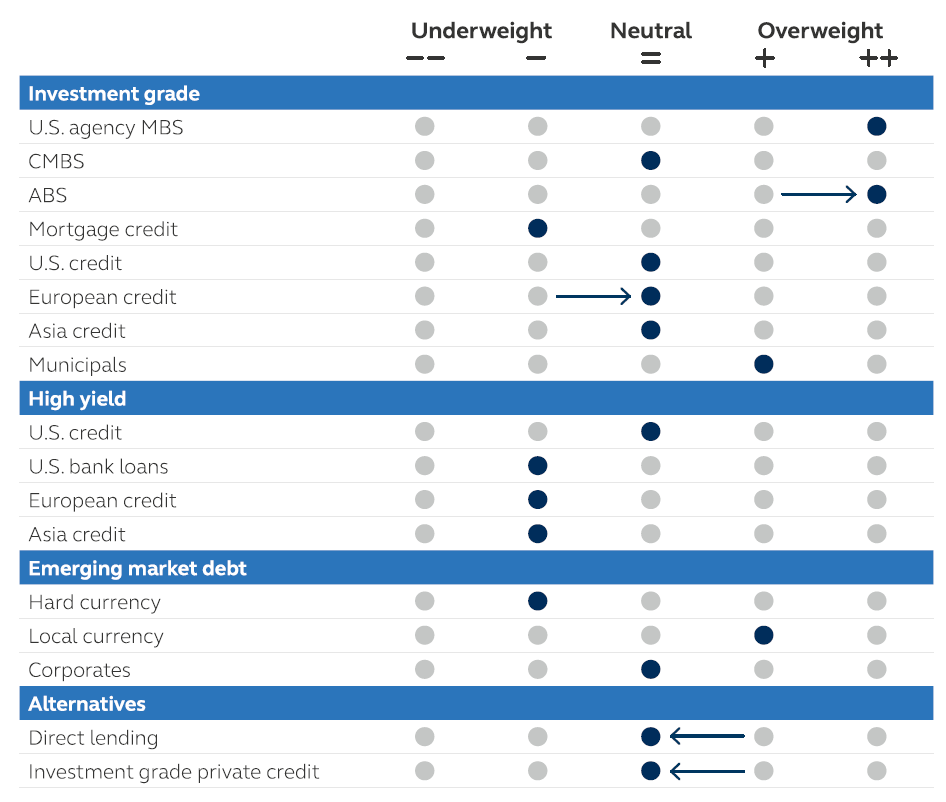
Forward-looking sector views
As of June 30, 2023. The above views reflect the relative value of the sectors shown based on forward-looking return expectations over the next 12 months. Arrows represent the quarter-over-quarter change in forward-looking views.
Conclusion
With moderating inflation, a resilient labor market, and slowing economic data, we anticipate central bank policy, on balance, to shift away from aggressive action toward a period of measured observation. This shift in posture will likely afford time for a slowdown in underlying growth to be better reflected in data while testing policymakers as they attempt to sidestep a recession. With several historically reliable economic indicators suggesting that a recession is imminent, we believe a soft-landing is improbable and a recession in 2023-2024 remains our base case scenario.
This sets the stage for fixed income to deliver attractive results for investors across a range of asset classes in Q3. Including high-quality fixed income, which tends to deliver the most consistent returns on a risk-adjusted basis with lower volatility ahead of and within the early stages of a recessionary period.
Principal Fixed Income: A leading global fixed-income platform
Principal Fixed Income is the fixed-income investment management platform of Principal Asset Management and manages US $137.4 billion in assets under management as of March 31, 2023. Principal Fixed Income has capabilities that span all major fixed-income sectors. Our globally integrated platform with investment centers worldwide and over 110 investment professionals, helps to directly access global fixed-income markets and deliver a diversity of investment perspectives. Our structure and proprietary investment tools foster collaboration across sector-specialty teams, whether the sector is explicitly integrated into a portfolio or not. In our view, this diversity of insight helps each sector-specialty team formulate richer investment theses and make better-informed investment decisions on behalf of our clients.
Investment Strategy Group
The creation of the fixed income outlook is a collaborative effort led by the Principal Fixed Income Investment Strategy Group. The Investment Strategy Group is comprised of the senior-most investment professionals from across the platform and is responsible for identifying key macroeconomic factors that are most likely to drive investment performance across global fixed-income markets. Output from the Investment Strategy Group is formalized through Principal's proprietary Macro Risk Outlook framework and informs investment processes across the platform, acting as a top-down complement to the platform's bottom-up fundamental research capability.
Investment Strategy Group members
Risk considerations
Investing involves risk, including possible loss of principal. Past Performance does not guarantee a future return. All financial investments involve an element of risk. Therefore, the value of the investment and the income from it will vary and the initial investment amount cannot be guaranteed. Fixed?-income investment options are subject to interest rate risk, and their value will decline as interest rates rise. Potential investors should be aware that Investment grade corporate bonds carry credit risks, default risk, liquidity risks, currency risks, operational risks, legal risks, counterparty risk and valuation risks. Lower-rated securities are subject to additional credit and default risks. Fixed-income investment options that invest in mortgage securities, such as commercial mortgage-backed securities, are subject to increased risk due to real estate exposure. Emerging market debt may be subject to heightened default and liquidity risk. International investing involves greater risks such as currency fluctuations, political/ social instability, and differing accounting standards. Private credit involves an investment in non-publicly traded securities that are subject to illiquidity risk. Portfolios that invest in private credit may be leveraged and may engage in speculative investment practices that increase the risk of investment loss. Investments in Private Credit may also be subject to real estate-related risks, which include new regulatory or legislative developments, the attractiveness, and location of properties, the financial condition of tenants, potential liability under environmental and other laws, as well as natural disasters and other factors beyond a manager's control.
Asset allocation and diversification do not ensure a profit or protect against a loss.
Important information
This material covers general information only and does not take account of any investor's investment objectives or financial situation and should not be construed as specific investment advice, a recommendation, or be relied on in any way as a guarantee, promise, forecast or prediction of future events regarding an investment or the markets in general. Information presented has been derived from sources believed to be accurate; however, we do not independently verify or guarantee its accuracy or validity. Any reference to a specific investment or security does not constitute a recommendation to buy, sell, or hold such investment or security, nor an indication that the investment manager or its affiliates has recommended a specific security for any client account. Subject to any contrary provisions of applicable law, the investment manager and its affiliates, and their officers, directors, employees, agents, disclaim any express or implied warranty of reliability or accuracy and any responsibility arising in any way (including by reason of negligence) for errors or omissions in the information or data provided.
This material may contain `forward-looking' information that is not purely historical in nature and may include, among other things, projections, and forecasts. There is no guarantee that any forecasts made will come to pass. Reliance upon information in this material is at the sole discretion of the reader.
All figures shown in this document are in U.S. dollars unless otherwise noted. All assets under management figures shown in this document are gross figures, before fees, transaction costs, and other expenses and may include leverage unless otherwise noted. Assets under management may include model-only assets managed by the firm, where the firm has no control as to whether investment recommendations are accepted, or the firm does not have trading authority over the assets.
Index performance information reflects no deduction for fees, expenses, or taxes. Indices are unmanaged and individuals cannot invest directly in an index.
This document is intended for use in:
• The United States by Principal Global Investors, LLC, which is regulated by the U.S. Securities and Exchange Commission.
• Europe by Principal Global Investors (Ireland) Limited, 70 Sir John Rogerson's Quay, Dublin 2, D02 R296, Ireland. Principal Global Investors
(Ireland) Limited is regulated by the Central Bank of Ireland. Clients that do not directly contact with Principal Global Investors (Europe) Limited ("PGIE") or Principal Global Investors (Ireland) Limited ("PGII") will not benefit from the protections offered by the rules and regulations of the Financial Conduct Authority or the Central Bank of Ireland, including those enacted under MiFID II. Further, where clients do contract with PGIE or PGII, PGIE or PGII may delegate management authority to affiliates that are not authorised and regulated within Europe, and in any such case, the client may not benefit from all protections offered by the rules and regulations of the Financial Conduct Authority, or the Central Bank of Ireland. In Europe, this document is directed exclusively at Professional Clients and Eligible Counterparties and should not be relied upon by Retail Clients (all as defined by the MiFID).
• United Kingdom by Principal Global Investors (Europe) Limited, Level 1, 1 Wood Street, London, EC2V 7 JB, registered in England, No. 03819986, which is authorized and regulated by the Financial Conduct Authority ("FCA").
• This document is marketing material and is issued in Switzerland by Principal Global Investors (Switzerland) GmbH.
• United Arab Emirates by Principal Global Investors LLC, a branch registered in the Dubai International Financial Centre and authorized by the Dubai Financial Services Authority as a representative office and is delivered on an individual basis to the recipient and should not be passed on or otherwise distributed by the recipient to any other person or organisation.
• Singapore by Principal Global Investors (Singapore) Limited (ACRA Reg.No. 199603735H), which is regulated by the Monetary Authority of Singapore and is directed exclusively at institutional investors as defined by the Securities and Futures Act 2001. This advertisement or publication has not been reviewed by the Monetary Authority of Singapore.
• Australia by Principal Global Investors (Australia) Limited (ABN 45 102 488 068, AFS Licence No. 225385), which is regulated by the Australian Securities and Investments Commission and is only directed at wholesale clients as defined under Corporations Act 2001.
• Hong Kong SAR (China) by Principal Asset Management Company (Asia) Limited, which is regulated by the Securities and Futures Commission. This document has not been reviewed by the Securities and Futures Commission.
• Other APAC Countries/Jurisdictions. This material is issued for Institutional Investors only (or professional/sophisticated/qualified investors, as such term may apply in local jurisdictions) and is delivered on an individual basis to the recipient and should not be passed on, used by any person or entity in any jurisdiction or country where such distribution or use would be contrary to local law or regulation.
Principal Global Investors, LLC ((PGI)) is registered with the U.S. Commodity Futures Trading Commission (CFTC) as a commodity trading advisor (CTA), a commodity pool operator (CPO), and is a member of the National Futures Association (NFA). PGI advises qualified eligible persons (QEPs) under CFTC Regulation 4.7.
Principal Asset Management? is a trade name of Principal Global Investors, LLC.
Principal Fixed Income is an investment team within Principal Global Investors.
© 2023 Principal Financial Services, Inc. Principal®, Principal Financial Group®, Principal Asset Management, and Principal and the logomark design are registered trademarks and service marks of Principal Financial Services, Inc., a Principal Financial Group company, in various countries around the world and may be used only with the permission of Principal Financial Services, Inc.
[1] Current Recession Risk According to the Yield Curve
[2] As of May 31, 2023. Source: Bloomberg.
Editor's Note: The summary bullets for this article were chosen by Seeking Alpha editors.
For further details see:
Q3 2023 Fixed Income Outlook: A Recession On The Horizon