XYLD - QYLD: Can It Keep The Lights On?
2023-10-17 10:17:52 ET
Summary
- QYLD is a popular ETF with $7.79 billion AUM, focusing on the Nasdaq-100 and offering a monthly dividend yield of 11.89% TTM.
- QYLD has outperformed XYLD and RYLD with an average annual return of approximately 6.18% adjusted for inflation.
- While QYLD provides a high yield, it's better suited as an alternative to cash investments at this time rather than a primary income source due to income erosion relative to inflation.
Thesis
Global X NASDAQ 100 Covered Call ETF (QYLD) is a popular exchange-traded fund, or ETF, with a high dividend yield attractive to income and dividend investors. QYLD may be better than cash investments but is not a good enough investment for those looking to live off the distribution income.
Fund Strategy & Performance
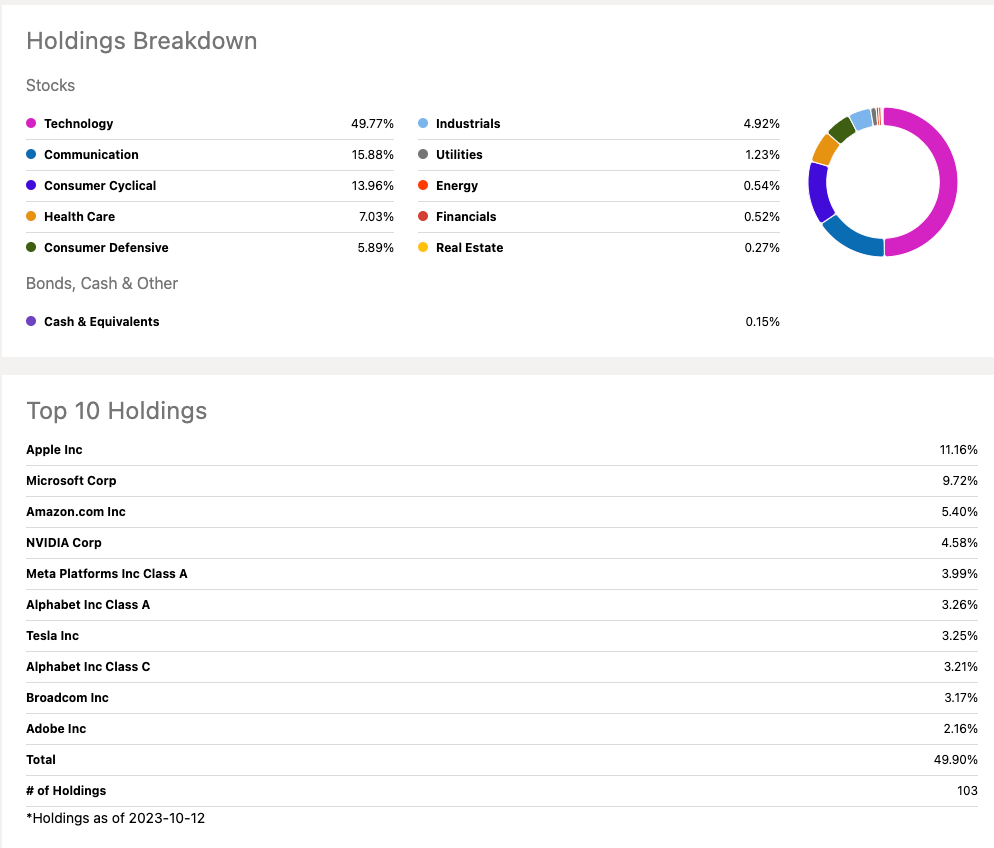
QYLD hardly needs an introduction in the income and dividend investing world. It is by far the most popular covered call ETF, with $7.79B AUM. QYLD holds the underlying companies of the NASDAQ 100 and pays a monthly dividend yielding 11.89% TTM. Cousin to the Global X S&P 500 Covered Call ETF (XYLD) and the Global X Russell 2000 Covered Call ETF (RYLD), which all employ an at-the-money buy-write strategy :
The Global X Nasdaq 100 Covered Call ETF (QYLD) follows a "covered call" or "buy-write" strategy, in which the Fund buys the stocks in the Nasdaq 100 Index and "writes" or "sells" corresponding call options on the same index.
While XYLD and RYLD focus on the US Large Cap and Small Cap indices respectively, QYLD focuses on the Nasdaq-100 is a stock market index made up of 101 equity securities issued by 100 of the largest non-financial companies. It utilizes an at-the-money (ATM) covered call approach to generate earnings, involving the sale of at-the-money call options on either a portion or the entirety of the stocks held in its portfolio. By selling these call options, QYLD collects premiums from the purchasers, and these funds received through cash settlements are subsequently distributed as dividends or distributions to the fund's investors.
The fund calculates its monthly distribution by choosing the smaller of two options: 1% of the Net Asset Value ((NAV)) or 50% of the options premium. Any extra premium is reinvested back into the fund to help maintain or increase the NAV. When the fund sells call options on its holdings, it limits potential gains because it commits to selling the underlying assets at a preset price if the options are exercised. This strategy strikes a balance between generating income and preserving growth potential.
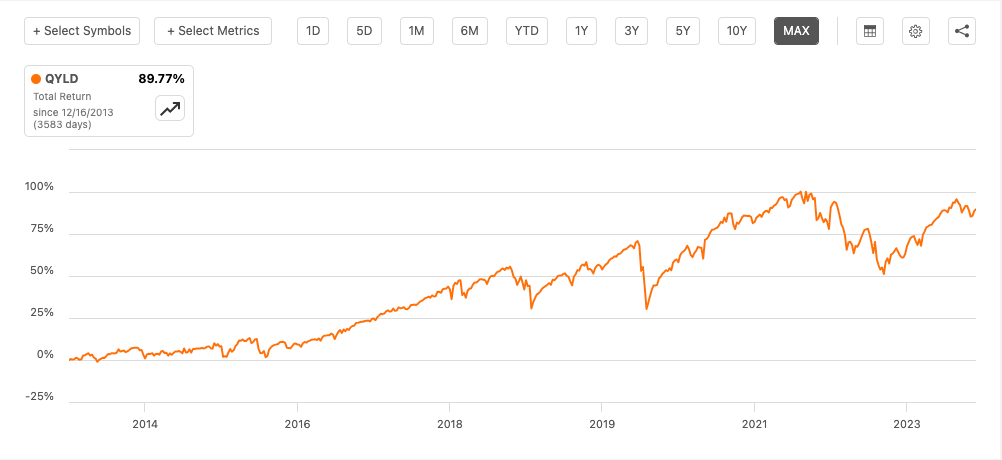
Since its inception in December 2013, QYLD has had a total return of ~90%. Adjusted for 2.82% inflation from 2013 to 2023 , it's about a 6.18% average annual total return.
QYLD Total Return (Seeking Alpha)
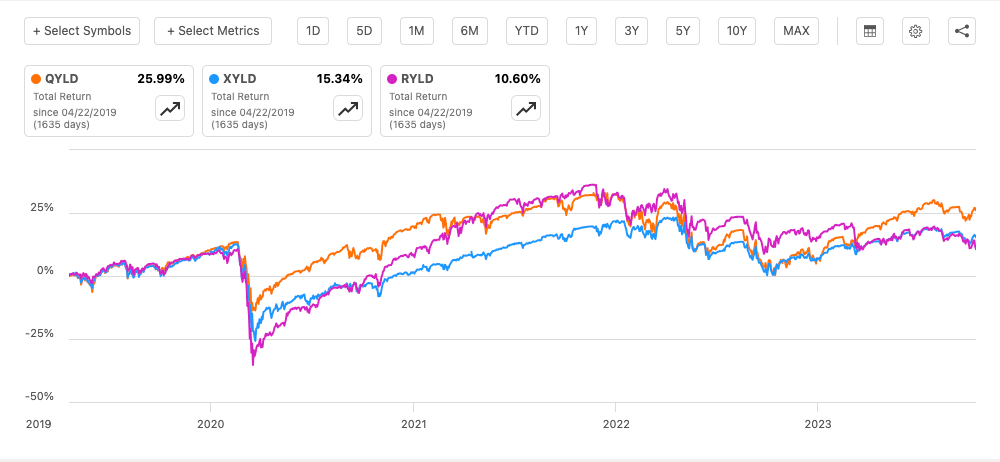
Compared to XYLD and RYLD since RYLD's inception in April 2019, QYLD has outperformed in terms of total return by a significant margin: 10% more than XYLD and 2.5X more total return than RYLD.
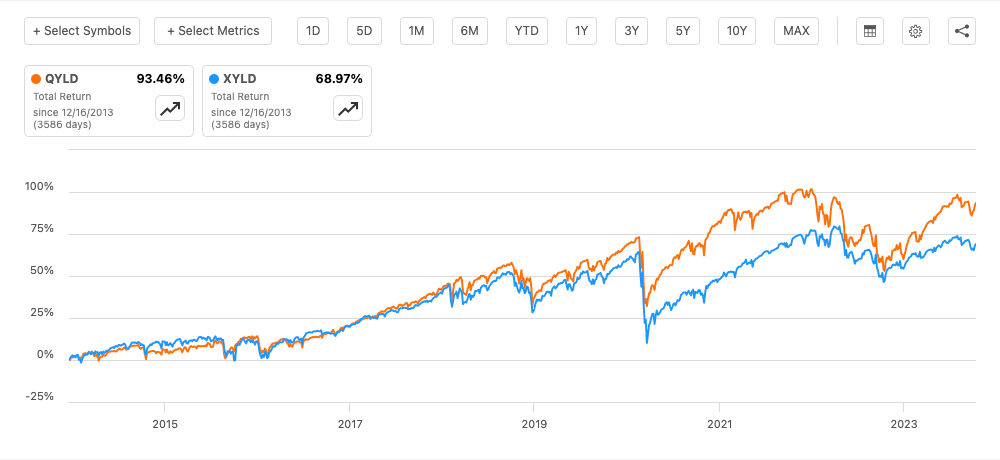
For a more time-tested view looking further back comparing QYLD and XYLD with almost 10 years of data, QYLD also outperforms XYLD: ~93.5% vs. 69%, about 25% better.
It's clear thus far that the ATM strategy has yielded the best results for QYLD, but is the best-performing YLD fund a viable strategy to serve your income needs?
Can QYLD Keep The Lights On?
With its consistently high yield typically exceeding 10%, a fund like QYLD seems to offer an excellent opportunity to create cash flow for investors with less-than-ideal retirement balances. Using Portfolio Visualizer and adjusting for inflation across the board, let's compare QYLD and classic S&P500 4% SWR approach for someone looking to cover their core living expenses for the last 10 years. Core living expenses or "forever" expenses as I call them are things like: food, property taxes, insurance premiums, energy, water, internet bills, etc. For me, this amounts to about $2000/month. Let's assume it was this much back in 2014 for simplicity. We'll use $600,000 as the initial investment since this would justify using an S&P500 proxy, SPY, in this case, to utilize the 4% rule:
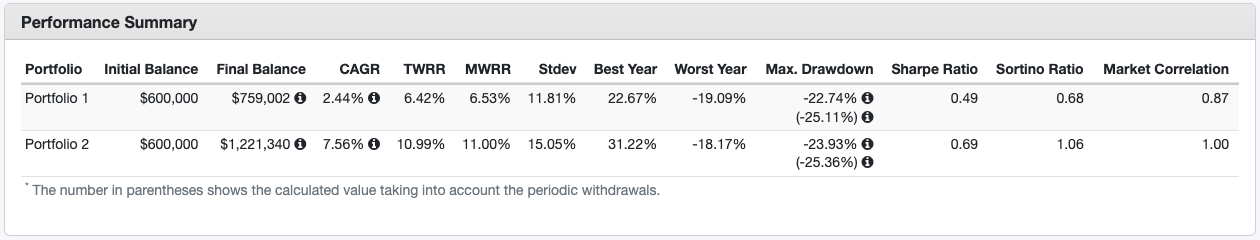
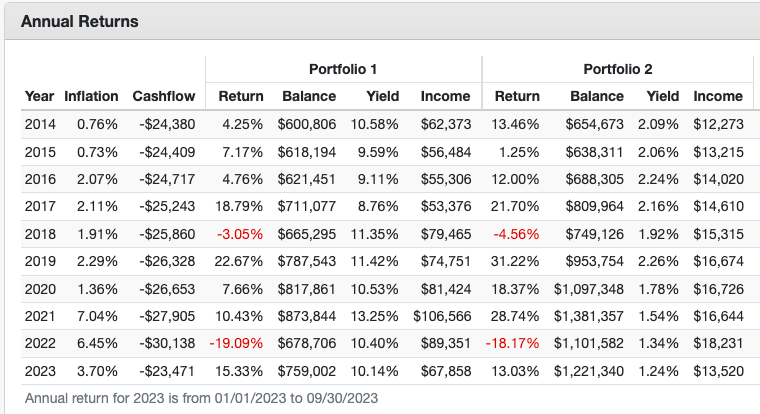
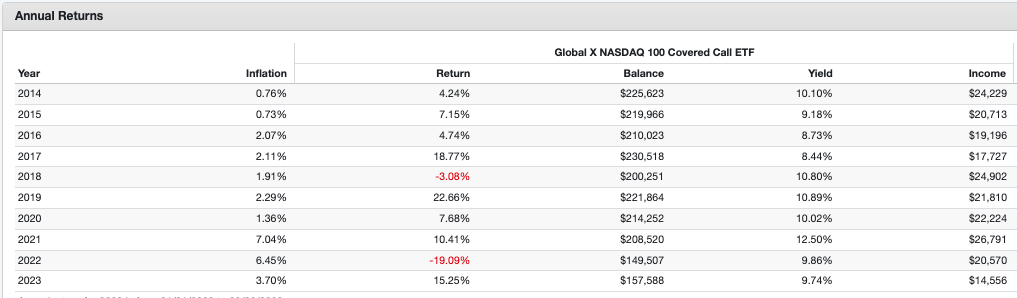
QYLD vs. SPY Performance Summary (Portfolio Visualizer) QYLD vs. SPY Annual Returns (Portfolio Visualizer)
Portfolio 1 is QYLD and Portfolio 2 is SPY. We start with $600,000 to cover the core expenses of $2000/month. Notice the "Cashflow" column adjusts for inflation of said expenses. We ended up with a significant difference in portfolio balance: $1.2M vs. $759k in 2023. QYLD also had a -0.44% inflation-adjusted CAGR vs. SPY's 4.54%.
Why QYLD has struggled: It has lost 32.45% of its price since inception, which directly affects the payouts. This means that even though the income goes up, you need to reinvest a significant portion to sustain the withdrawal to counteract the price decline and preserve capital. Remember, we had a 6.18% average total return. Take off about 3% for inflation and essentially 4% for the income needed to pay the bills and we are sitting at a negative return to date.
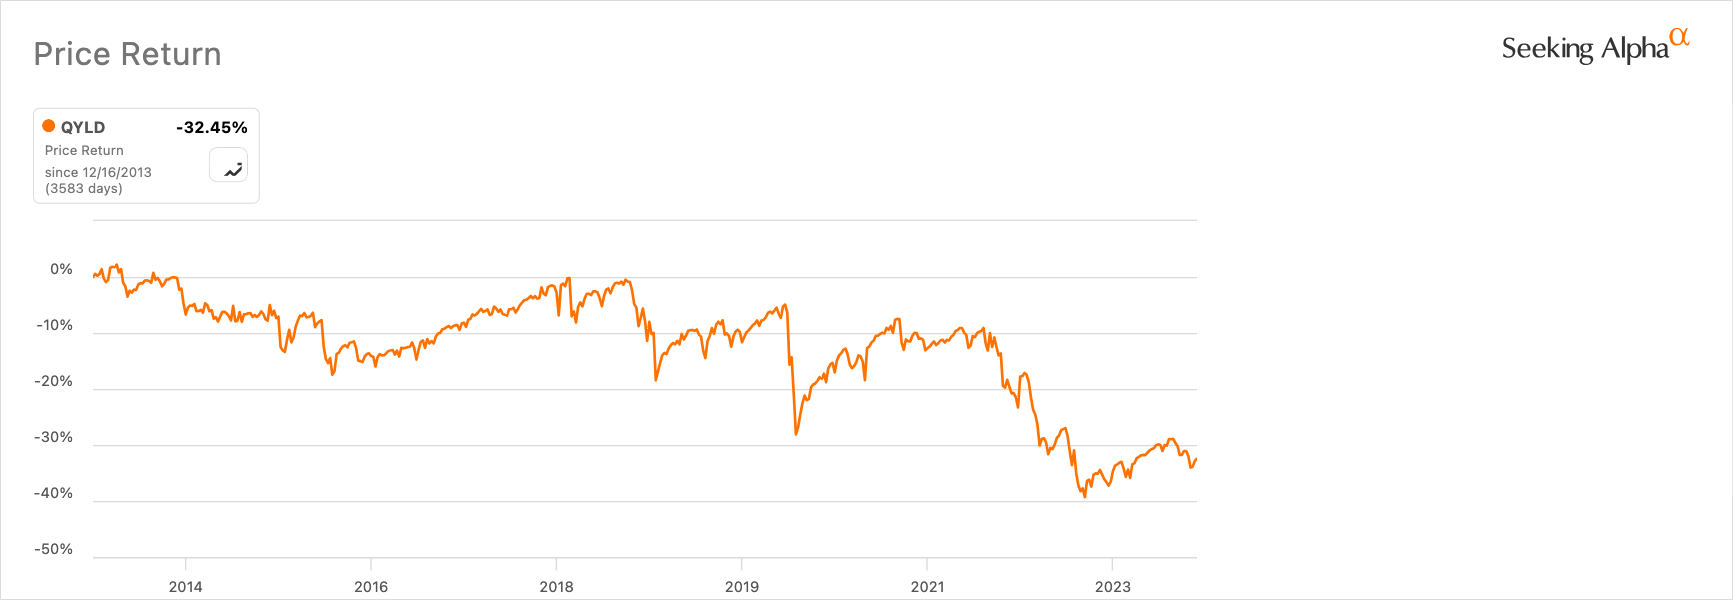
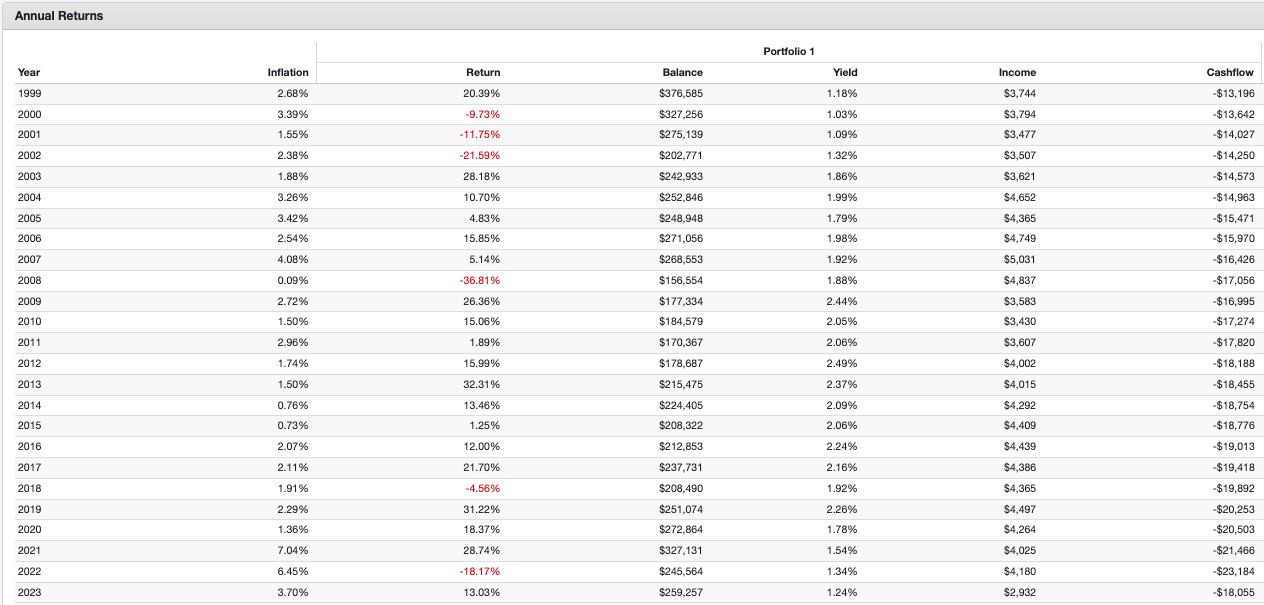
One backtest alone does not conclude you should not invest in QYLD over SPY. Let's look at SPY entering into the 2000s , one of the worst decades for the S&P500. Let's adjust the core living expenses for the inflation of 1999, so about $325k with a $1082/month withdrawal:
SPY 4% SWR 1999-2023 Performance Summary (Portfolio Visualizer)
Had you decided to pay the bills this way in 1999, you'd have a -3.40% inflation-adjusted CAGR, so maybe not a viable strategy either. We can cherry-pick backtest data all day to make a case for either fund. Look at QYLD leading into 2021. It was doing great, delivering six-figure income but the second you stop reinvesting dividends, that nice income will erode due to the price decline. In this last example, just look at QYLD not reinvesting dividends, just to try to pay that $2000/mo. using about exactly what you need, $240,000:
240k QYLD without dividends reinvested (Portfolio Visualizer)
The first year you're able to pay the bills, but you'll never be able to again after that when you adjust for inflation. This is the problem with QYLD, how do you ever get a raise? We need the price to be stable or increase ever so slowly in order to keep up with inflation and have a fixed-income like return.
Risk Analysis
Investing in QYLD is a great way to create high cash flow with significantly less capital than a traditional S&P500 fund but it does come with several risks to be wary of:
- Underlying asset depreciation
- Underlying volatility changes
- Strategy Deployment
Like any other ETF, the prices of the underlying companies affect the NAV and QYLD is no exception. Recall, QYLD pays out about 1% of NAV per month or 50% of the options premiums, whichever is less. So, if the NAV falls due to the underlying prices falling, so do the payouts. Short or prolonged periods, such as the 2022 bear market, the dot com bust in the 2000s, or sustained decline in the NASDAQ could cause the fund to lag inflation, losing investors money and hurting your ability to pay your bills.
Similarly, since the distribution income is derived from the options premiums, the premiums can also decline in value, causing the yield to go down but not necessarily the NAV. One of the main variables options premiums are based on is correlated to the VIX or volatility index. The higher the volatility of the underlying stocks, or price movements, the more the options contracts, especially ATM, are worth. This goes both ways, if there's a period of months or even years where the VIX is low, the options contracts won't be worth as much.
Last, as already illustrated, QYLD probably shouldn't be deployed as a fixed-income asset at this point. I would recommend QYLD as an alternative to cash investments like high-yield savings or CDs which certainly have underperformed . It may be that QYLD does return closer to its original NAV which would completely change the return profile should we enter a more flat market in the coming years. To be fair, QYLD has already experienced three sharp declines since inception, perhaps it just needs to breathe for another year or so and see if the original NAV can be restored. Let's see.
Forward-Looking Sentiment
Longterm, I'd like to see if QYLD is capable of delivering a consistent inflation-beating return solely to pay the bills. At least for SPY, we know there have been times this is not true over a more than 20-year period, which is scary. If you're retiring in 2024, you have no idea 20 years from now if a 4% SWR on your index fund will be sustainable. Between inflation and keeping the lights on, neither is negotiable, so we need either a higher yield, but we can't control volatility, or a more stable NAV moving forward. Total Returns need to be above 7% on average to stay viable for living off the asset. If you lose 1% yield for a 2% gain in price stability year over year you're still earning 1% more, and I think that's lost on its fund managers. This fund cannot be used for income until the market or better yet, strategy, changes. For now, I see QYLD as a good alternative as a cash investment until you're ready to deploy that cash elsewhere to keep the lights on.
For further details see:
QYLD: Can It Keep The Lights On?