QYLD - QYLD Or RYLD? There's A Better Idea
2023-09-14 17:03:51 ET
Summary
- Many income investors are familiar with Global X Russell 2000 Covered Call ETF and Global X NASDAQ 100 Covered Call ETF.
- Both funds currently provide ~12% dividend yields, paid monthly.
- This article will analyze why such yields are not as attractive as they appear on the surface.
- Macroscopic parameters such as high interest rates and low volatility index are likely to cause a decline in payouts.
- A fund with a more reasonable valuation and better price appreciation potential such as RYLG is better in my view under current conditions.
Thesis
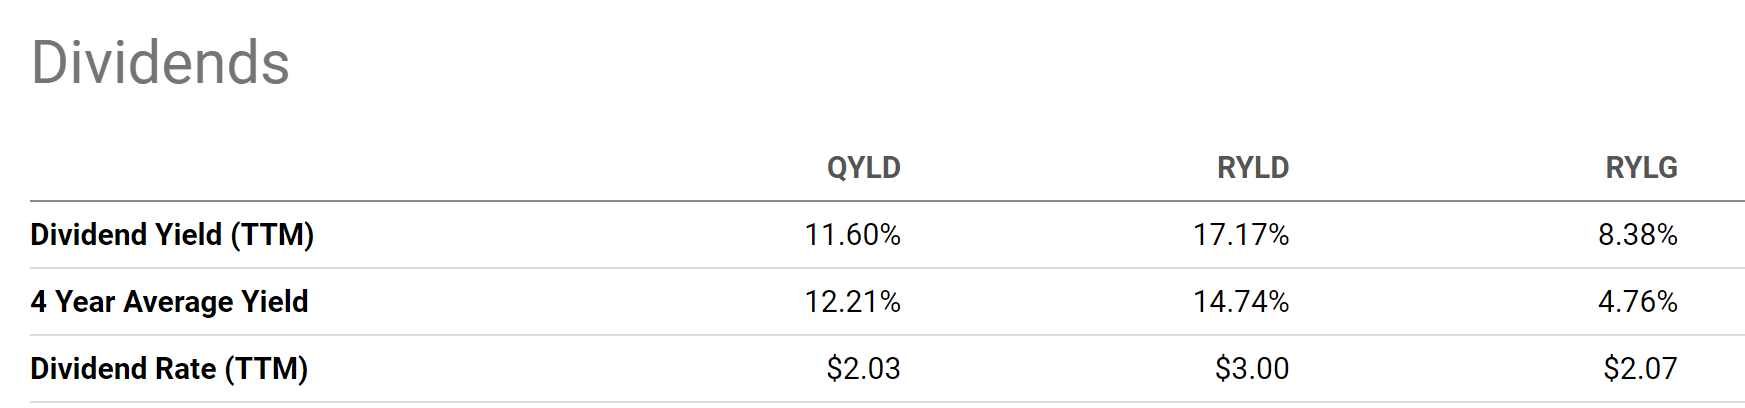
The Global X Russell 2000 Covered Call ETF ( RYLD ) and the Global X NASDAQ 100 Covered Call ETF ( QYLD ) are two popular funds among income-oriented investors. Both QYLD and RYLD provide a TTM dividend yield of around 12%. And a quick note - I do not know why RYLD's TTM dividend yield was reported to be 17.17% on Seeking Alpha's database. It is close to 12% as quoted on the fund's webpage .
Against this backdrop, the purpose of this article is twofold. First, I want to caution potential investors about the risks. Their current yields are not as high as they seem on the surface. As such, I am concerned that a 12% yield may not be enough to compensate for the underlying risks and result in lagging total returns. Second, I will explain why Global X Russell 2000 Covered Call & Growth ETF is a better option in my mind given current conditions. The RYLD fund only uses part of its assets to cover the call options. This feature, when combined with the valuation gap between small caps and the NASDAQ 100 Index (NDX), offers better total appreciation potential in my view.
RYLD and QYLD: Basic information
Both RYLD and QYLD use a covered-call strategy to generate monthly income for investors. As described in their fund descriptions:
QYLD: The Global X Nasdaq 100 Covered Call ETF ((QYLD)) follows a "covered call" or "buy-write" strategy, in which the Fund buys the stocks in the Nasdaq 100 Index and "writes" or "sells" corresponding call options on the same index.
RYLD: The Global X Russell 2000 Covered Call ETF (RYLD ) follows a "covered call" or "buy-write" strategy, in which the Fund buys the stocks in the Russell 2000 Index (at times by exposure to the Vanguard Russell 2000 ETF), and "writes" or "sells" corresponding call options on the Russell 2000 Index.
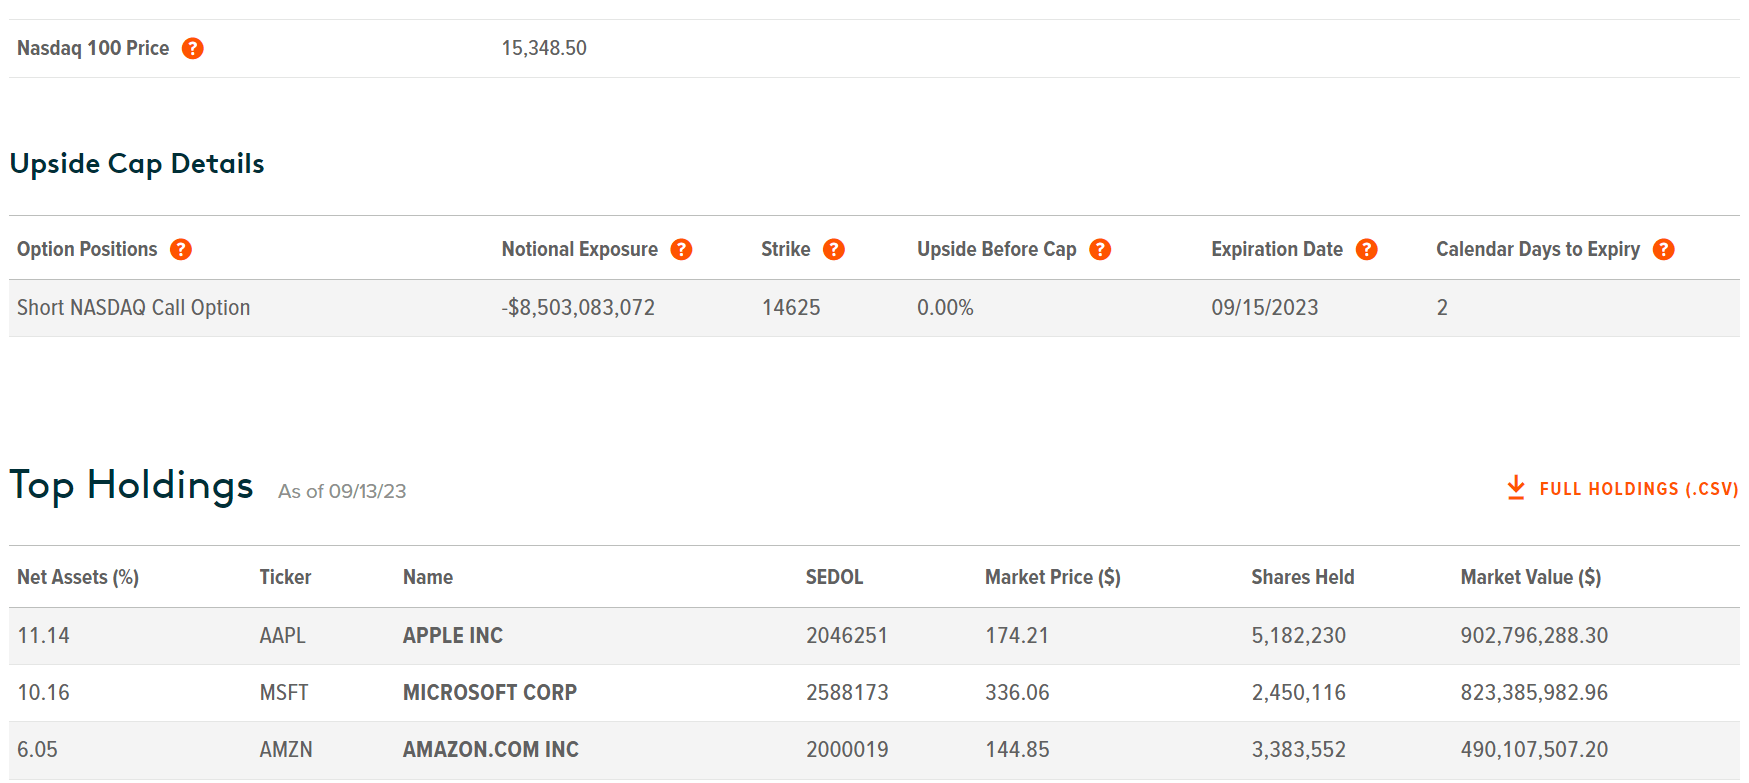
Moreover, both funds use close to 100% of their underlying assets to cover calls. As seen from the first chart below, QYLD holds a short NASDAQ Call Option with a notional exposure of $8.5B, a little more than the fund's current net asset of about $8.1B. Similarly, as seen from the 2nd chart below, RYLD holds a short Russell 2000 Call Option with a notional exposure of $1.5B, almost exactly the same as the fund's current net asset of about $1.5B. Such a strategy maximizes their income potential at the cost of price appreciation potential. And I will explain next why this is a non-optimal strategy under current conditions.
Interest rates, dividend yield, and option premium
A key reason for my above view involves the role of interest rates. Risk-free rates (I will use the 10-year treasury rates here) have been hovering above 4% for the most part of 2023 and reached as high as ~4.4%. Moreover, such elevated interest rates could persist longer. In the recent Jackson Hole symposium, the Fed Reserve reiterated its firm stance to fight inflation. And the latest CPI data for August just showed that consumer prices climbed up by the largest amount in more than a year (largely due to gasoline price increases).
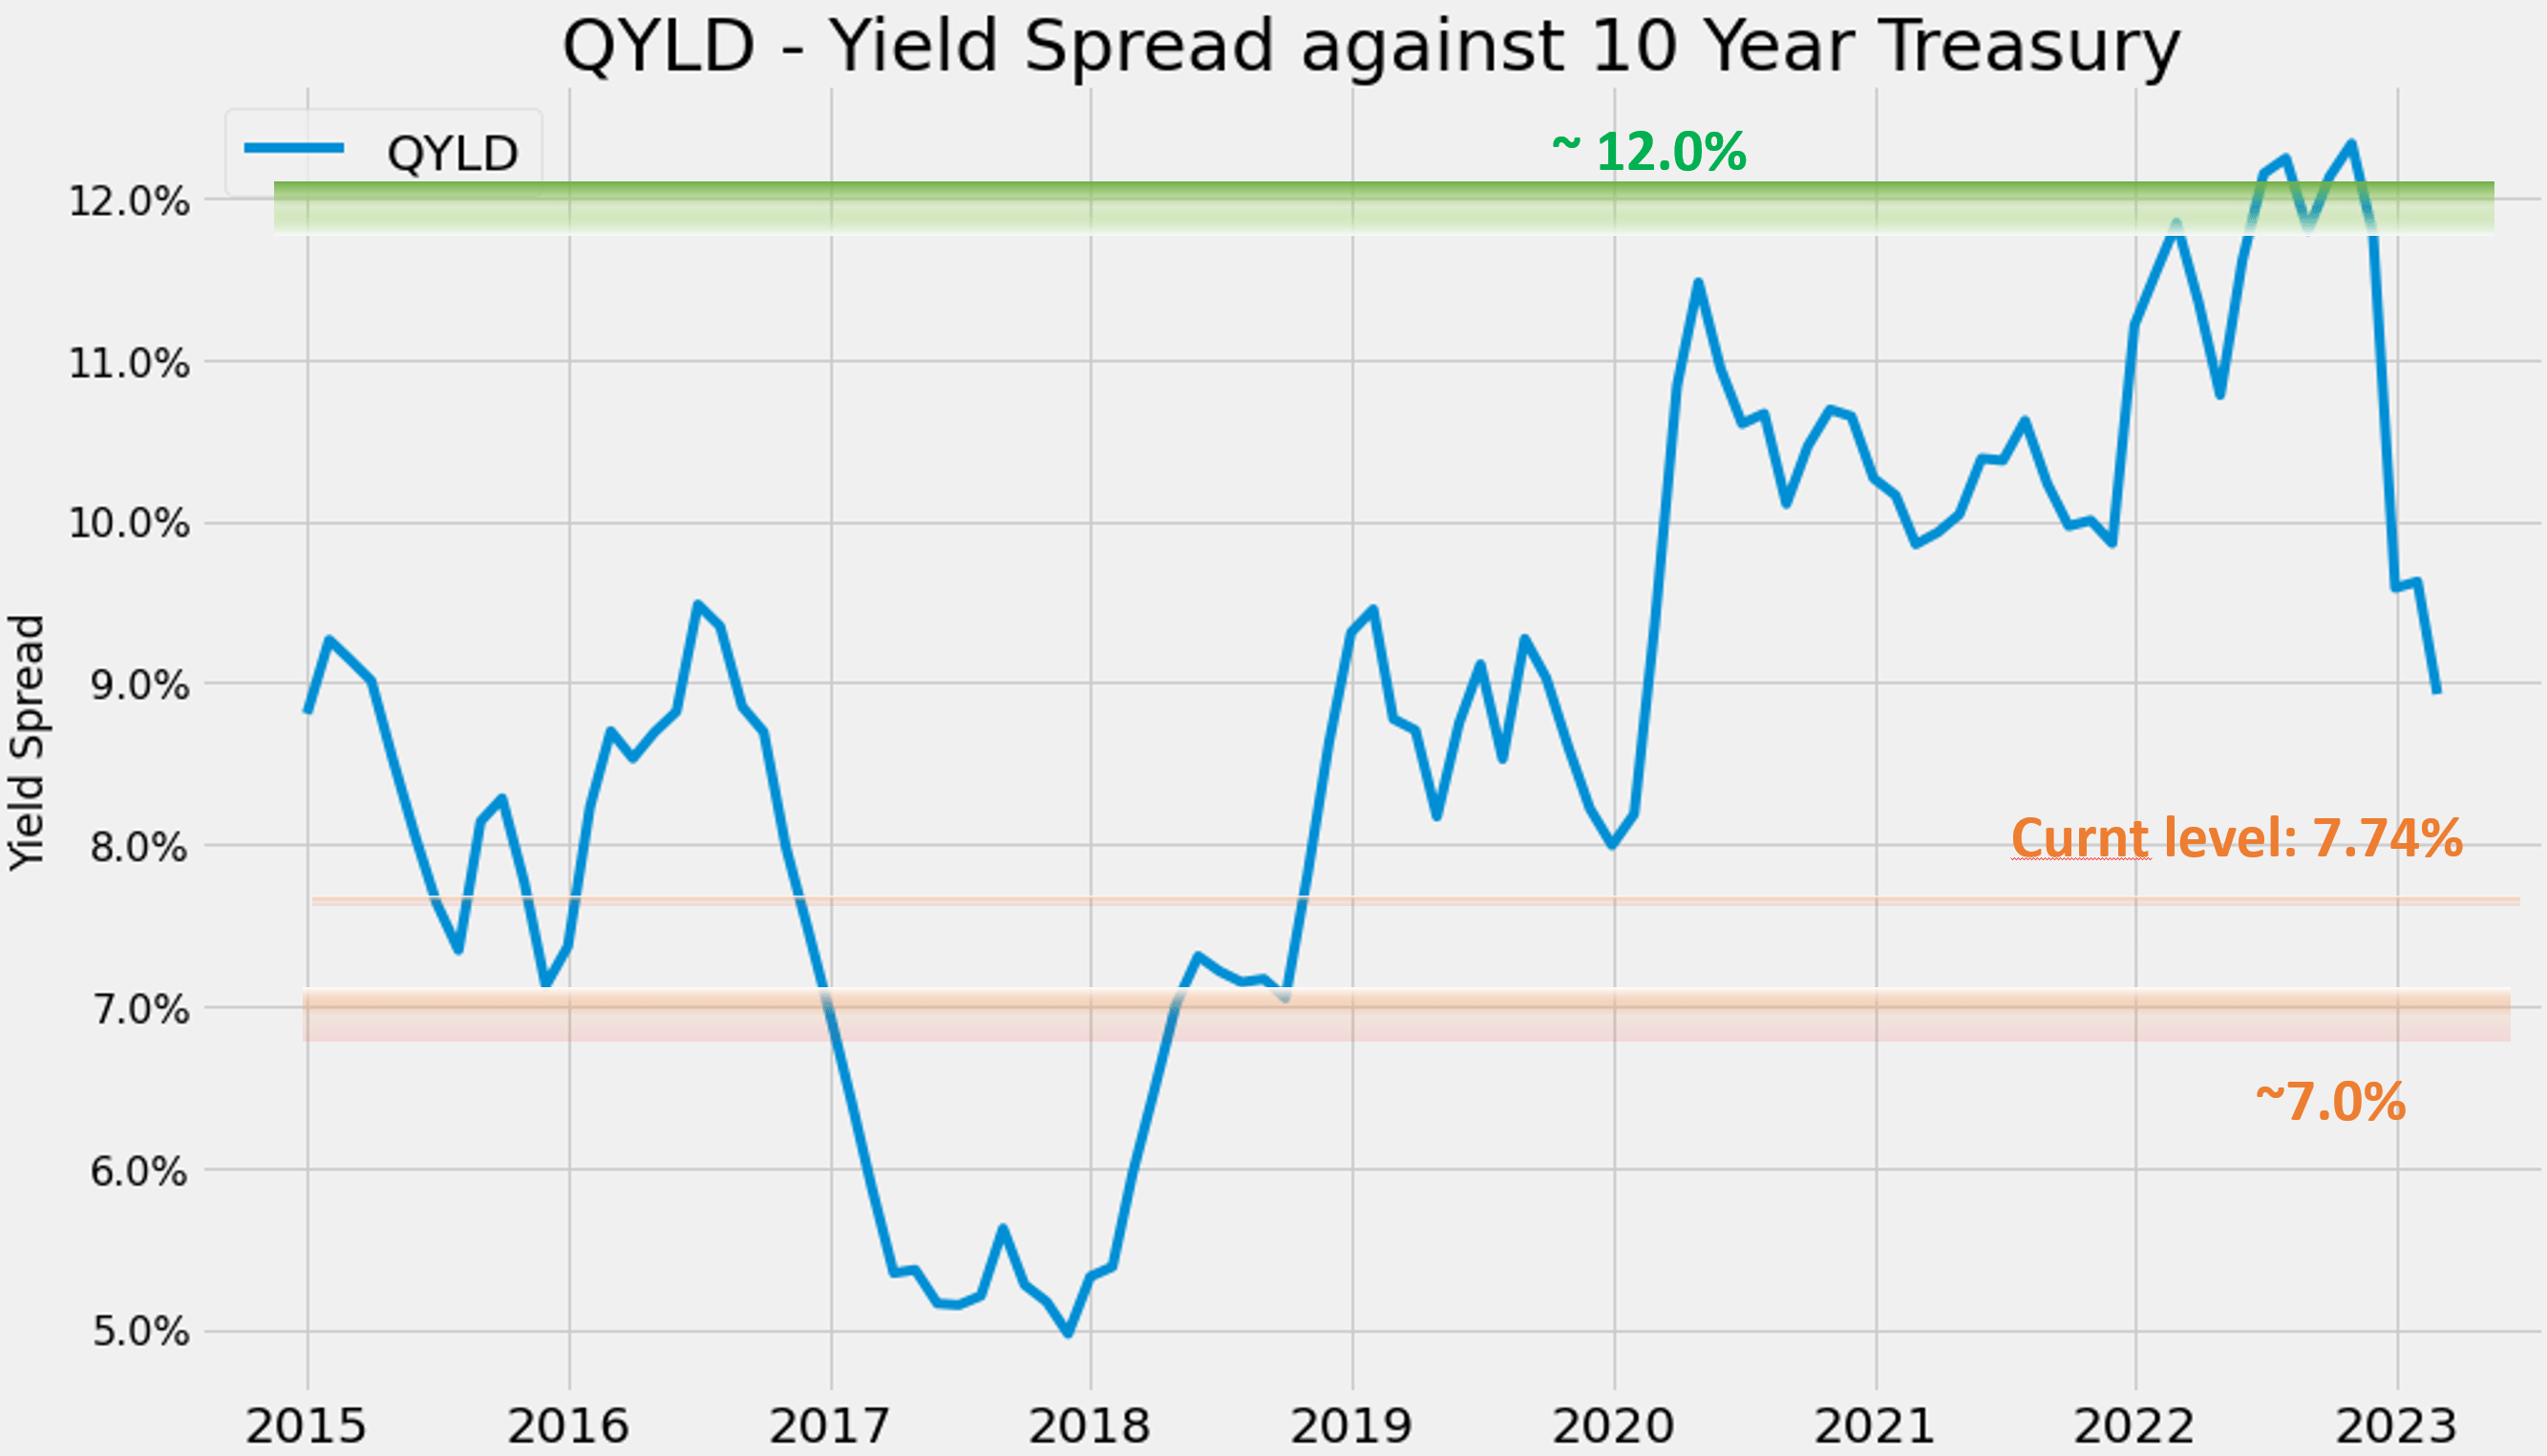
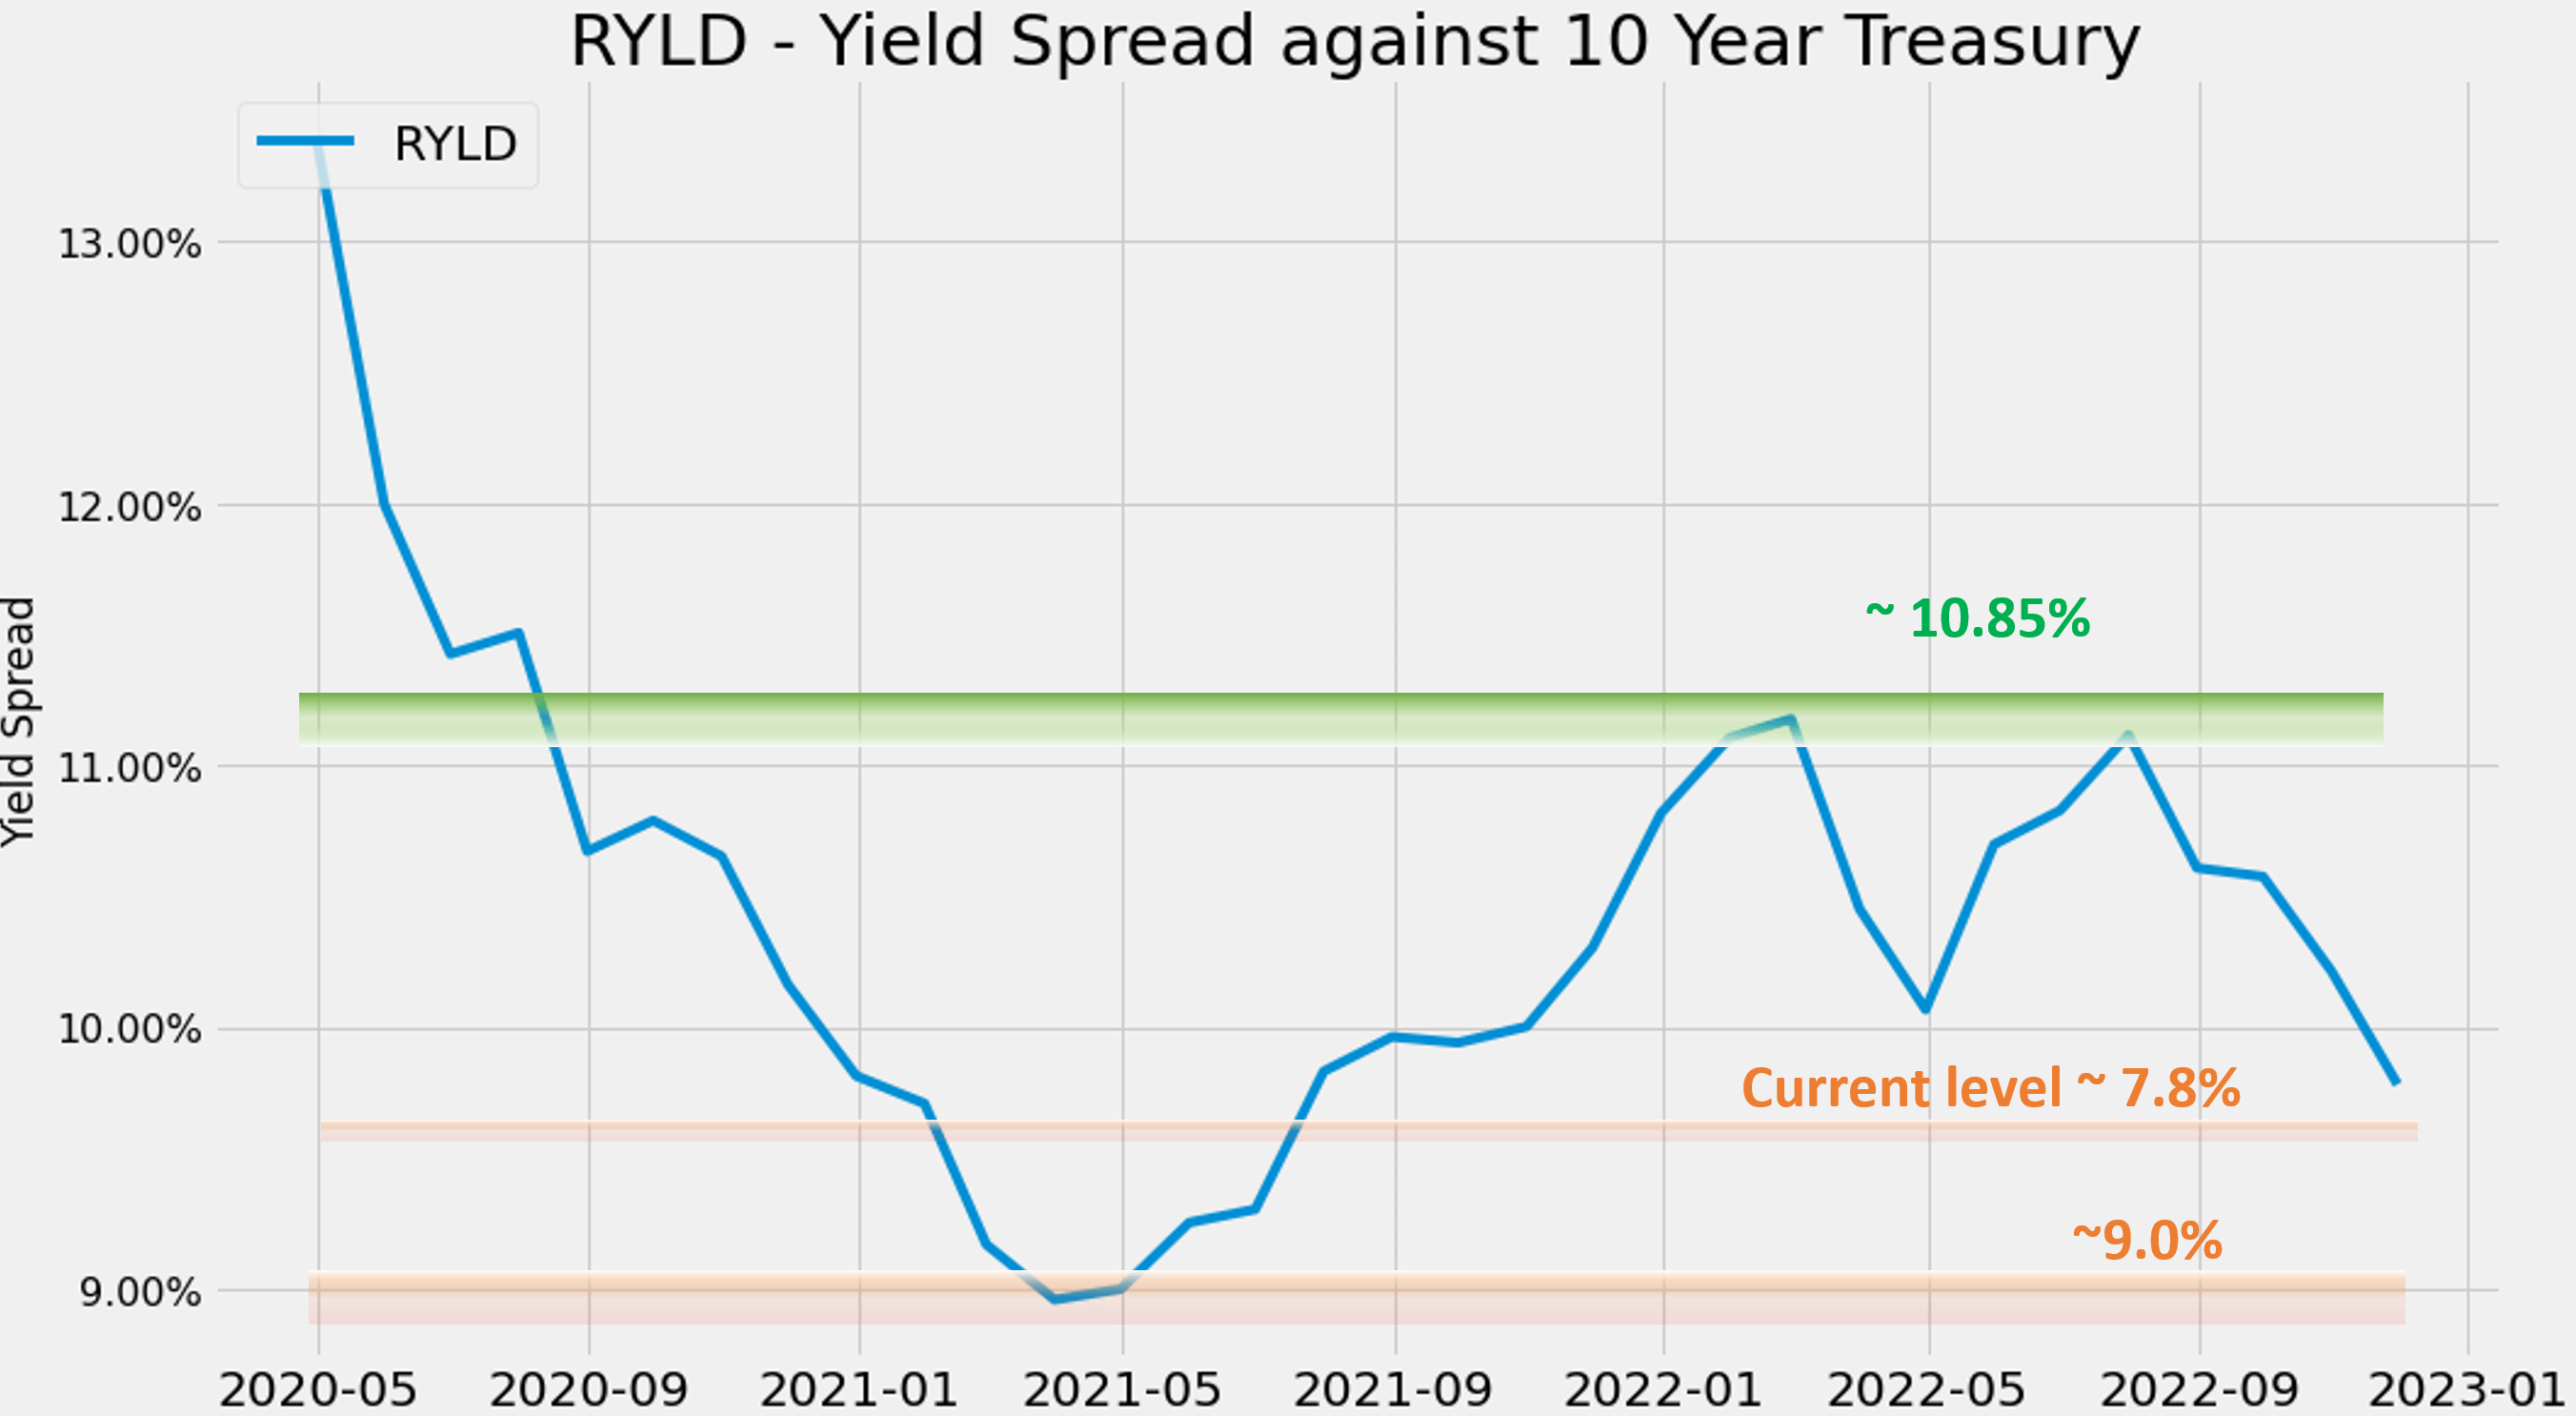
An elevated risk-free rate can hurt QYLD and RYLD in a number of ways. To start, a higher risk-free rate automatically devalues their dividend payouts, which are their major mechanism of generating returns. If you recall from the first chart in the article, QYLD's average yield in the past 4 years is about 12% and RYLD's average is about 14%. A 12~14% yield when the risk-free rates were around 1% (like during 2020) is worth much more than a 12% yield with 4%+ treasury rates. Actually, as you can see from the next 2 charts, the spread between QYLD and RYLD's dividend yields relative to 10-year Treasury rates is currently near the thinnest level in multi-years. Note the data for RYLD shown in the second figure dates back to only 2020 because it was only launched then.
Second, higher interest rates can hurt option premiums too. Option premiums reflect the expected future value of the underlying asset. And higher interest rates discount future cash flows more heavily. Thus, I expect funds like RYLD and QYLD to experience lower premium income if the current interest rates persist or become even higher.
Volatility index and option premium
Besides the pressure from interest rates, the volatility index is another force that can pressure RYLD and QYLD. As detailed in my earlier article , the premium of an option is directly proportional to the implied volatility ("IV"). As seen in the two charts below, the IV for both the Russell 200 and NASDAQ 100 index (approximated by the IV from IWM and QQQ) is currently near a historical low. To be more specific,
- For options based on the NASDAQ 100 index, their IV has fluctuated between a peak of 16.6% and 37.8% in the past 52 weeks. And the current value is at 16.6%, near the lowest level.
- The picture is very similar for options based on the Russell 2000 index. their IV has fluctuated between a peak of 16.6% and 35.5% in the past 52 weeks. And the current value is at 17.1%, again near the lowest level.
Source: oic.ivolatility.com. IV for IWM options. Source: oic.ivolatility.com. IV for QQQ options.
An alternative idea
I feel my thesis would be incomplete if I didn't suggest an alternative idea. In this case, I do have an alternative idea: Global X Russell 2000 Covered Call & Growth ETF (RYLG). RYLG is a better option than either QYLD or RYLD at least for two reasons.
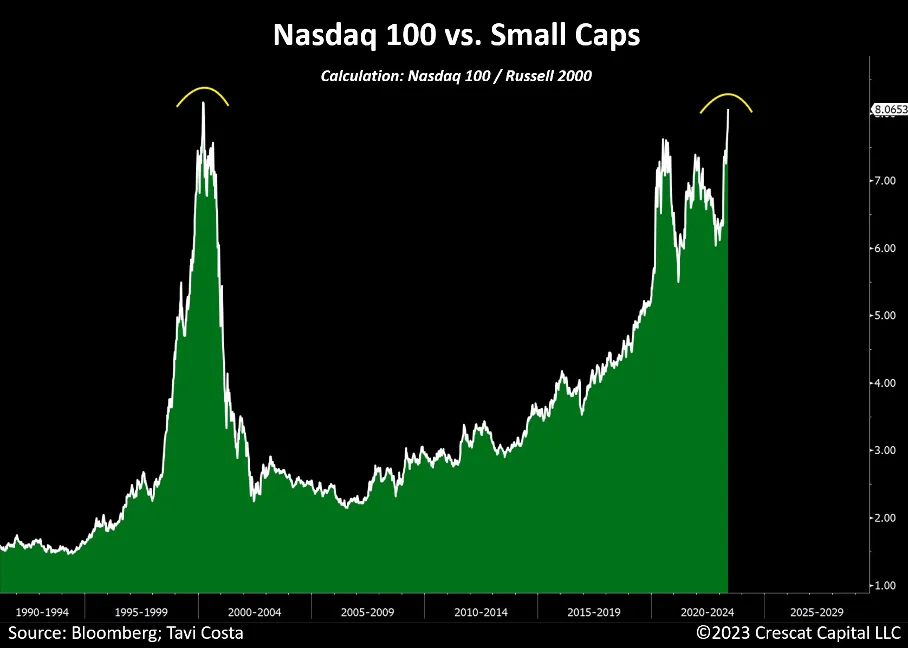
The first reason involves the valuation gap between the underlying indices. As seen in the chart below, the current valuation gap between the Nasdaq 100 and Russell 2000 (RTY) is near the widest level since 2000 amid the dot-com bubble. As a result, the underlying assets in RYLG are more attractively valued than those in RQYLD, offering better price appreciation potential.
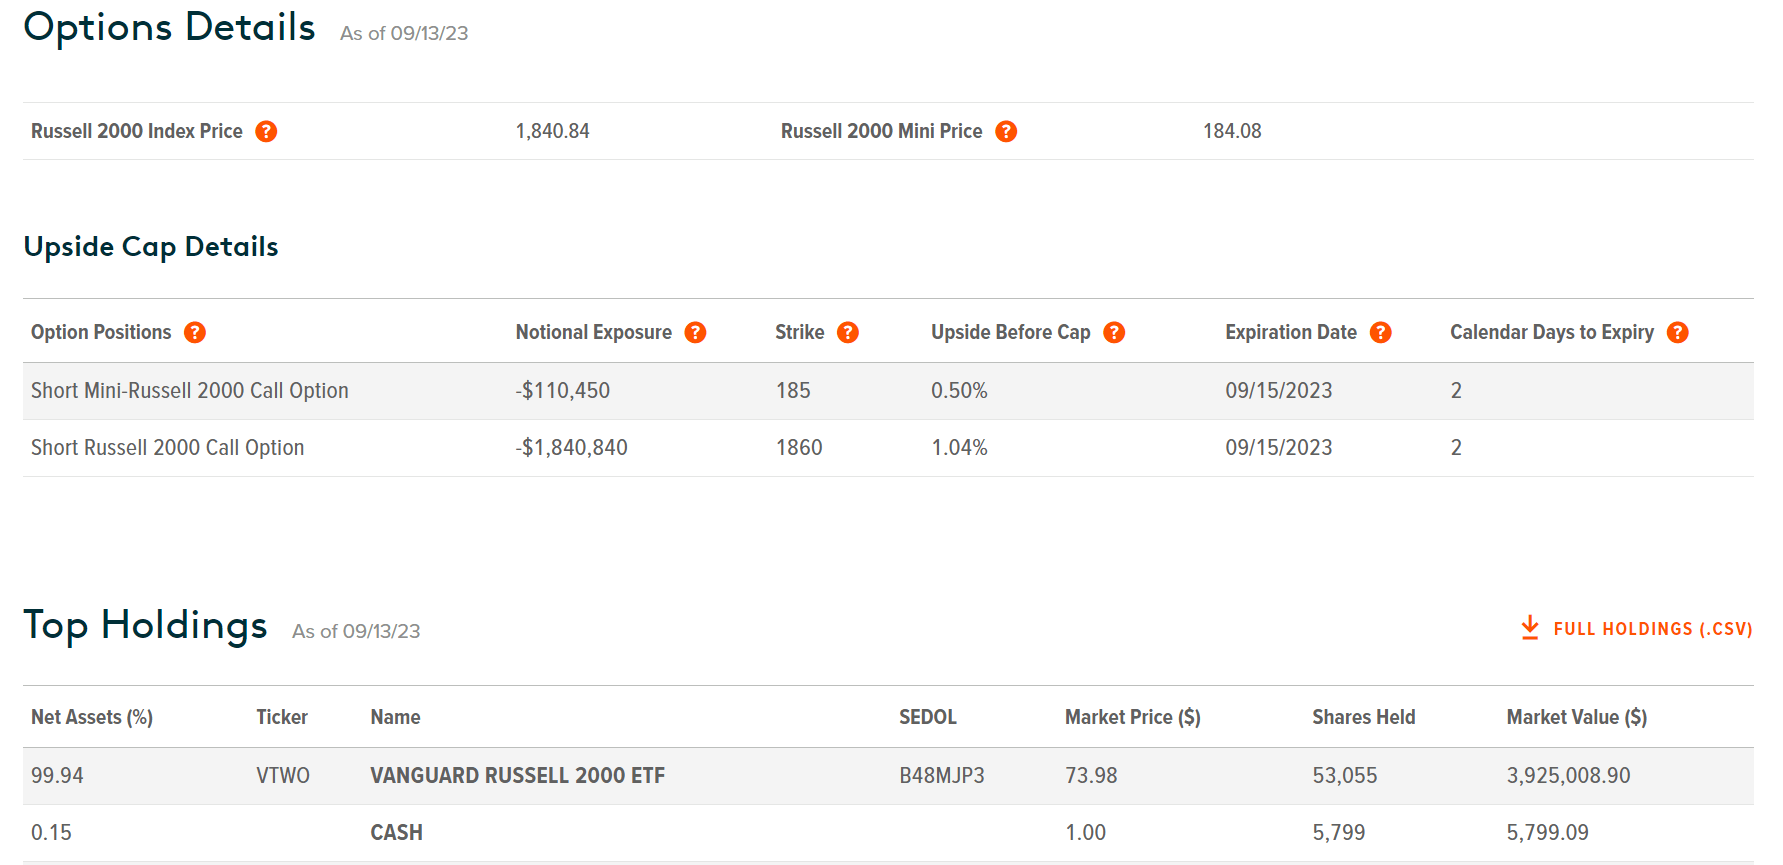
However, better price appreciation potential won't mean much if all the assets are used to cover calls (which puts a cap on the return no matter how much the price of the underlying assets appreciates). And this is the second reason why I think RYLD is a better idea. As seen in the chart below, QYLG currently holds two short Russell 2000 Call Options with a combined notional exposure of $1.8M, less than 50% of its net asset of about $3.9M. Therefore, in the case of a large price appreciation, more than half of its assets could enjoy the full appreciation.
Risks and final thoughts
To recap, under current conditions, I see several risks lurking behind covered-call funds like RYLD and QYLD. These risks include high-interest rates, low implied volatility, and limited upside potential. Both RYLD and QYLD use almost all their underlying assets to cover options. As a result, they are capped on their total upside potential since they will be forced to sell some of their shares if the call options are exercised. I see RYLG as a better alternative thanks to the current valuation gap between small caps and the NASDAQ 100 index. However, note that as a price, RYLD provides a lower current yield (about 8.4%). RYLD is also a much smaller fund and has a much shorter history (see the chart below), which creates some uncertainties to assess its performance.
To conclude, the thesis of this article is to caution potential investors about the risks lurking behind the 12% yield provided by RYLD and QYLD. The yield is not as high as it seems on the surface. Benchmarked by risk-free interest rates, their yield spread is actually among the thinnest levels in multi-years. Such elevated rates and low IV could pressure their premium income and cause the yield to decline. Considering such headwinds and the valuation gap between the small-cap and the NASDAQ 100 index, my view is that it is a better idea to use a fund that A) is based on small caps, B) but only uses part of its asset to cover the options.
For further details see:
QYLD Or RYLD? There's A Better Idea