SVOL - QYLD: Stop Buying This ETF
2023-11-29 20:22:29 ET
Summary
- The Global X NASDAQ 100 Covered Call ETF has underperformed its index and is not ideal in a total returns context, or as a portfolio hedge.
- QYLD's performance has consistently lagged, with underperformance of more than 300% since inception.
- For income-oriented investors, QYLD's flawed execution structure and depreciation of principal make it a less favorable option compared to other investments like common stock.
- QYLD might be a good pick for those who are considering annuities instead - or for those who don't care about their investment principal.
- We maintain our "Sell" rating on QYLD.
Over the course of this year, we've written a few articles about the Global X NASDAQ 100 Covered Call ETF, commonly referred to as " QYLD " (which we pronounce as "Que-Yield").
First , in April, we wrote " QYLD: The Yield Is A Mirage ", which talks about how the fund works and why it's functionally designed to destroy principal over time.
If you don't want to click away to read that, the core idea is that the ETF takes trades that either end in a profit or a loss. Then, no matter if the fund actually makes money or not, the ETF pays a cash distribution anyway.
Over time, the fund is mathematically destined to go to zero as it pays out capital above its net profits.
Second , in July, we published " QYLD: Substandard Returns Set To Continue ", which provided a performance update for the ETF and talked more about what kinds of markets we expect the fund will do well in.
We also discussed why we didn't think the coming market environment would be good for the fund, which turned out to be accurate.
Today , we'll provide another performance update with some broader context, discuss why we're still not fans of the fund, and finish by talking about what products QYLD should really be compared against: Annuities.
Sound good? Let's jump in.
Performance Update
Perhaps un-shockingly, the fund has not done well since our last article.
When we published in July, we talked about how the outlook for stocks was grim, and that we'd likely see a dip followed by a bounce that the ETF wouldn't be able to participate in:
It isn't just Nvidia and Apple either; Microsoft ( MSFT ) also looks extended, with a free cash flow multiple scraping the upper historical deviation at ~45x.
Some may argue that this is a perfect time for QYLD to outperform, but we think that the fund's current position won't afford much protection.
The position's current moneyness is 99.7%, which means that the options are still out of the money, or "OTM". As we all know, OTM options have a lower delta, which means that they "protect" principal less and less as stocks drop before option expiry.
Once the momentum in the mega caps runs out, we fear that the setup is similar in some ways to the Covid related drop of 2020:
In that scenario, the option the fund was short expired in late February, just in time to allow the fund's assets to participate in a full drop. Then, at lows, QYLD sold another call, which hampered NAV from recovering with QQQ.
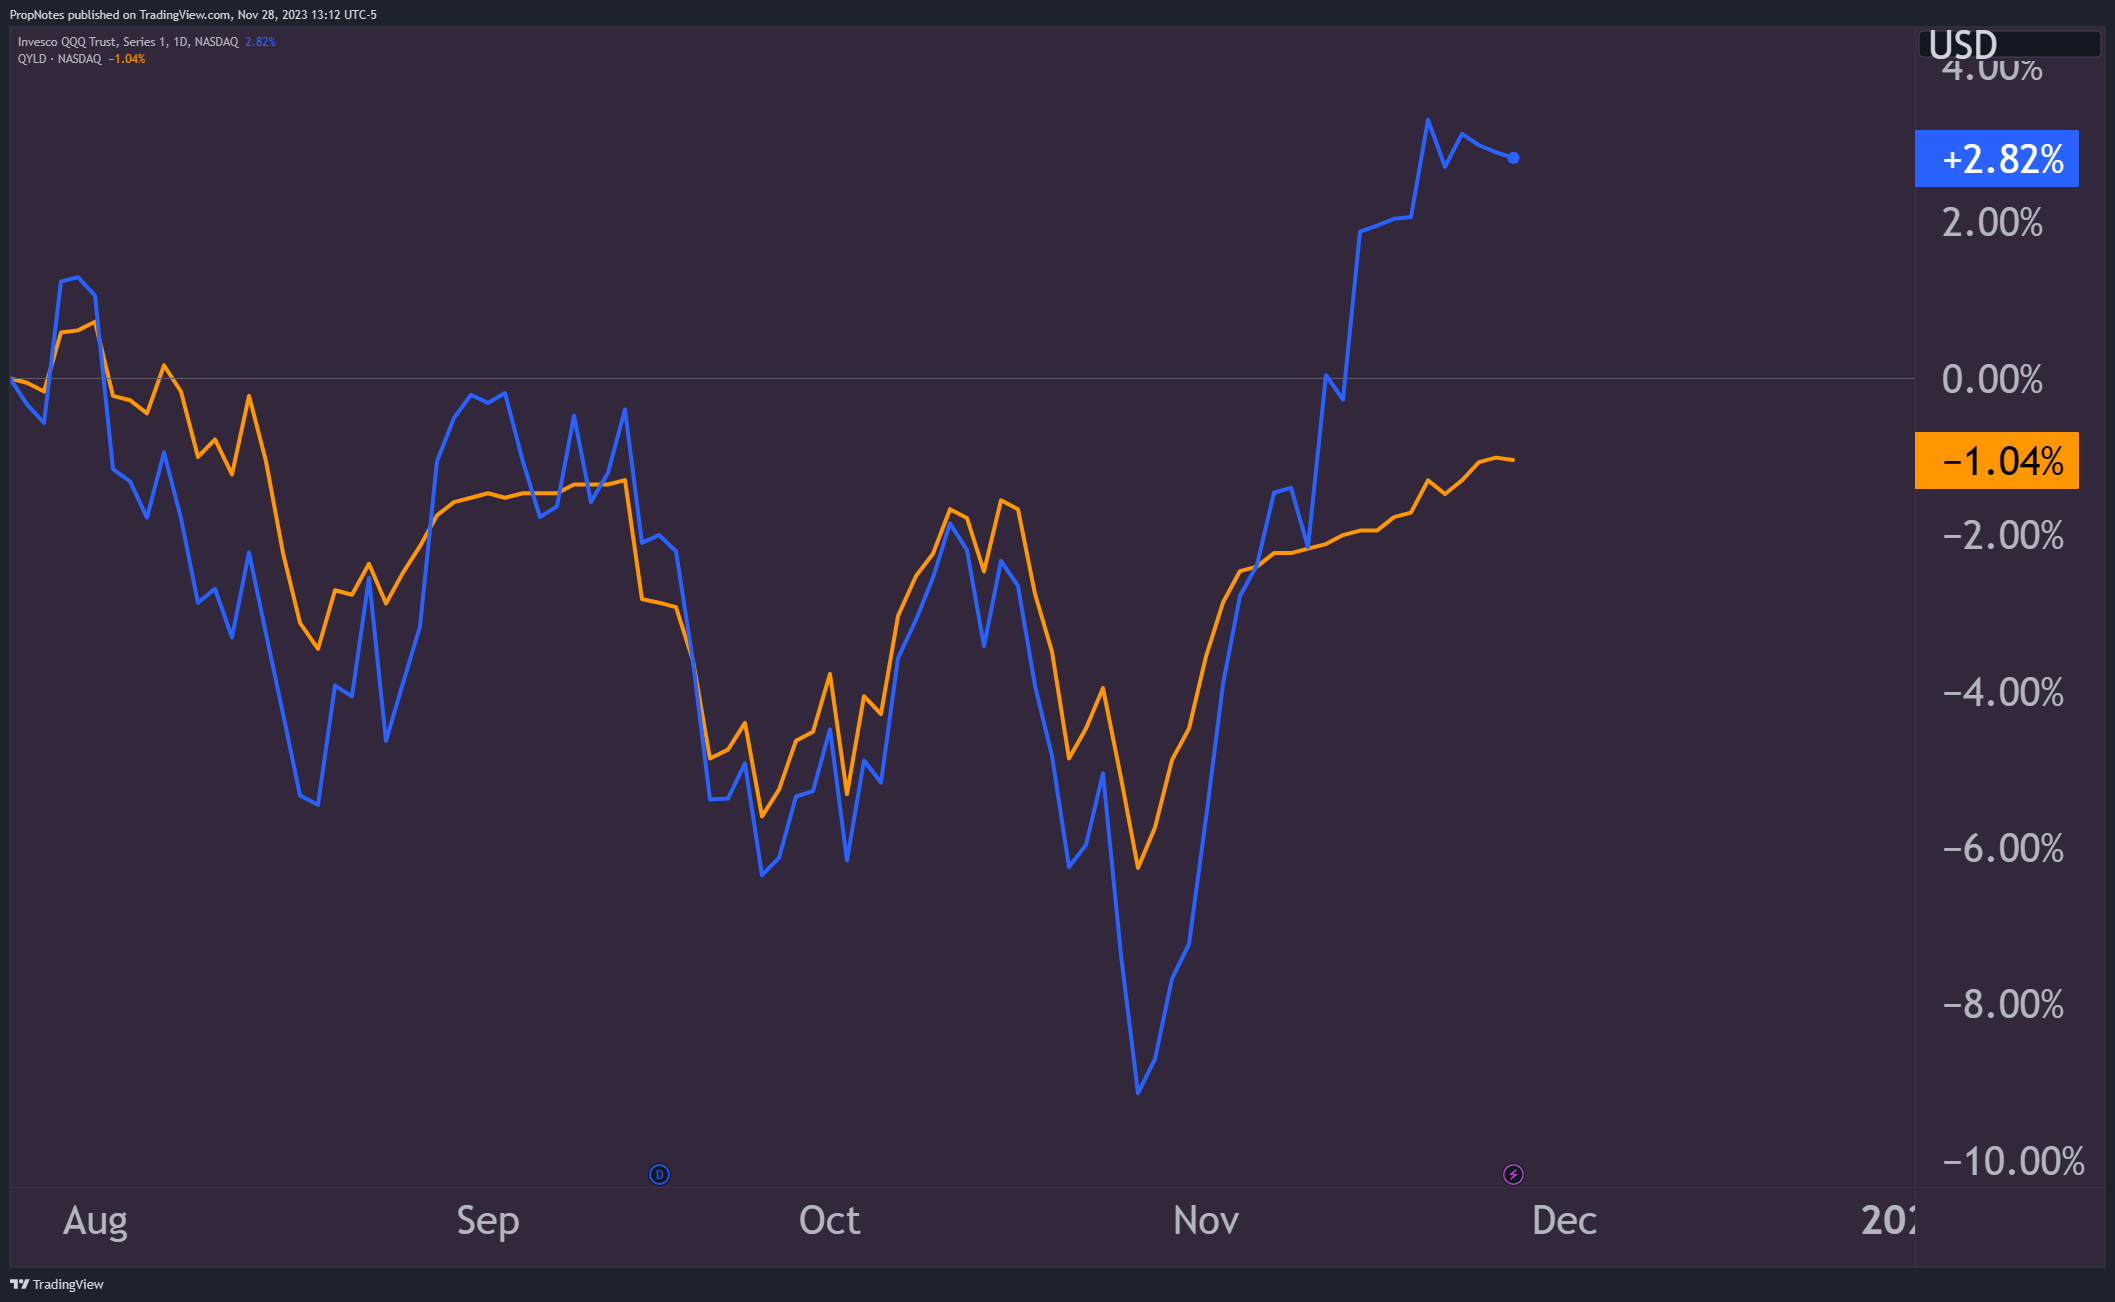
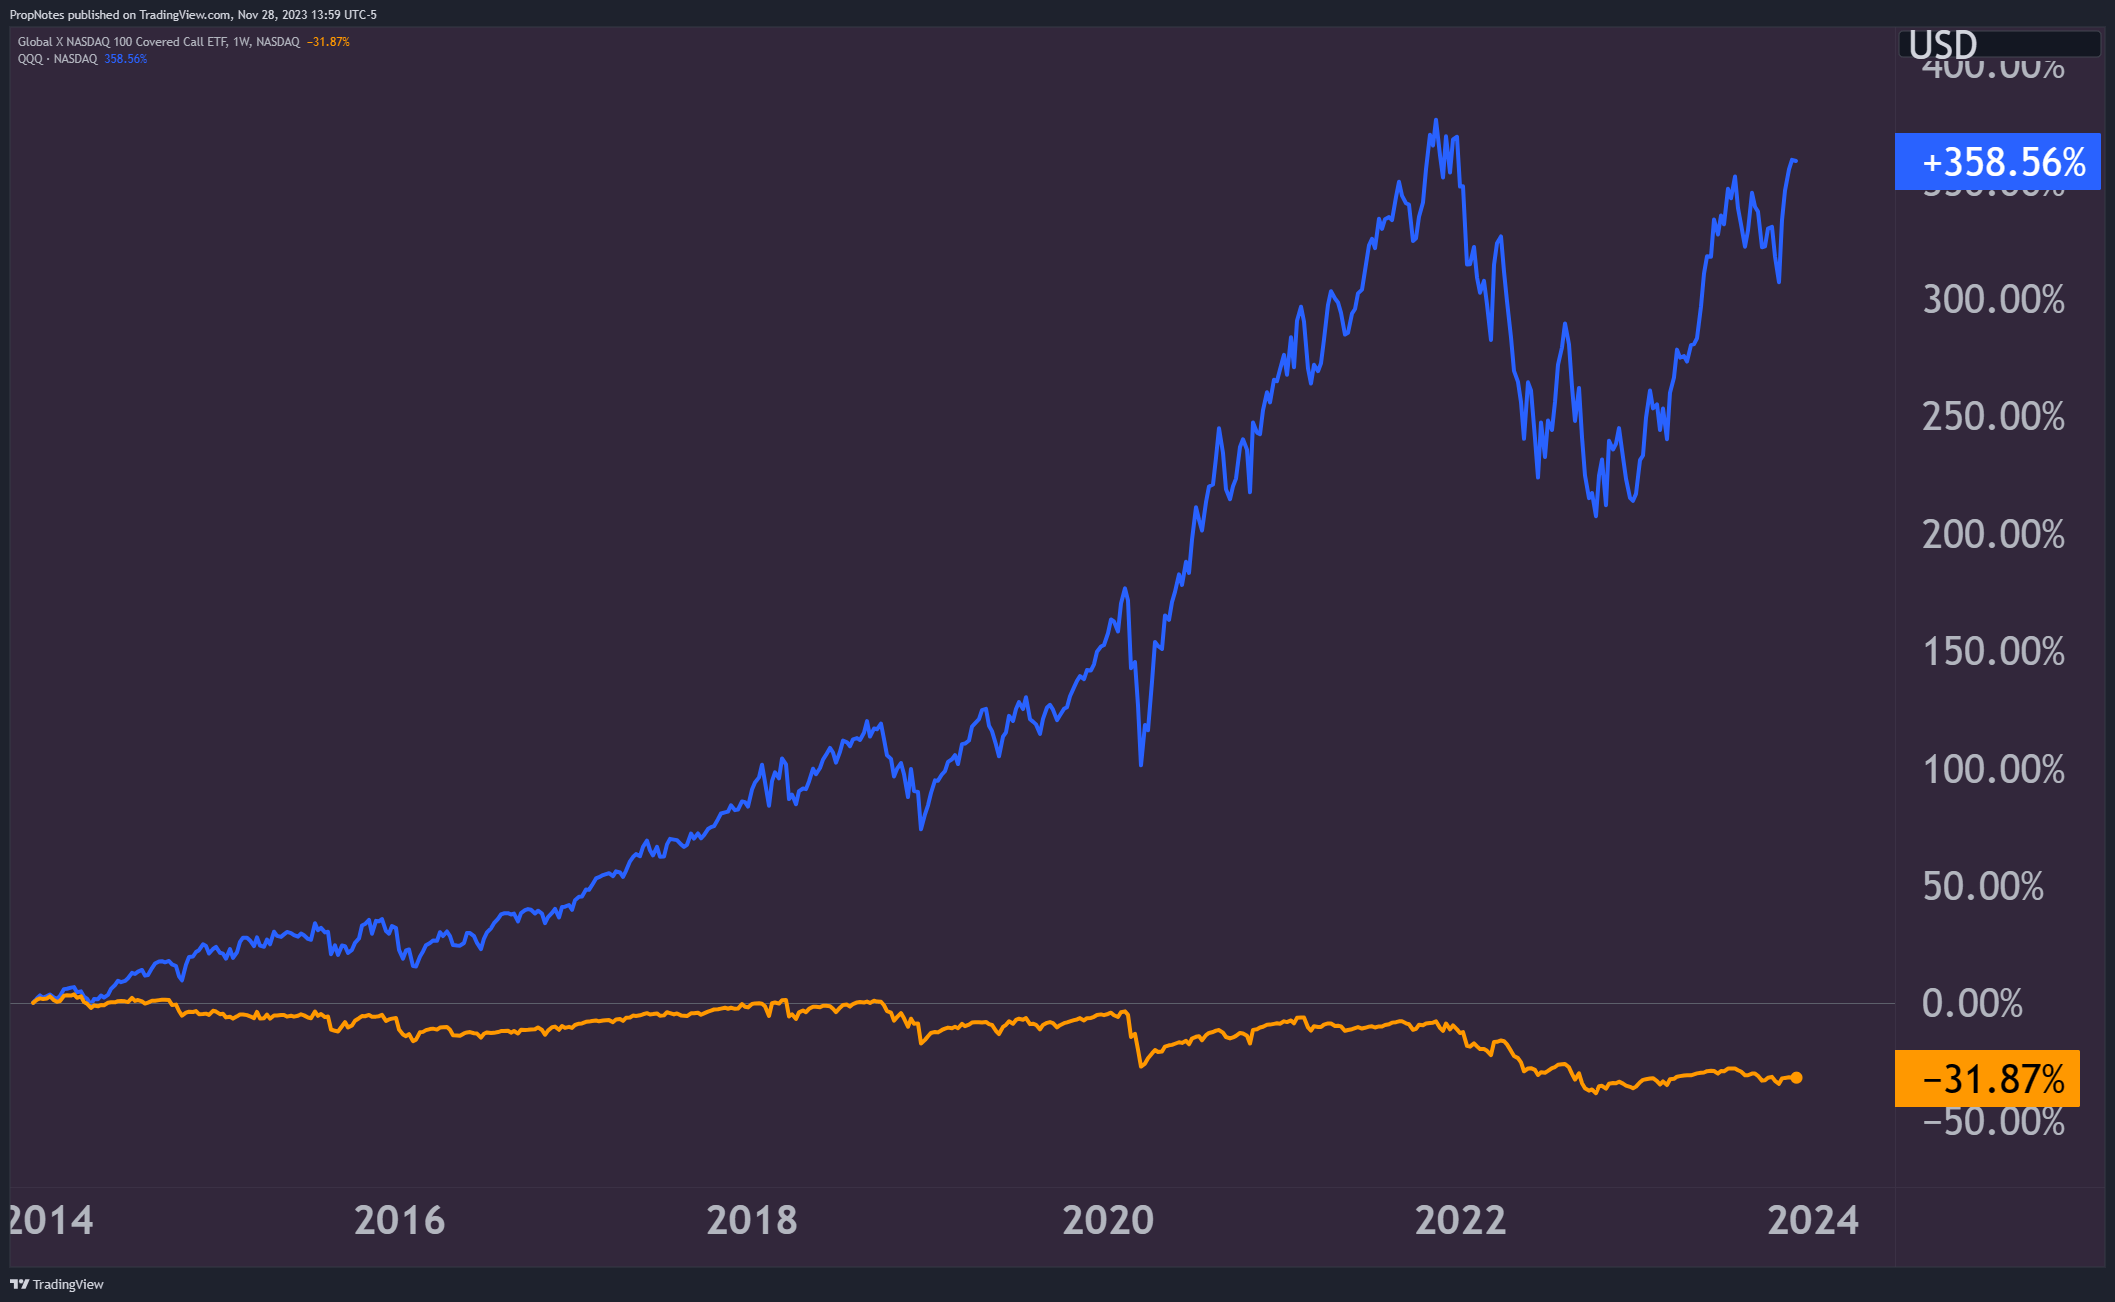
This is pretty much what has happened, as you can see that tech equities sold off into the end of October, since which the market has rallied and QYLD has underperformed:
TradingView
Above, you can see QQQ in blue, and QYLD in orange.
Granted, the performance swings have been much smaller than the drop referenced in 2020, but the point still stands; the fund's core strategy occasionally makes losses, but still pays out NAV to holders, leading to a bad combination.
It's at this point in time that we are reminded that there are only a select few periods in which QYLD (dividends included) actually outperforms its underlying symbol.
A Walk Down Memory Lane
Zooming out, the ticker has had a bad run since inception.
In 2014, QYLD notched a 4.6% total return, which was beaten by QQQ's return of >20%:
TradingView
In 2015, which was a choppy year, QQQ still outperformed QYLD, which earned 9.7% and 8% total returns, respectively:
TradingView
In 2016, QYLD's returns were relatively steady, but beaten by QQQ which saw a 10.3% total return vs. 6.1%:
TradingView
In 2017, which was one of the lowest-volatility years on record, the premiums generated by selling calls clearly didn't pay for the upside cost, as QQQ outperformed QYLD, the difference being 33.7% vs. 19.8%:
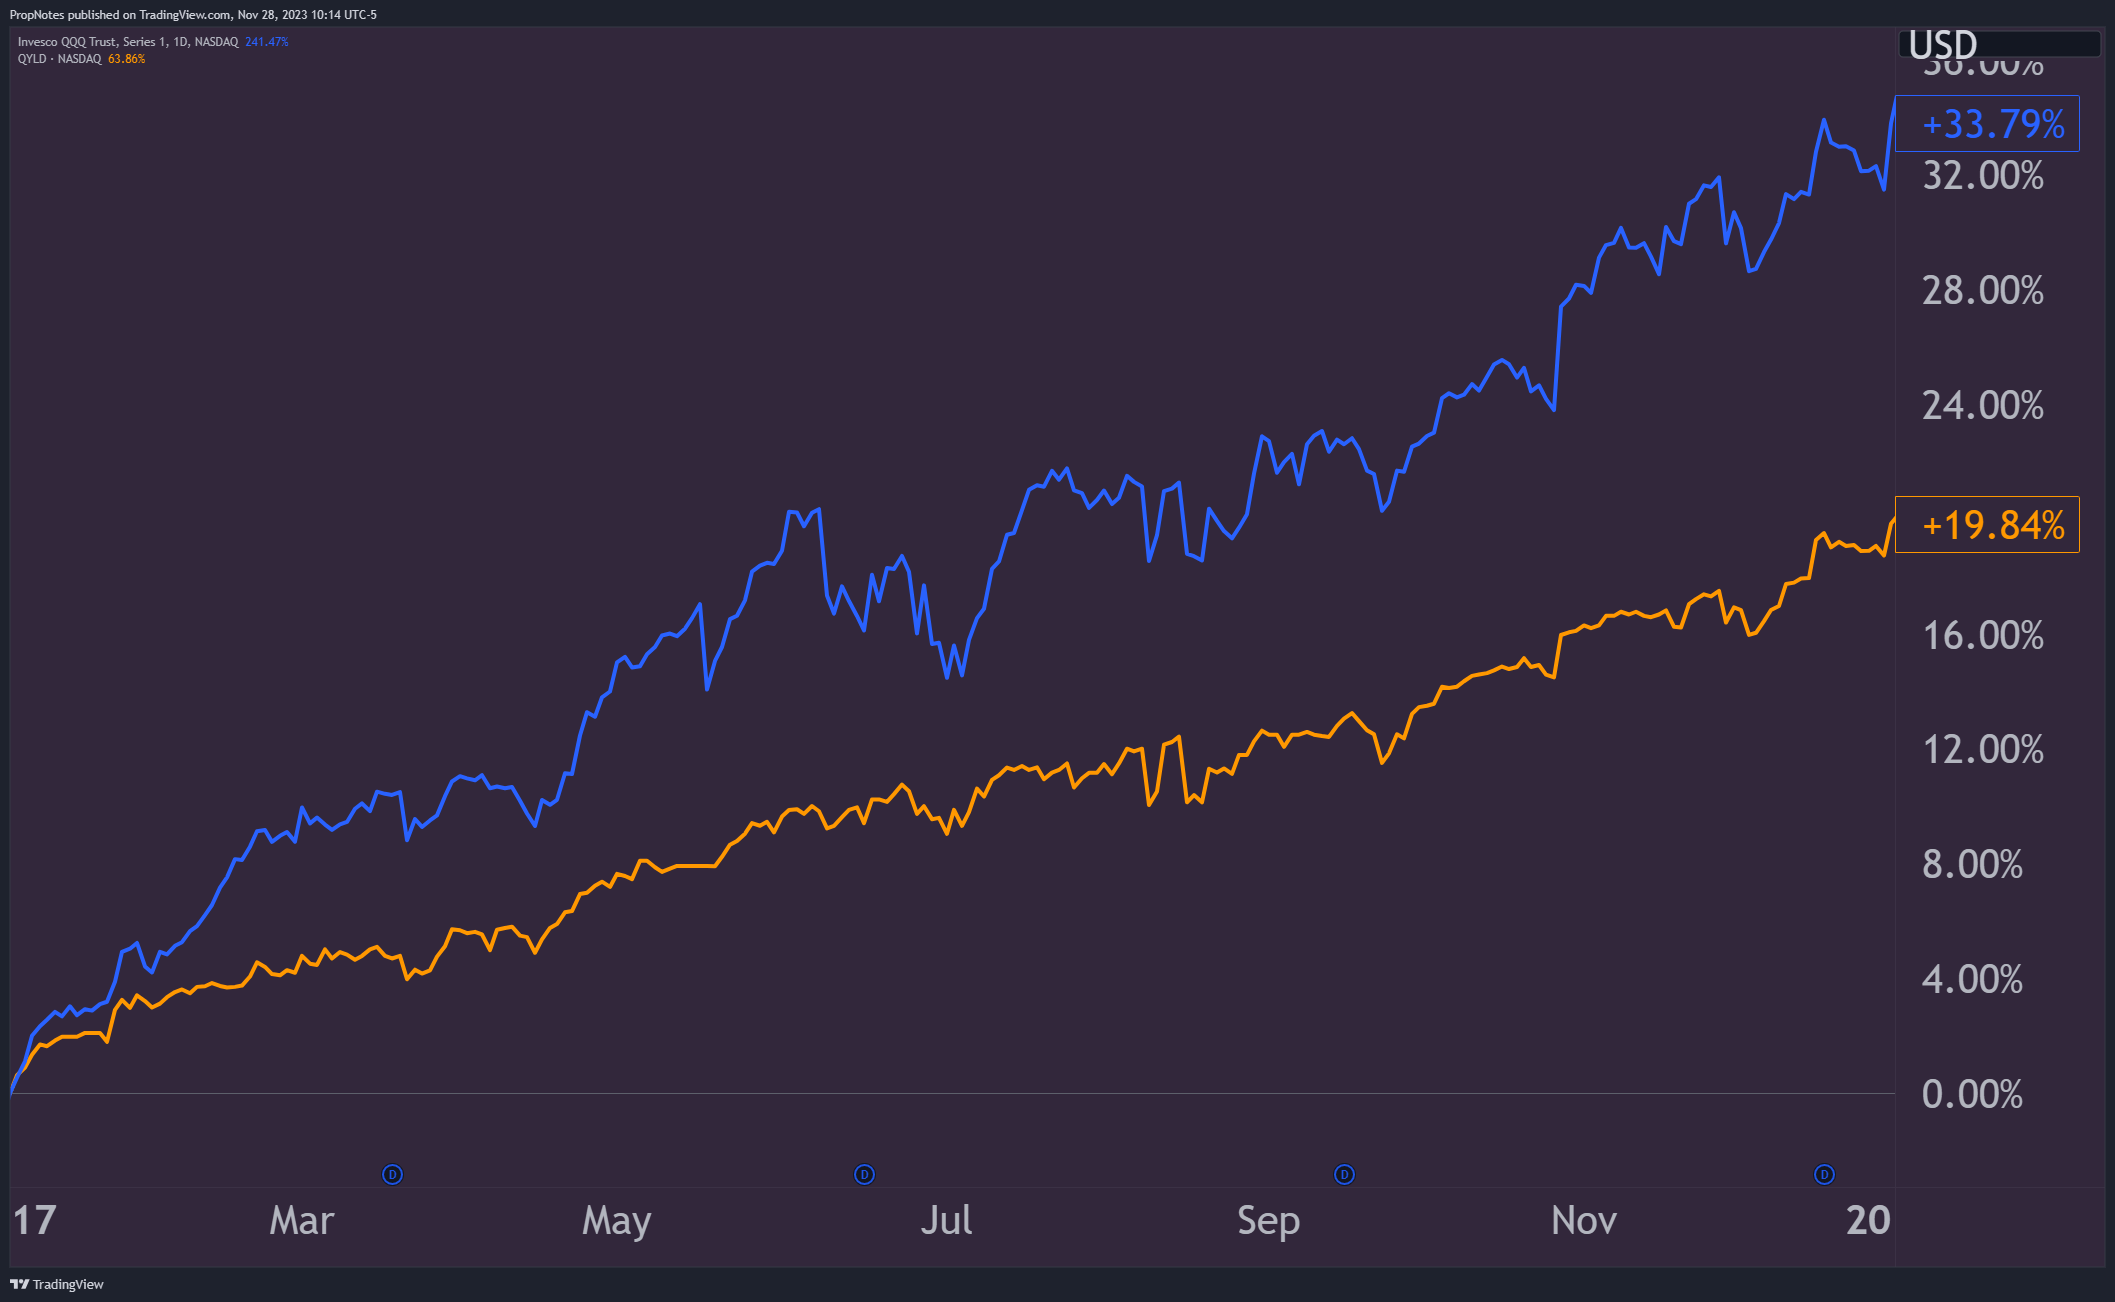
TradingView
In 2018, QQQ eked out a higher total return vs. QYLD, as the selloff towards Christmas of that year didn't spare QYLD's NAV:
TradingView
In 2019, QQQ handily outperformed QYLD's total return; 38.4% vs. 22.6%:
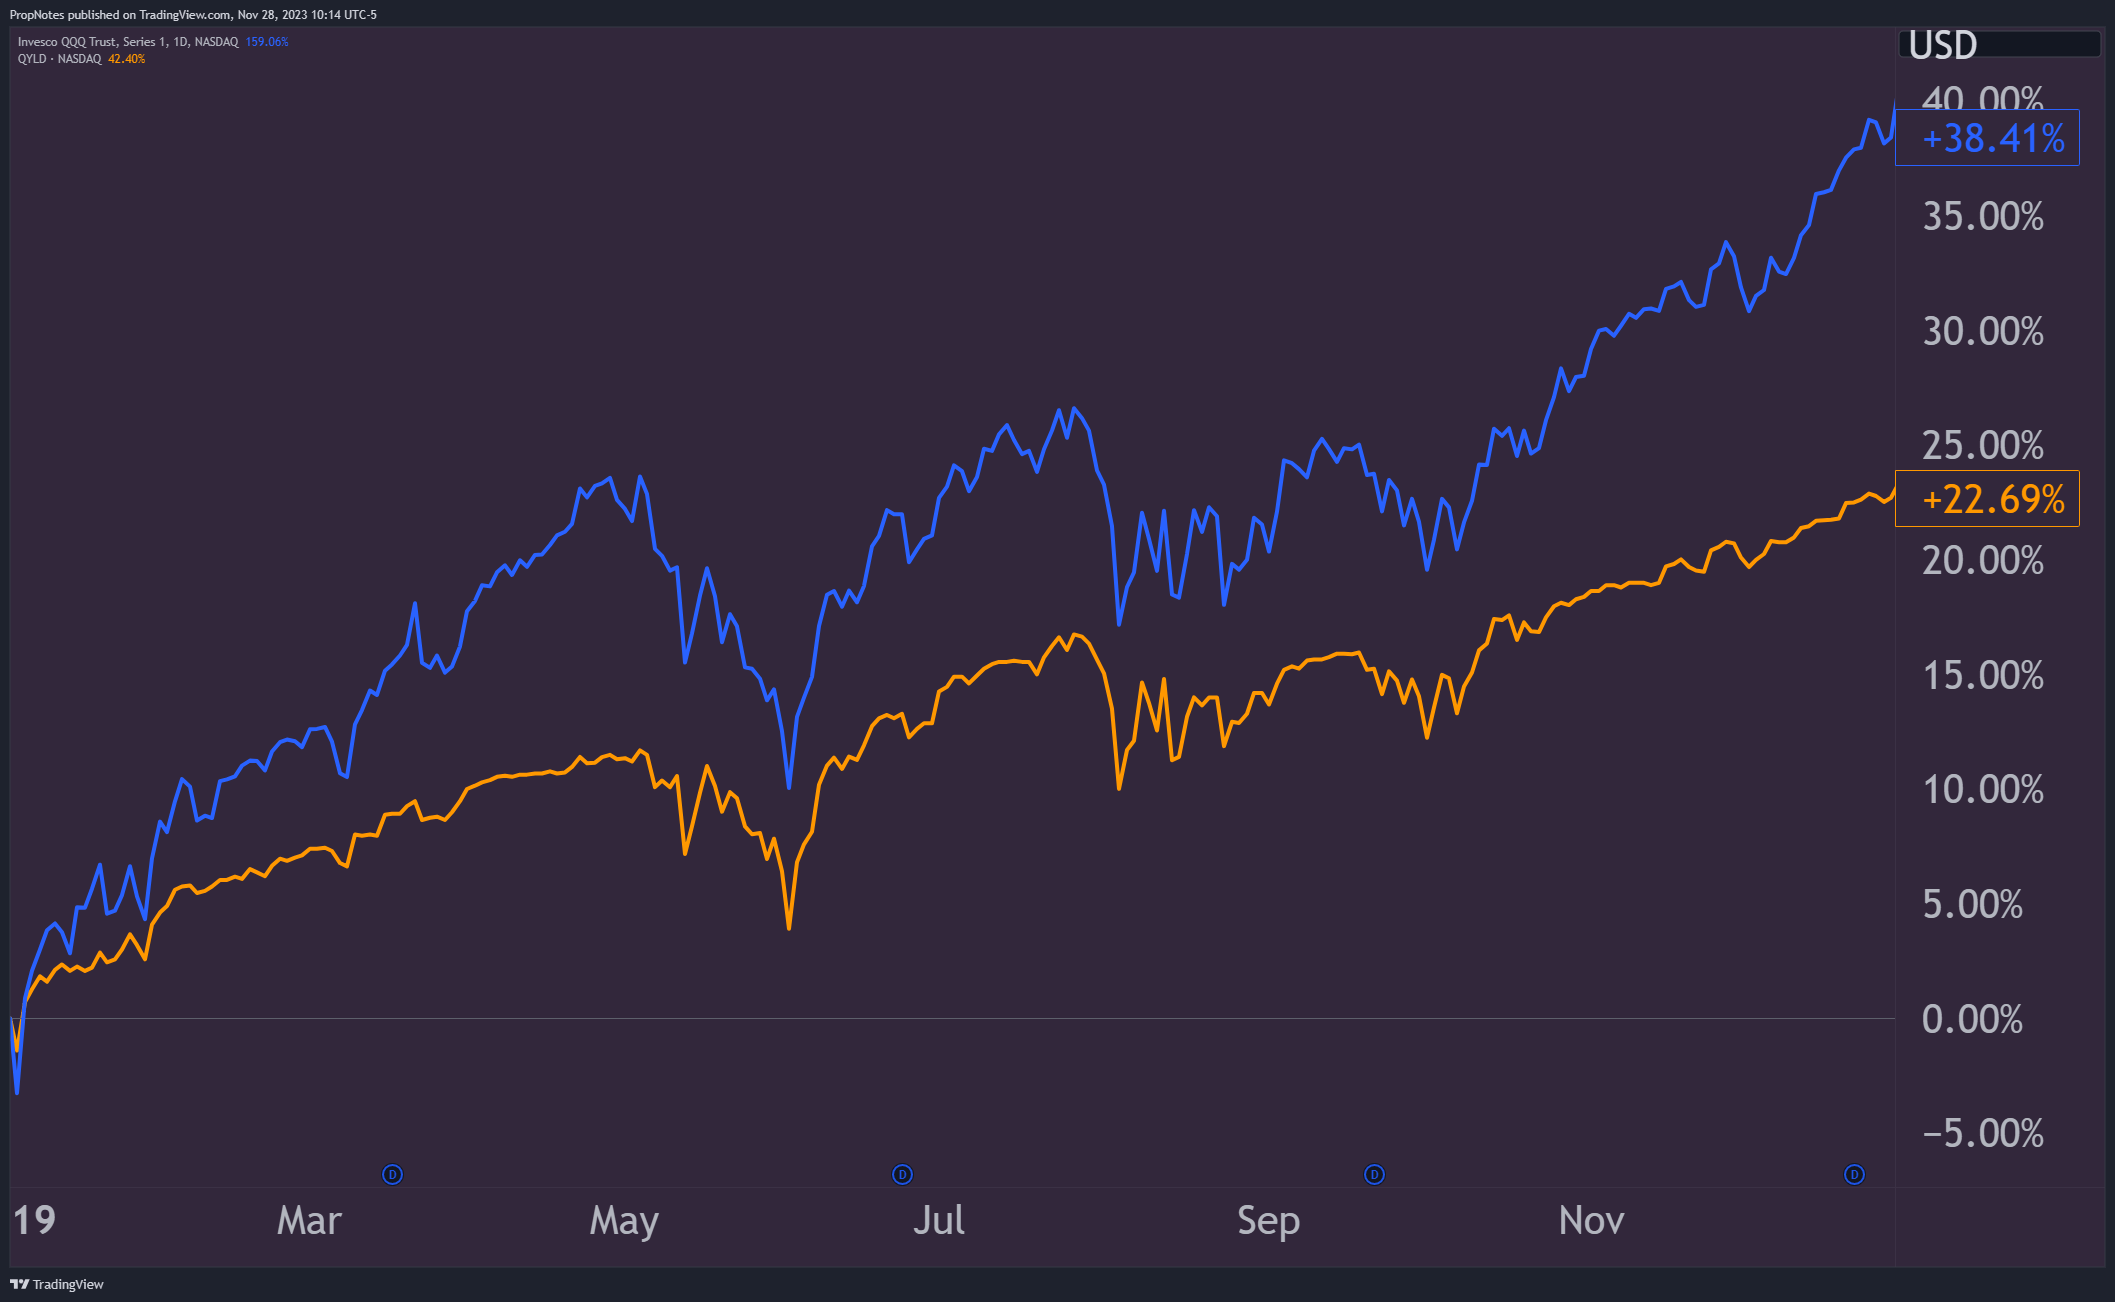
TradingView
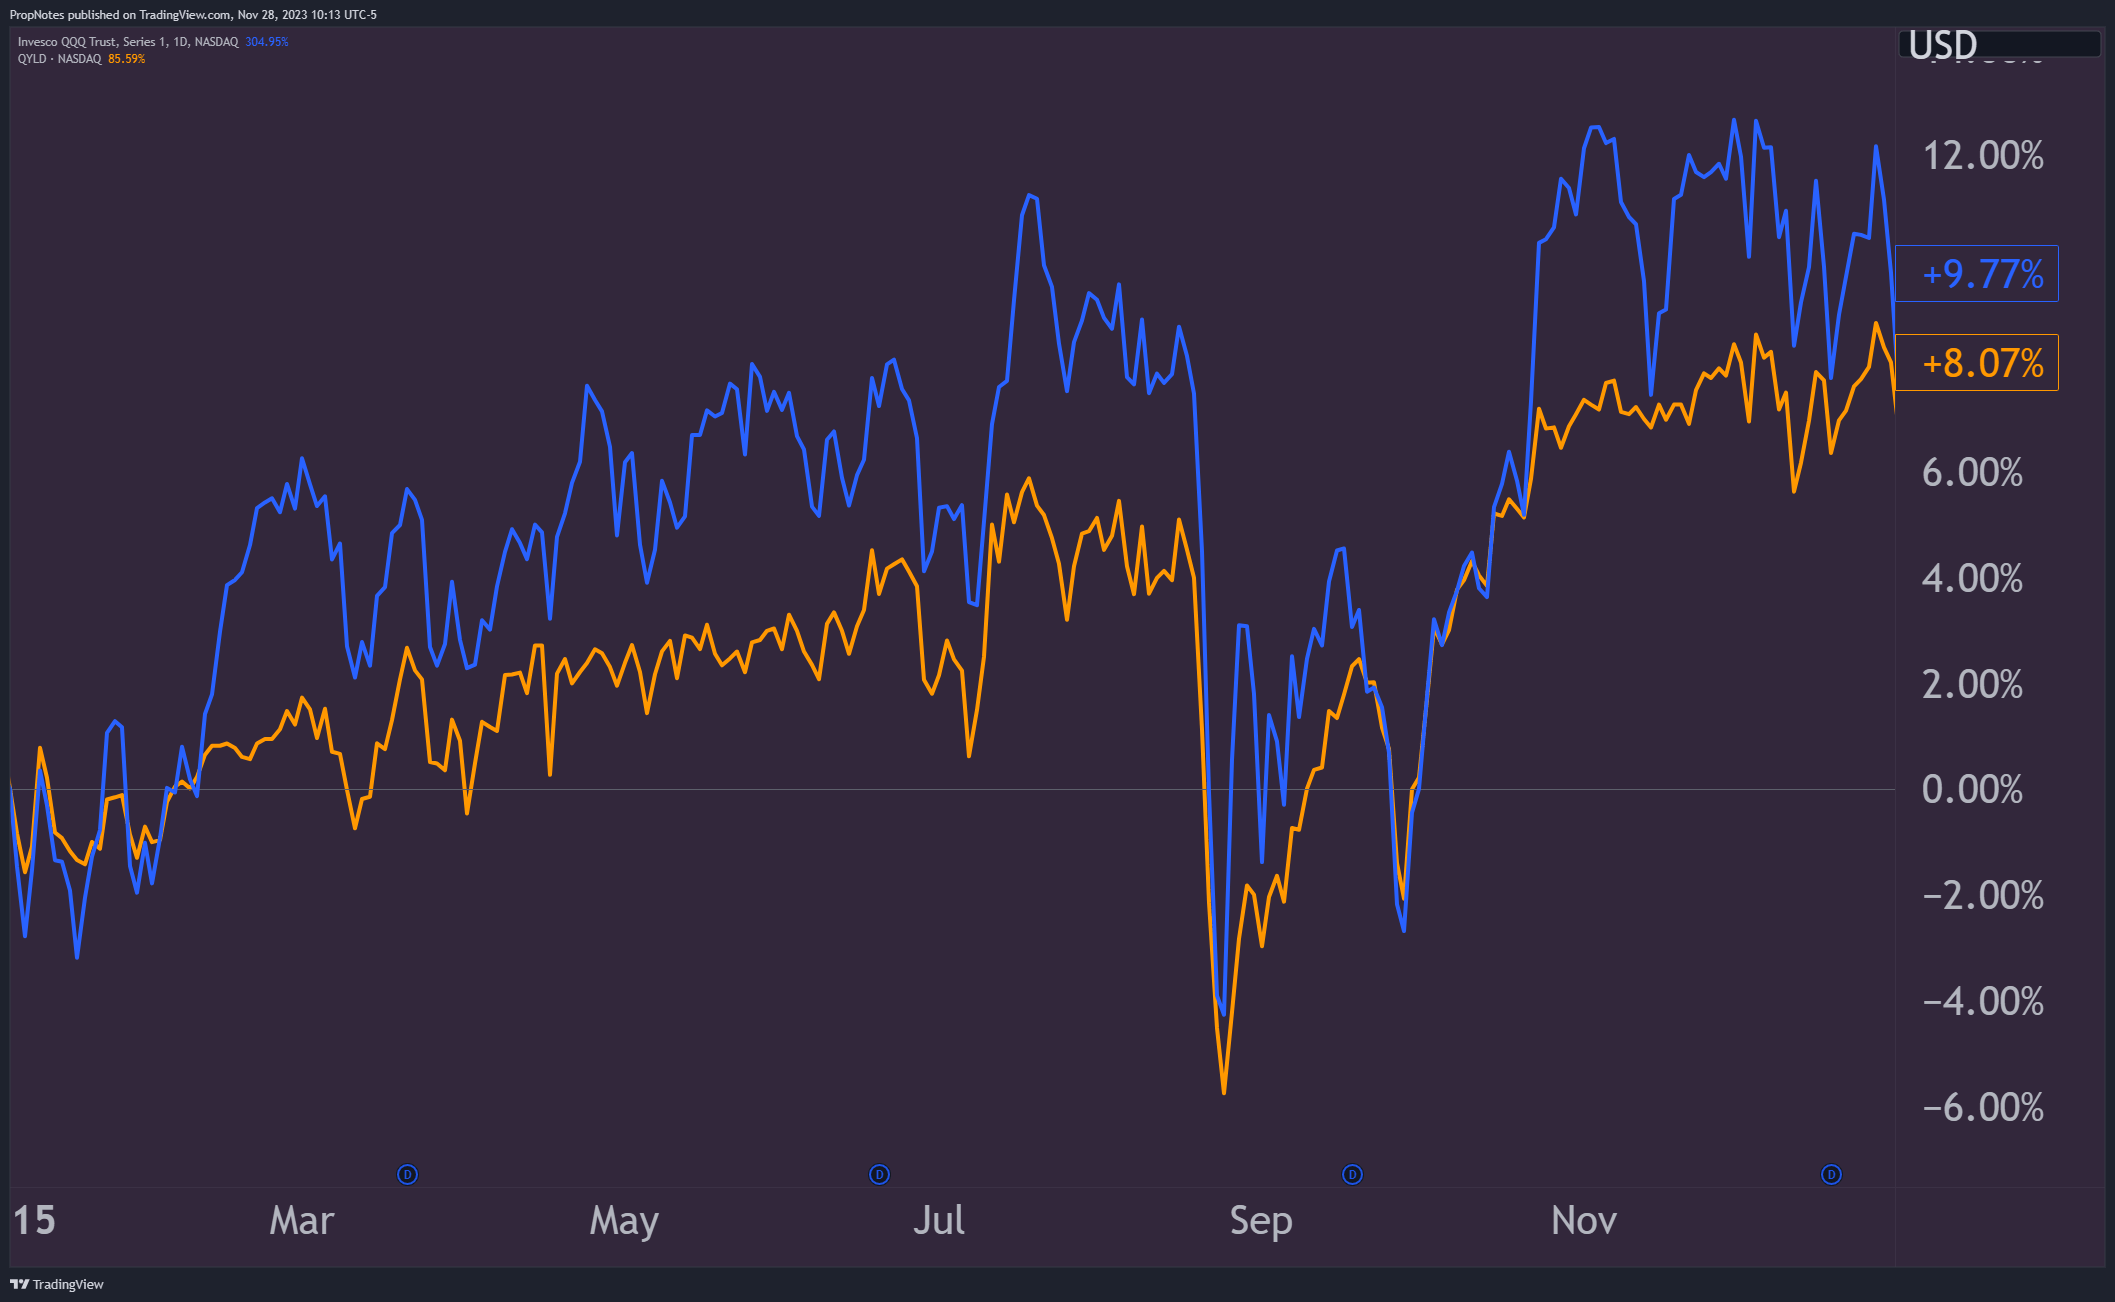
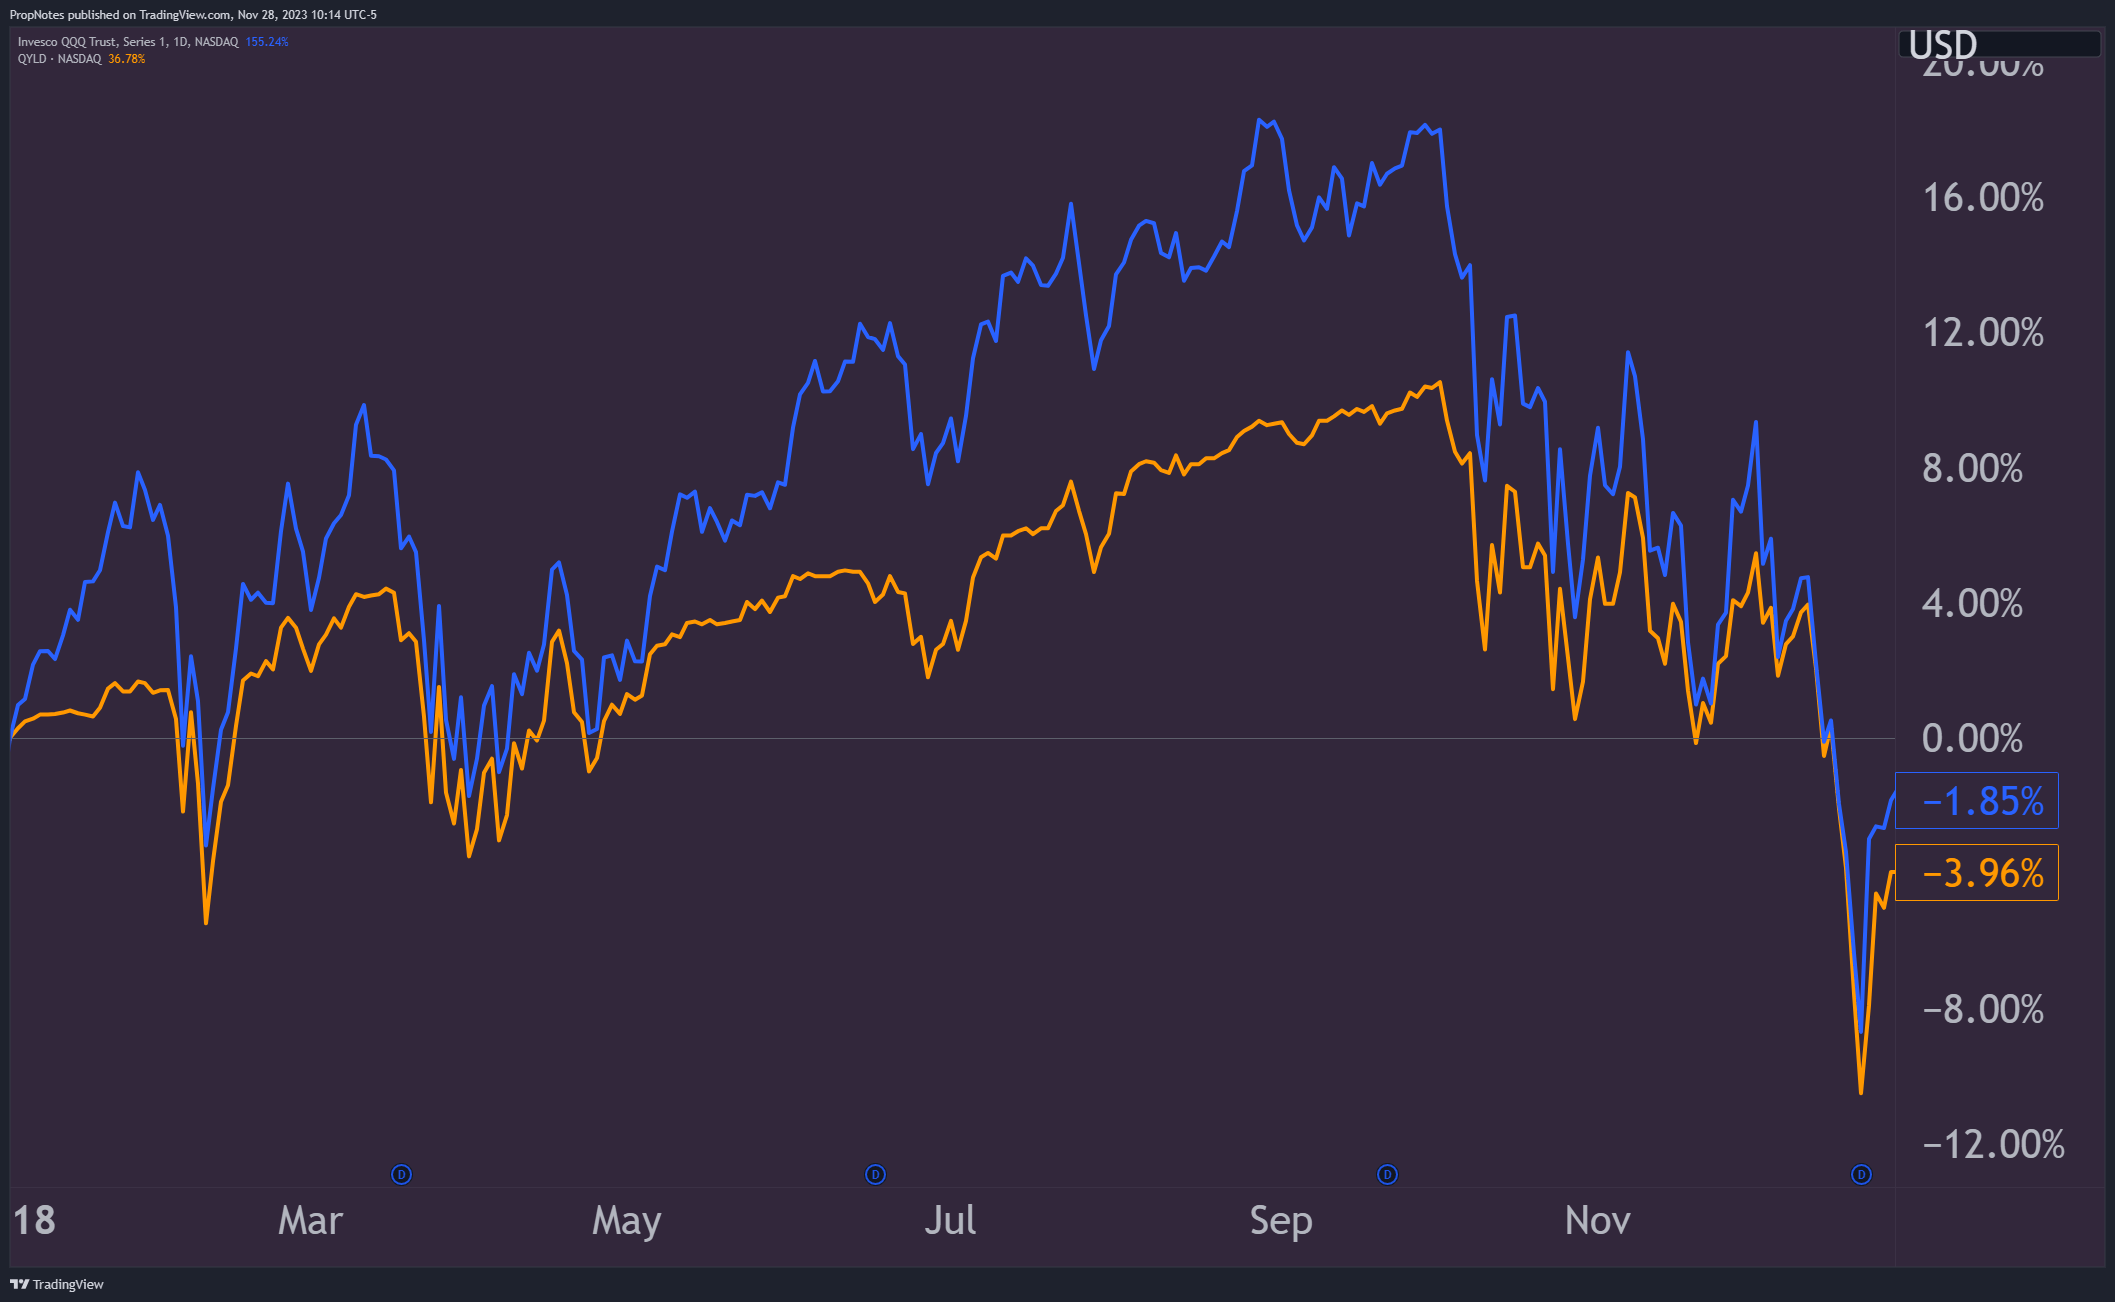
Something similar happened in 2020 following the Covid selloff, as QQQ outperformed QYLD 46.1% to 8.1%:
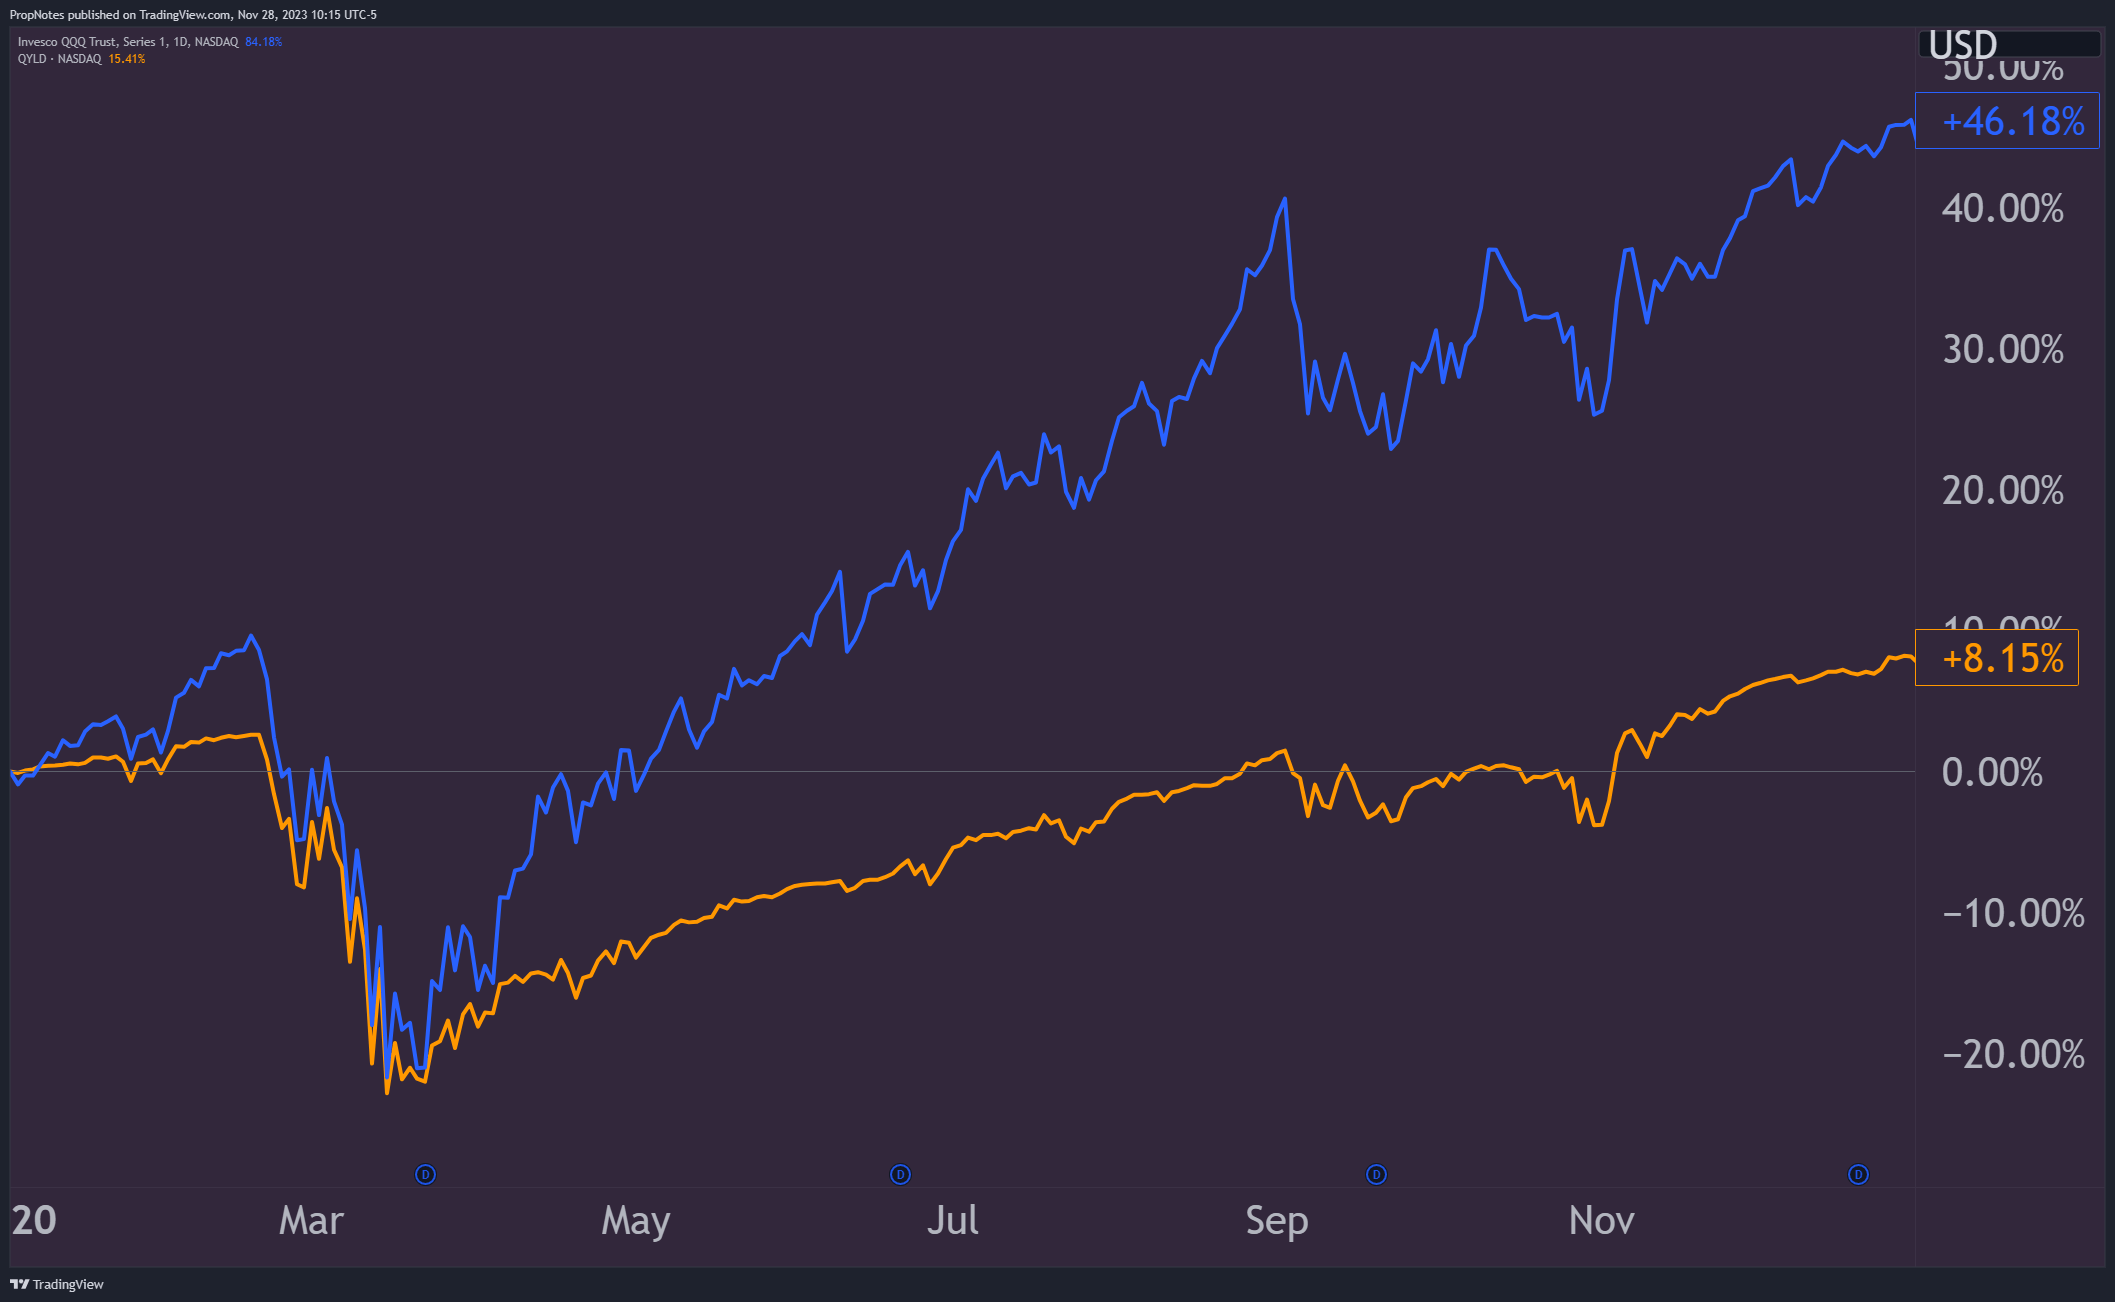
TradingView
In 2021, QQQ's performance trounced QYLD, with a total return of 27.7% vs. 10.9% for the laggard.
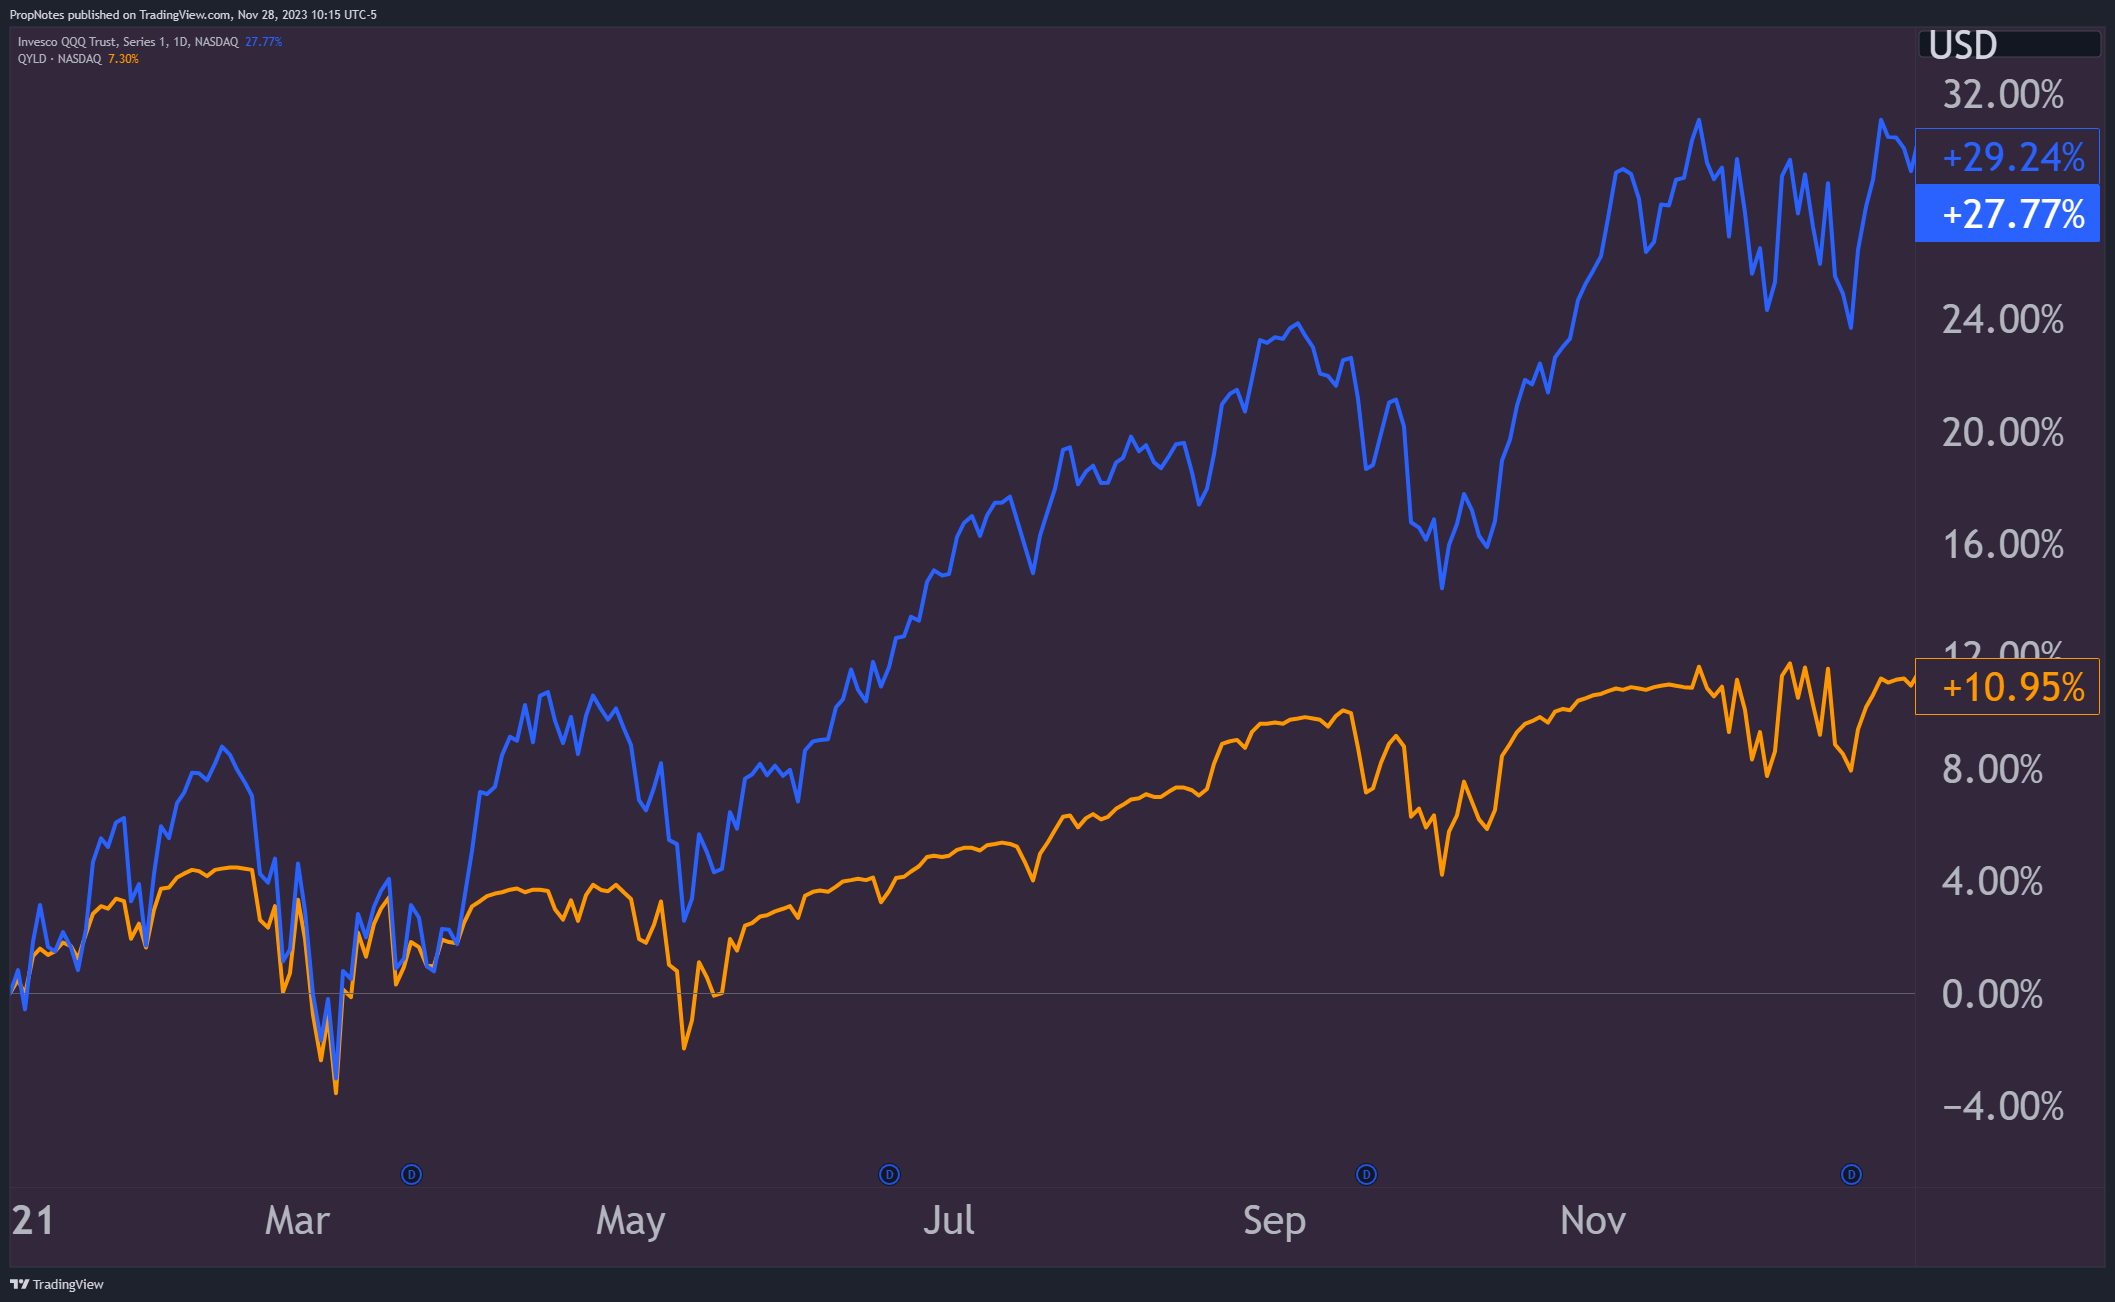
TradingView
2022 was the first and only year that QYLD outperformed QQQ, earning a total return of -19.6% vs. -33.6%:
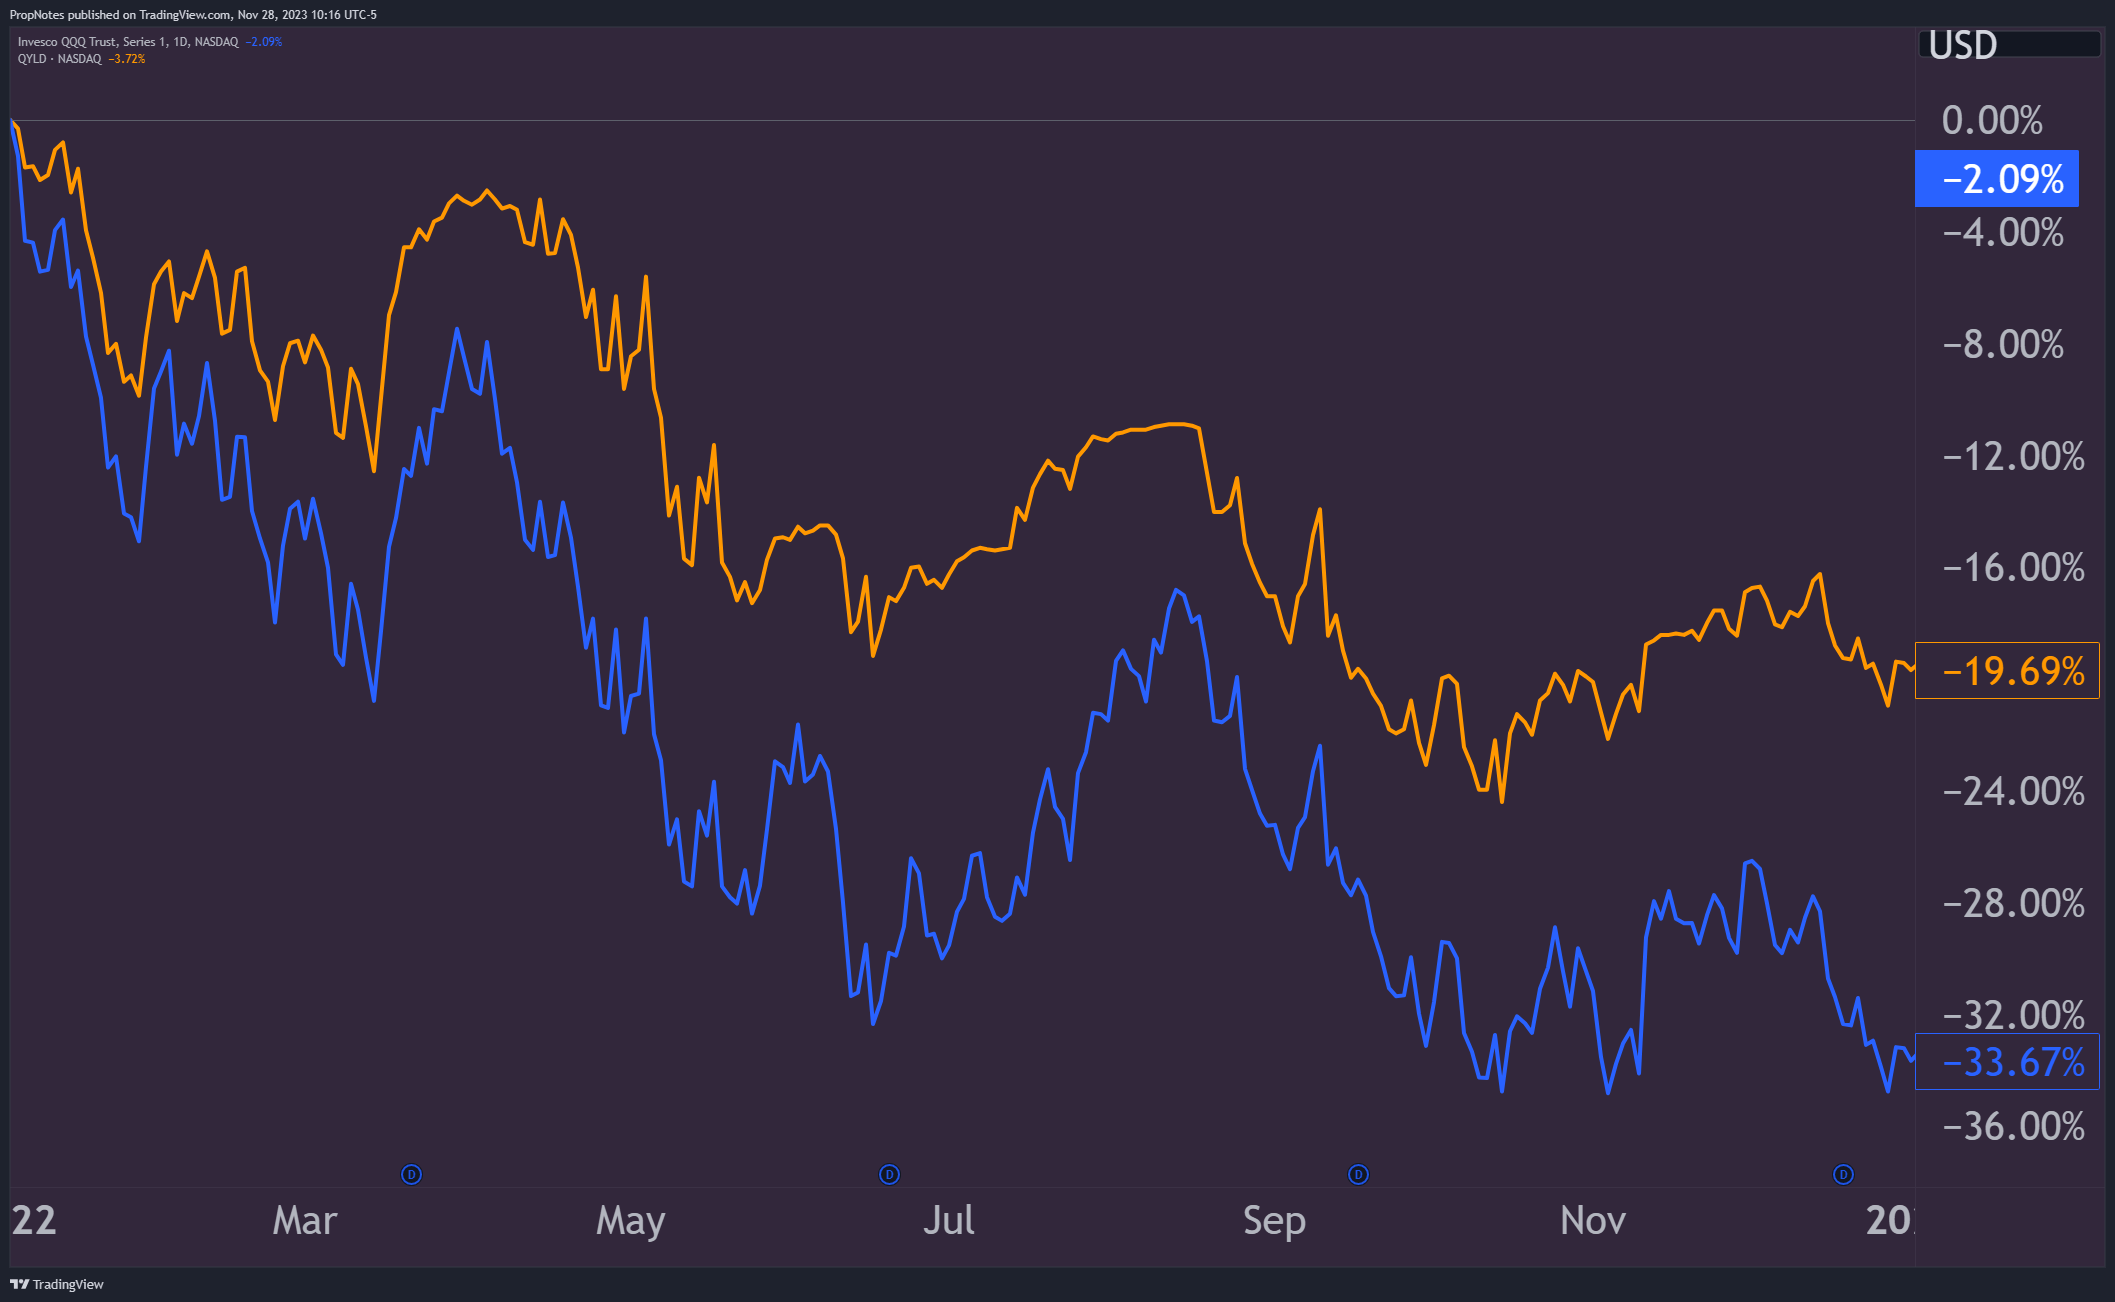
TradingView
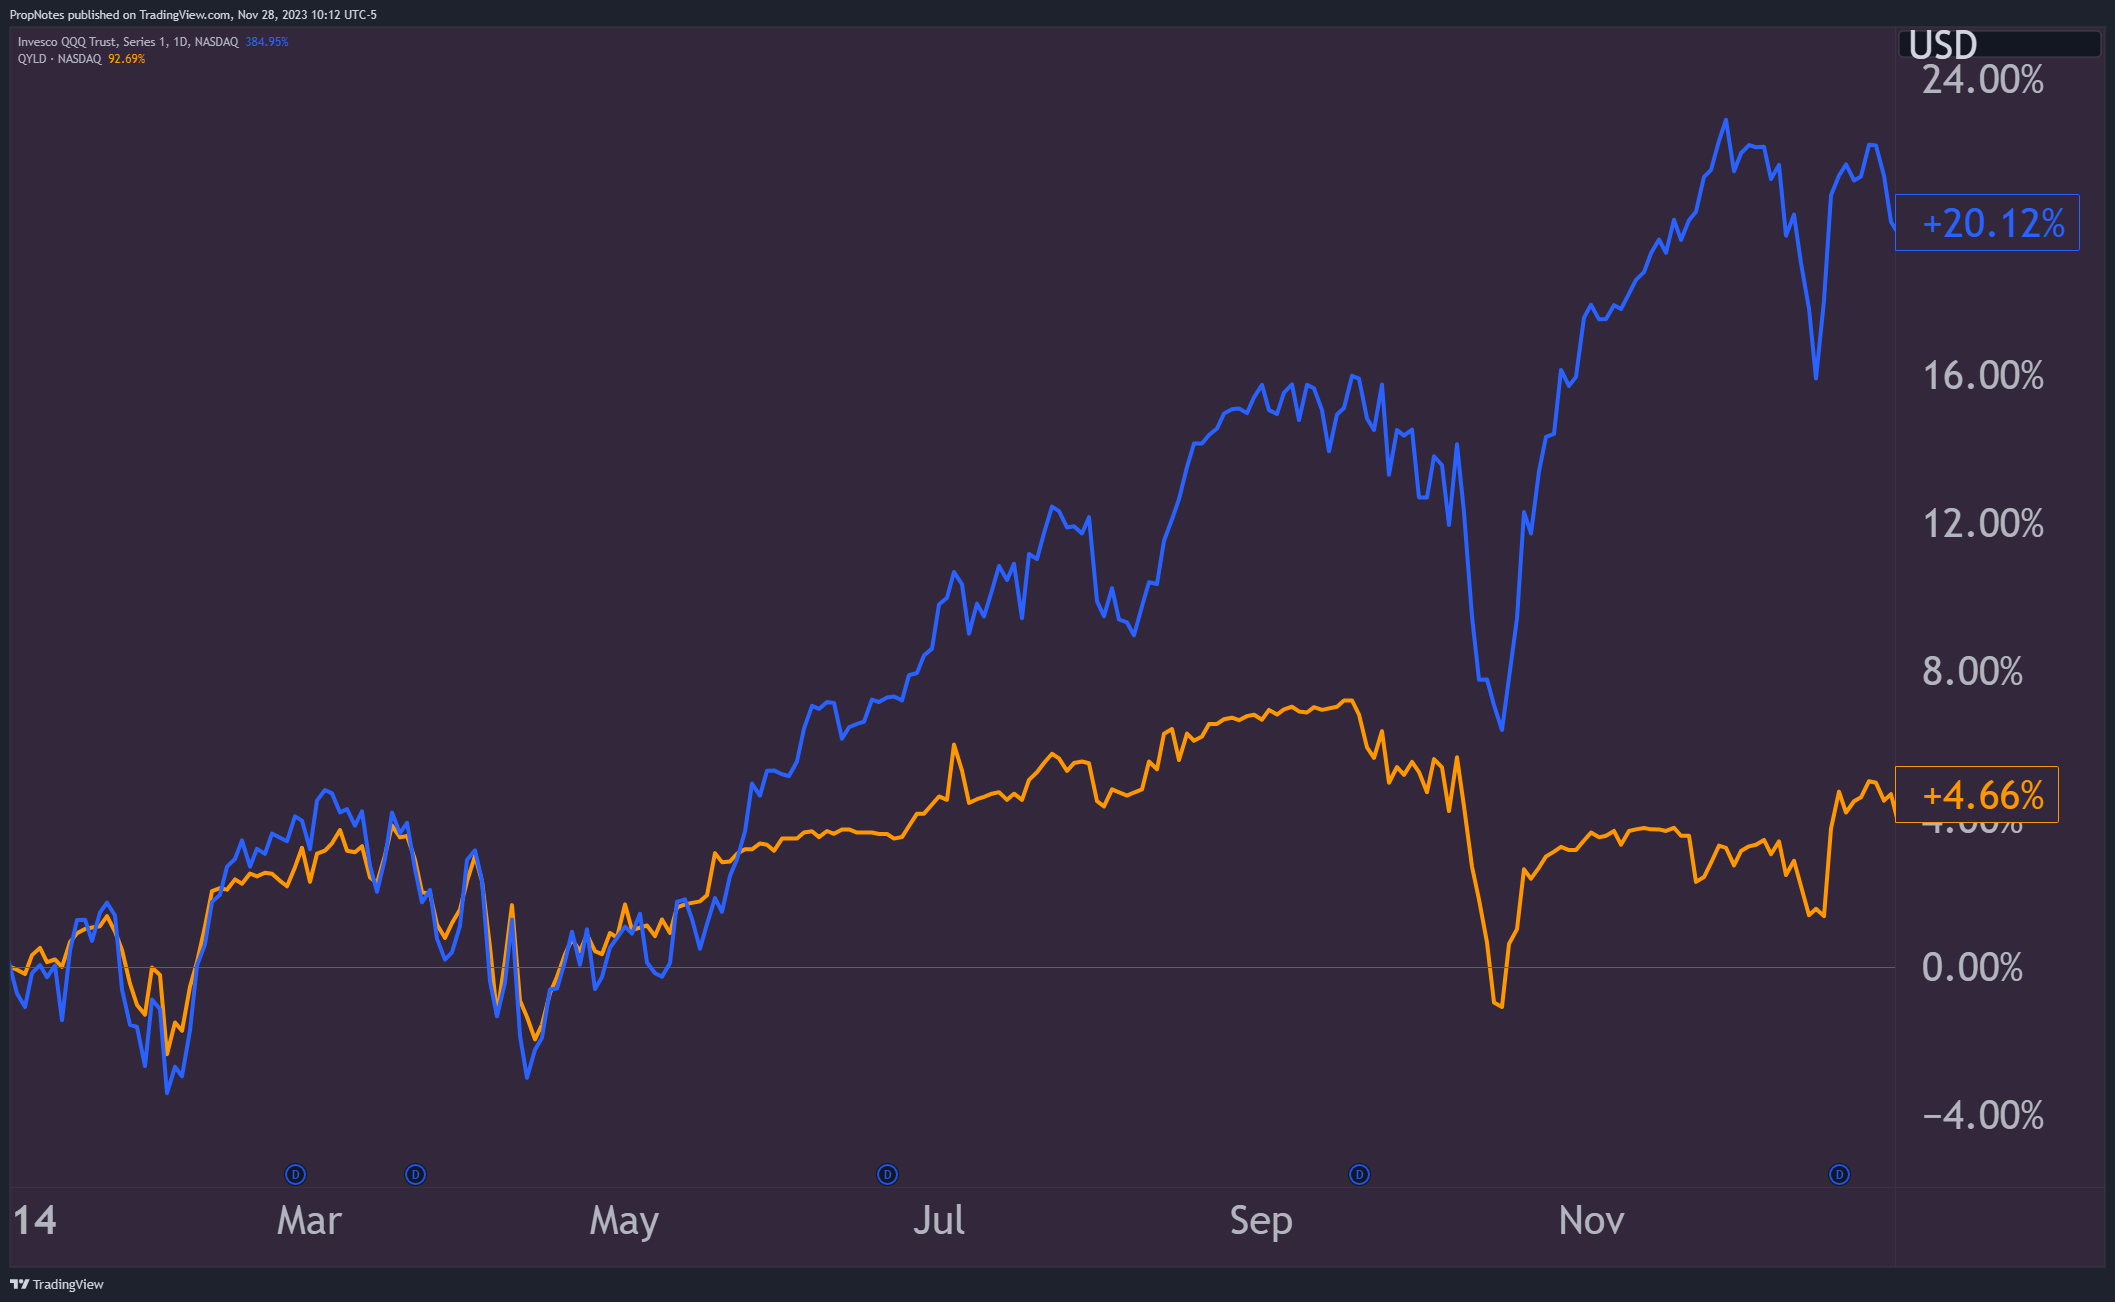
So far in 2023, it's been business as usual, with QQQ trumping QYLD with a total return of 47.6%, vs. 19.8% for the latter:
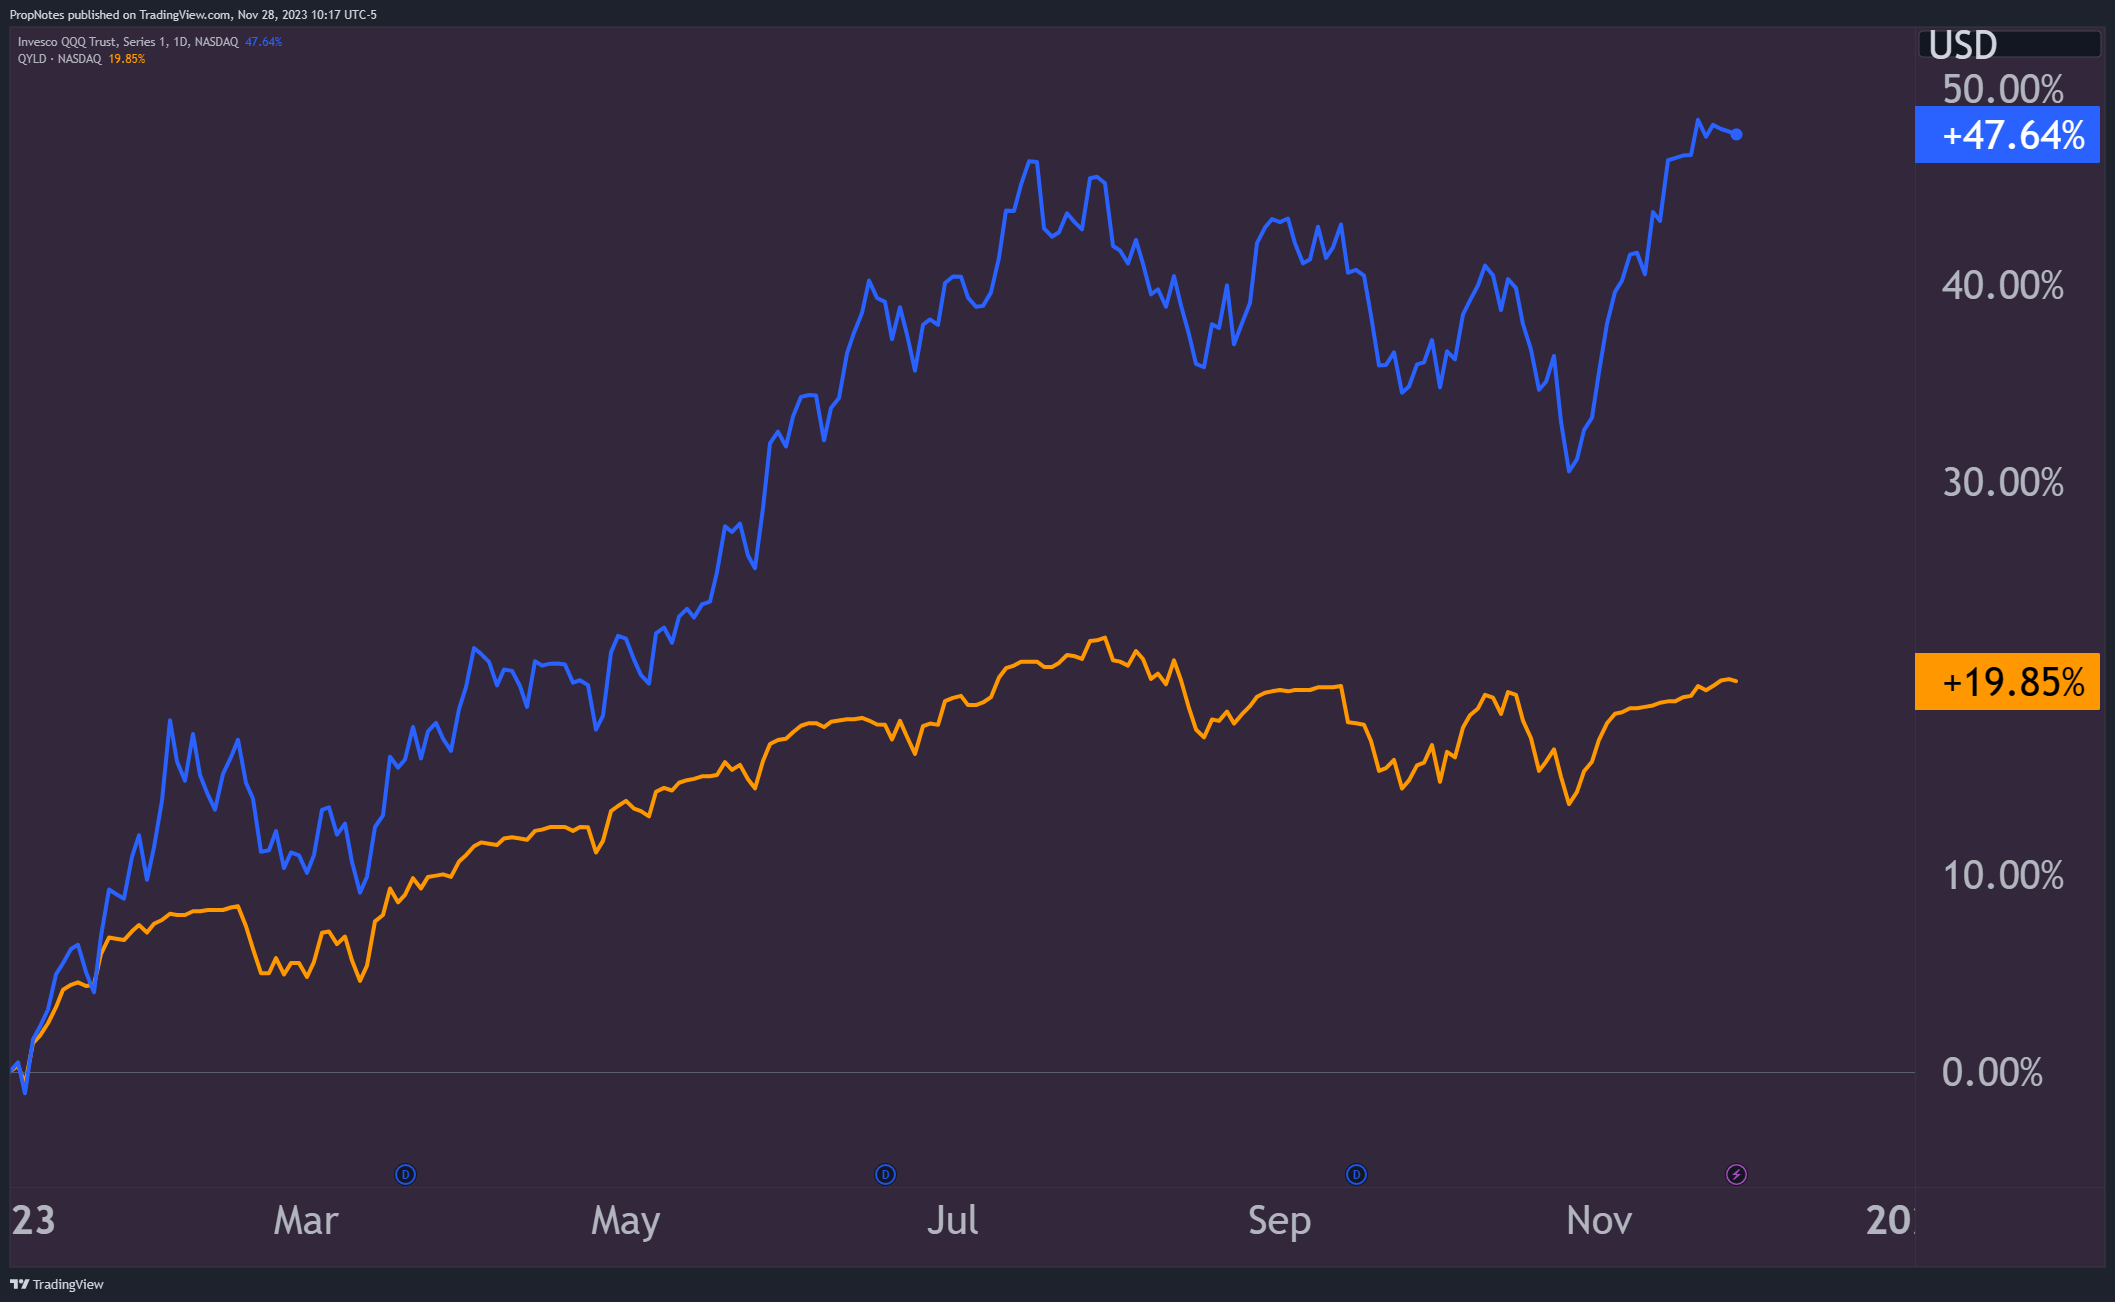
TradingView
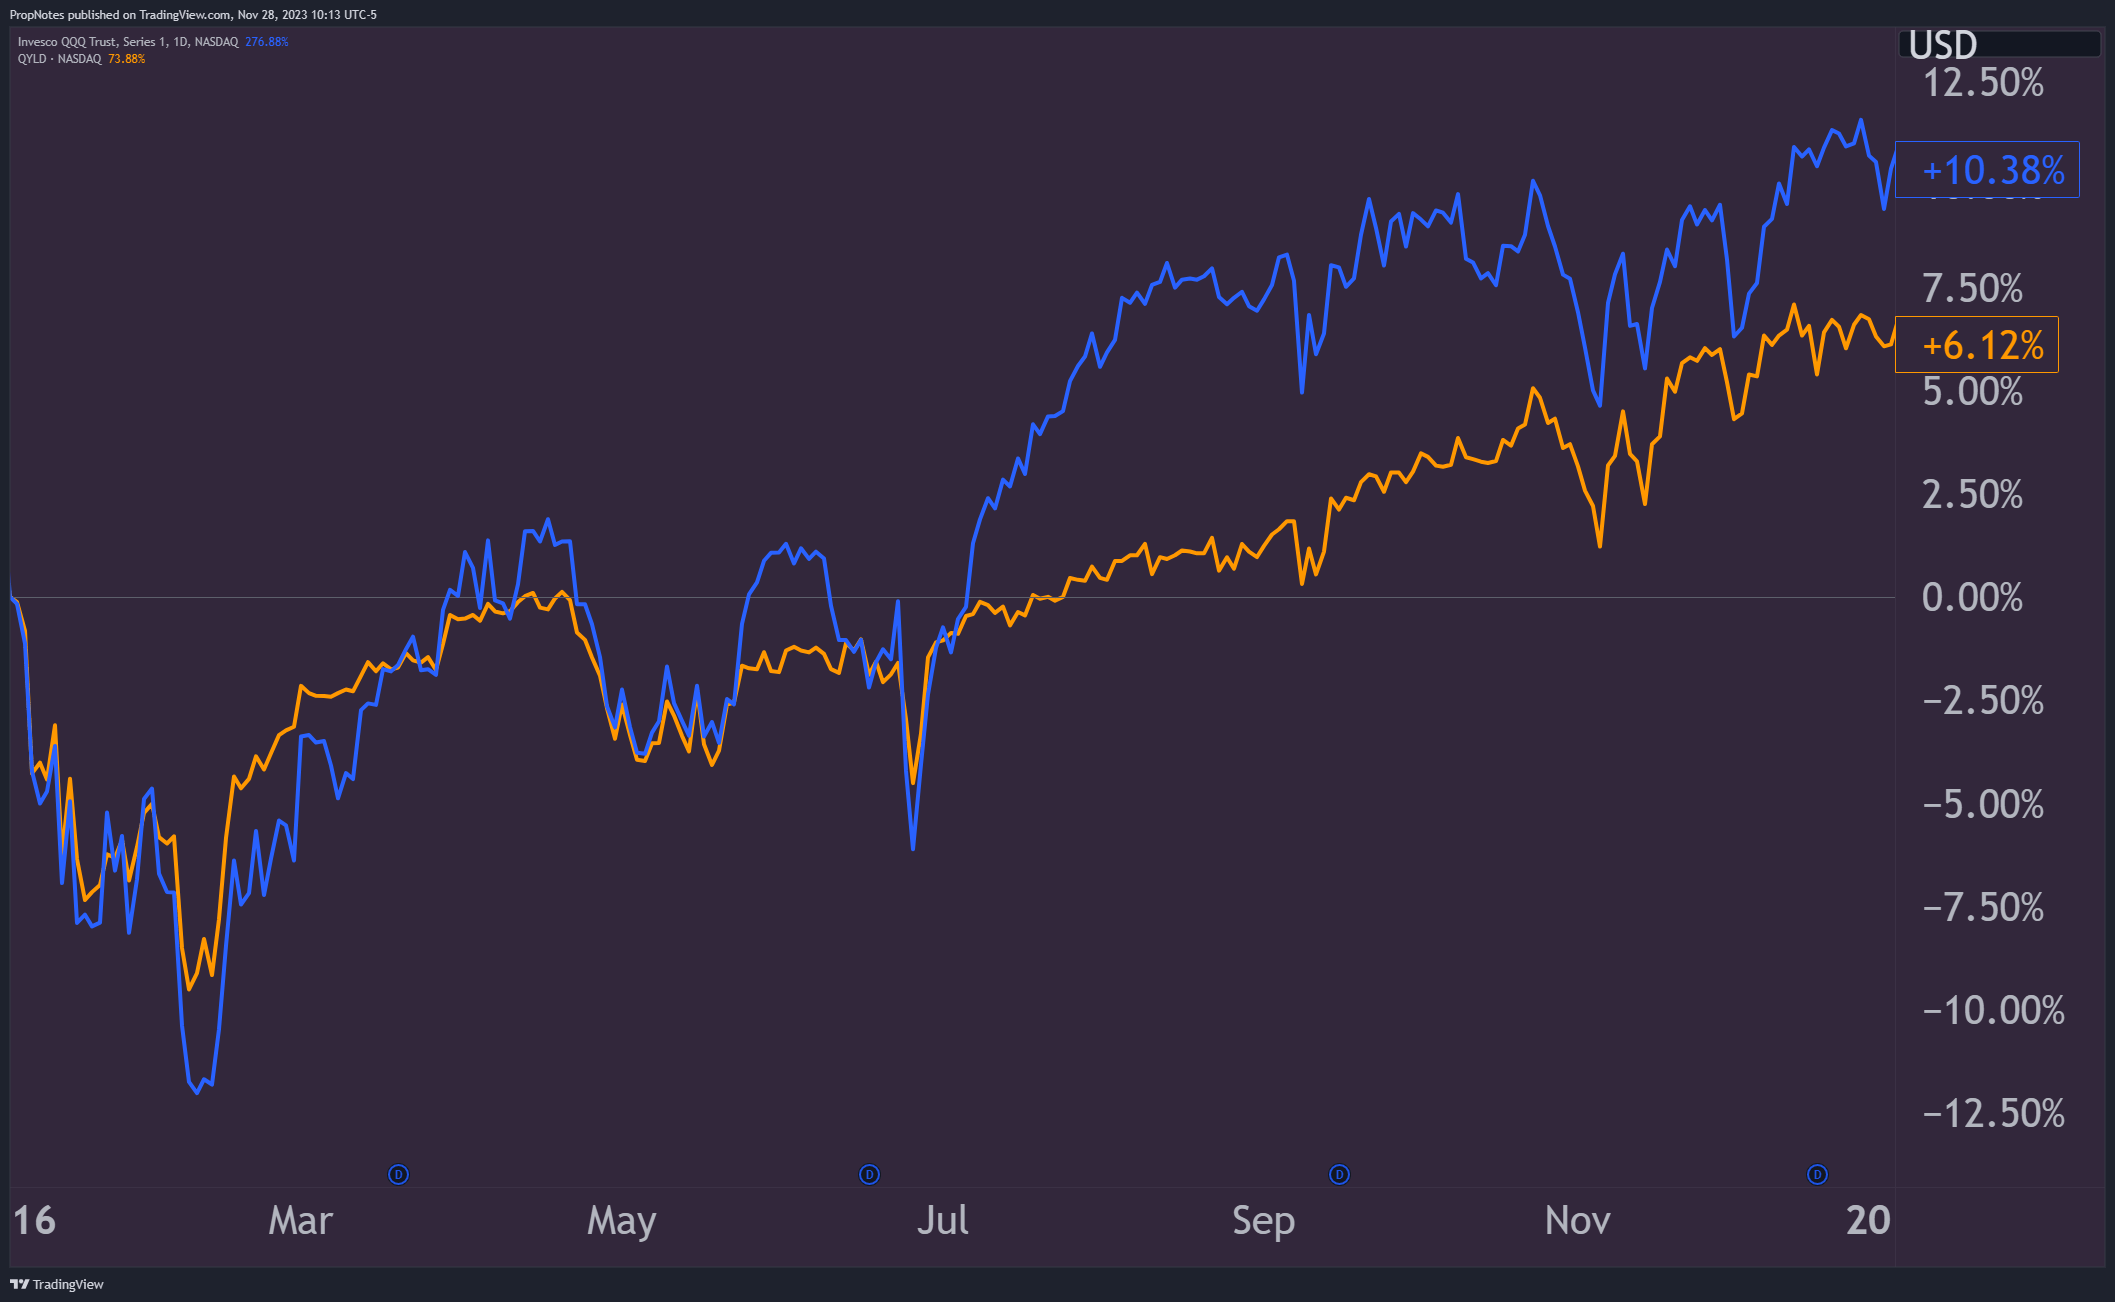
In summary, if you add up the collected underperformance, since inception, QYLD has underperformed its underlying index by more than 300% in total returns:
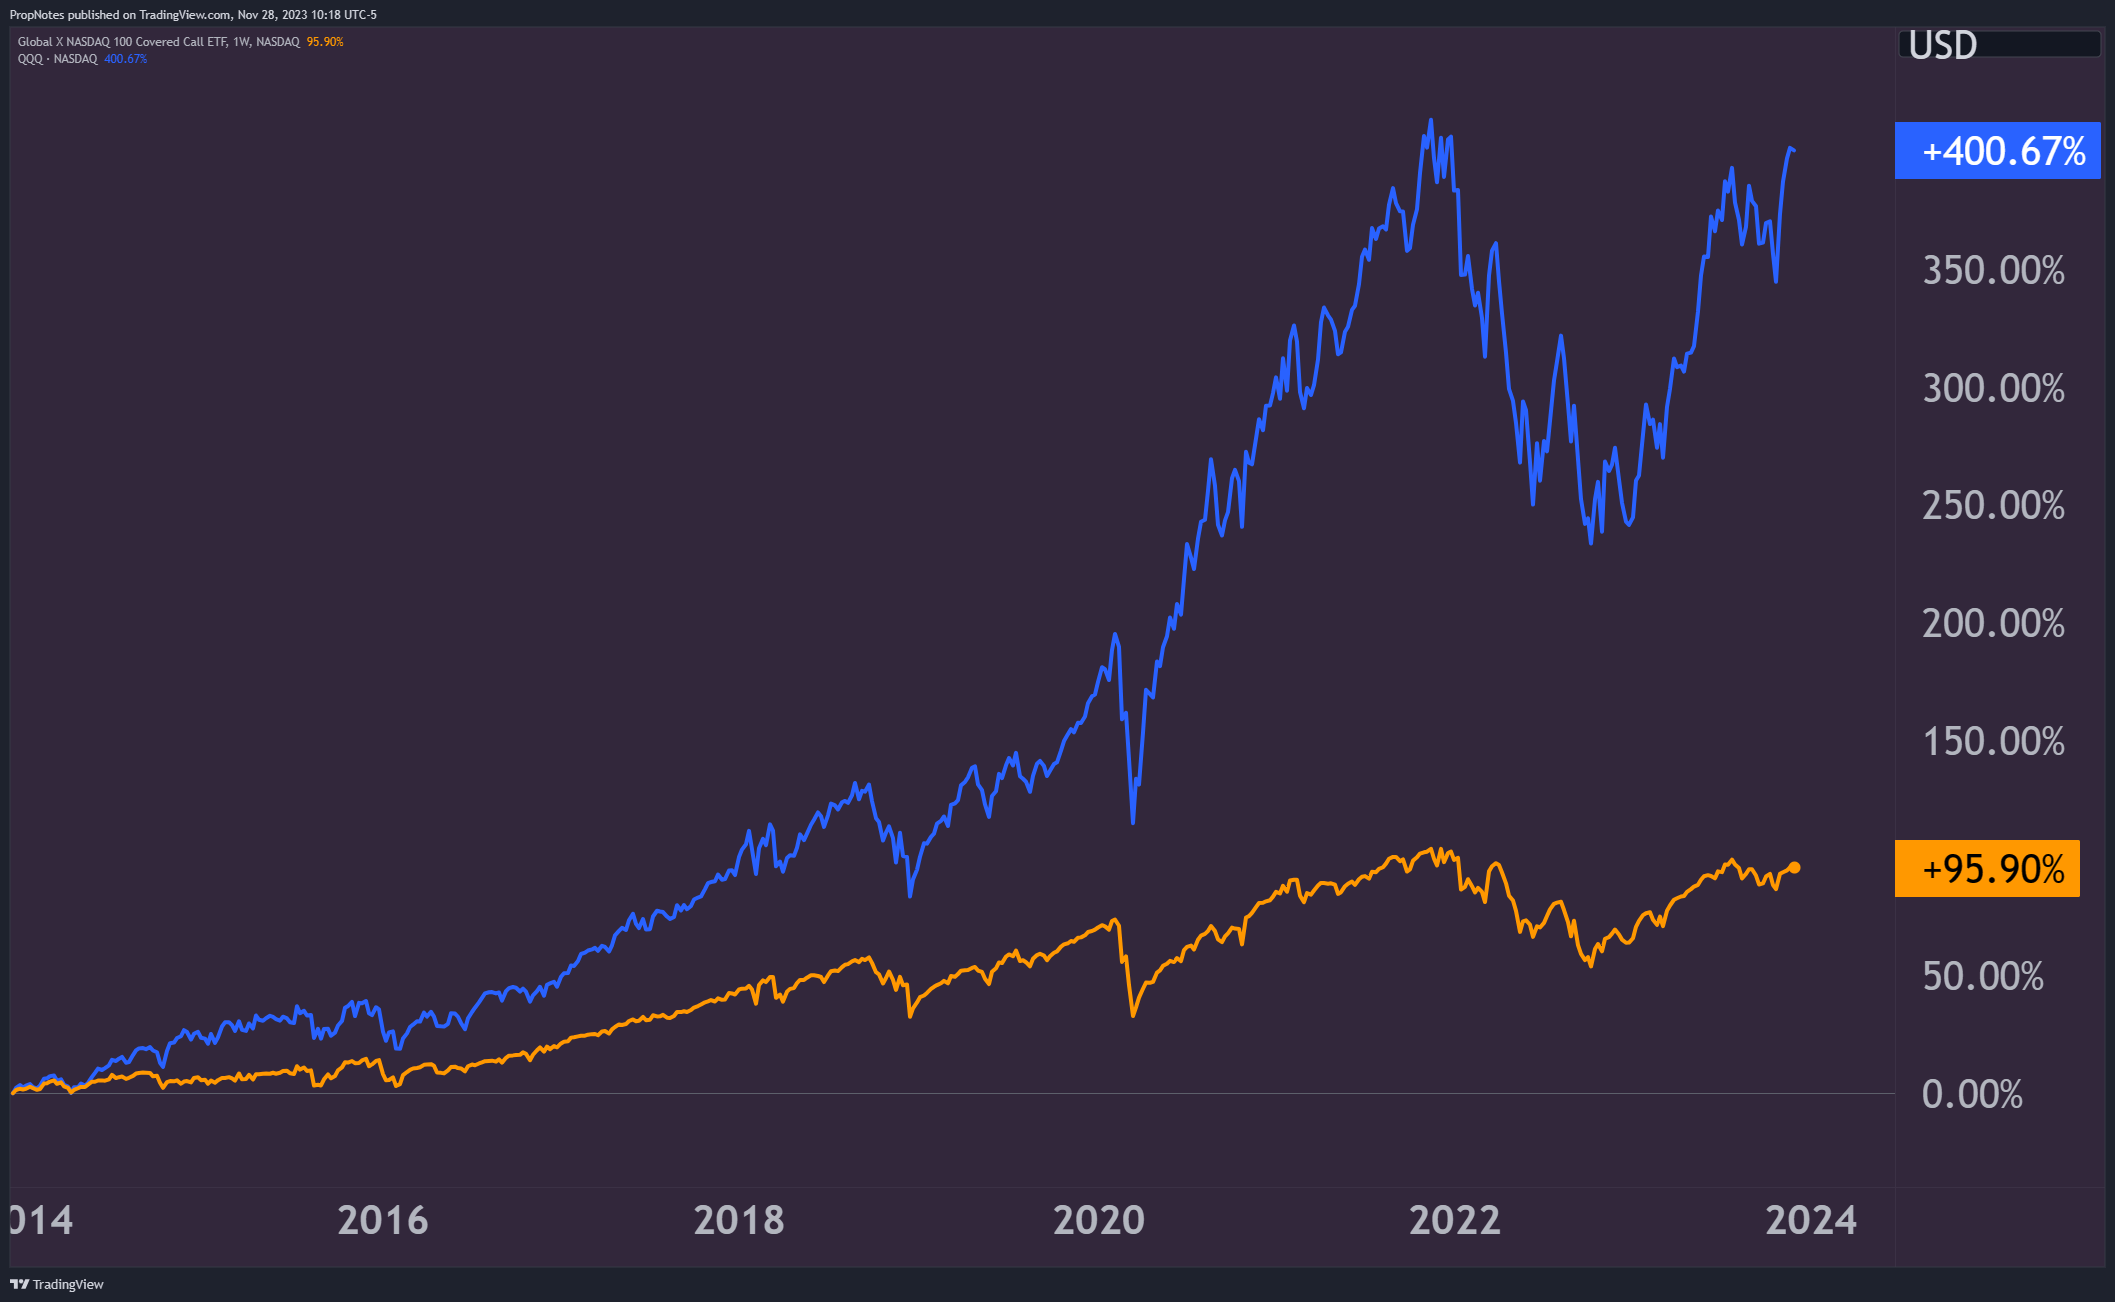
TradingView
Why discuss this in such detail?
In our eyes, there's really only two reasons that someone would think about owning QYLD: for total returns, or for income.
Given that the ETF outperforms the market incredibly infrequently, any argument for holding this ETF for total returns is essentially out the window. Additionally, if you look at the actual selloffs, like those in 2015, 2018, or 2020, QYLD's performance looks shockingly similar to QQQ.
It took one of the worst years on record for bonds, and a pretty gnarly year for stocks, in 2022, for QYLD to outperform. Plus, it's not like the ETF earned positive returns or anything; it beat its underlying by a mere 14 percentage points. In the grand scheme of things, that's an incredibly high cost to pay over the last decade for a relatively miniscule amount of hedging.
All in all, owning this name for total returns or as a portfolio hedge has proven to be a very costly endeavor over the years.
The Income Question
Now, onto the income question. The charts above mask a somewhat bitter truth - if you're invested for total returns, then you get to 'keep', on paper, the dividends.
In the real world, at the end of the day, if you're invested in QYLD for the income, all you have at the end of the month is the principal you invested in the position - the cash is out the door.
Thus, if you look at a chart of the two underlying instruments, things look a lot different for QYLD:
TradingView
QQQ is still up multiple hundreds of percent as a result of being invested in the top, world-beating U.S. stocks, but QYLD, simply as a byproduct of the ETF's strategy and distribution schedule, is down more than 30% over the same period of time.
Let's look at an example to show why there's an issue here.
In scenario 1, an income-oriented investor invests $100,000 into JPMorgan Chase ( JPM ), the largest bank in America:
Scenario 1 (Author's calculations)
In 2014, the investor buys 1,717 shares of JPM at $58.21 per share, and then sits and does nothing else in the ensuing decade.
In that time, the investor earns $48.5k in dividend income, and his income generating principal would be worth $263.5k at present-day prices.
JPM's yield remains low at only 2.7%, but the appreciation of the principal means that the investor's original 100k spent has a yield on cost of 7.5%:
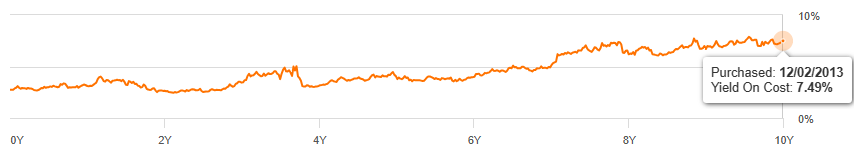
Seeking Alpha
In scenario 2, an income-oriented investor invests $100,000 into QYLD in 2014:
Scenario 2 (Author's Calculations)
On Jan 2nd, 2014, the investor purchases 3,930 shares of QYLD, which are trading at $25.44. Then, he sits and does nothing over the ensuing decade.
In that time, the investor earns $90k in dividend income, but his dividend generating principal, after that whole time, would be worth only about $67k.
QYLD's yield looks high at 12%, but given the depreciation of the principal, the investor's original 100k spent now has a yield on cost of only 8%, a 33% drop in earnings power over 10 years:
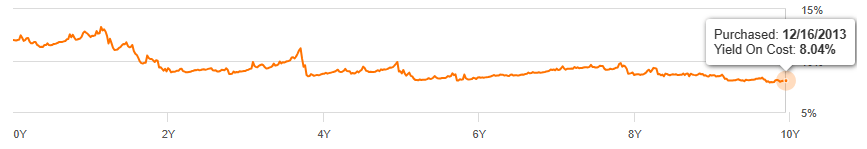
Seeking Alpha
Which of these two scenarios would you rather be in as an income investor?
In 10 years, the position in JPM earns nearly as much per year as the QYLD one does, and instead of fretting about dwindling principal, you're up more than 200%.
This is the difference between dividends that are paid out through a world-class business - a banking franchise in this case - vs. an ETF with a flawed execution structure. If JPM wasn't making any money, we'd bet that after some time they'd stop paying a dividend.
Yet, that isn't the case with QYLD.
Annuity Comparison
In this way, if you're looking to utilize QYLD as a yield machine, it's likely that you're not overly concerned with the value of the principal. This is where annuities become a good comparison.
An annuity is a contract between you and an insurance company in which you make a lump-sum payment (or series of payments), and in return, the insurance company pays you a regular income stream, either immediately or at some point in the future. Annuities are often used to provide oneself with a guaranteed income stream in retirement.
Given that QYLD's yield and principal seem to have a steady rate of decay based on a natural occurrence of unprofitable trades, one might be able to model out what investment makes more sense based on how long you think you might live:
Author Calculations
As you can see above, at year 20, an investment in QYLD still may have a value of 44% of the initial investment and have a yield on cost of 5.23%. Given that most fixed annuities pay out somewhere between 3.6% and 5.25% , buying QYLD in this context may not be the worst decision in the world if you're planning on checking out before then.
Plus, you get to keep your principal liquid in case of emergencies.
Summary
Outside of that, however, QYLD continues to be a substandard option for almost all investors; both those looking for a hedging tool, as well as anyone looking for income that has a holding period of longer than 10-15 years.
There's much better options out there, like SVOL . You can read more about that here .
Cheers!
For further details see:
QYLD: Stop Buying This ETF