VIG - RDVY: Dividend Growth ETF Overweight In Financials
2023-08-07 07:52:33 ET
Summary
- First Trust Rising Dividend Achievers ETF holds 50 stocks with growing dividends and EPS.
- RDVY is well-diversified across holdings, but overweight in financials.
- Past performance and quality metrics are above average.
- Risk metrics are high, and the dividend growth calculation is unreliable due to an outlier.
This article series aims at evaluating ETFs (exchange-traded funds) regarding past performance and portfolio metrics. Reviews with updated data are posted when necessary.
RDVY strategy and portfolio
First Trust Rising Dividend Achievers ETF ( RDVY ) started investing operations on 01/06/2014 and tracks the NASDAQ US Rising Dividend Achievers Index. RDVY has a portfolio of 50 stocks, a 12-month distribution rate of 2.35% and an expense ratio of 0.50%. Distributions are paid quarterly.
As described by First Trust , eligible companies must:
- be in the top 1,000 market capitalizations of the NASDAQ US Benchmark Index with an average daily trading volume over $5 million
- not be classified as REIT
- have paid a dividend in the trailing 12-month period greater than the dividend paid in the trailing 12-month period three and five years prior
- have EPS in the most recent fiscal year greater than in the 3 prior fiscal years
- have a cash-to-debt ratio above 50%
- have a trailing 12-month payout ratio below 65%
Companies passing these criteria are ranked by a factor combining dividend increase over the previous five years, current dividend yield, and payout ratio. The 50 best-ranked companies are included in equal weight. If exposure to a sector is over 30%, the lowest ranked company in that sector is replaced with the next highest ranked company from another sector. The portfolio is reconstituted annually and rebalanced quarterly.
Constituents are exclusively U.S. companies, with about 45% large caps, 40% mid-caps and 15% small caps.
The fund is overweight in financials with 31.3% of asset value in this sector, which is slightly above the limit fixed in the underlying index (on rebalancing). Industrials, materials, energy and technology are between 12% and 16%. Other sectors are below 8% individually and 17% in aggregate. Compared to the S&P 500 ( SPY ), RDVY massively overweights financials, industrials, materials and energy. It underweights other sectors, and ignores real estate and utilities.
Sector breakdown ( chart: author, data: First Trust, SSGA)
All positions are reset in equal-weight at every rebalancing, but they may drift with price action. The current top 10 holdings, listed in the next table with fundamental ratios, are the constituents with the highest momentum since the last rebalancing. Their aggregate weight is 22% and the top name weighs only 2.38%, so the portfolio is well-diversified and risks related to individual companies stay low.
| Ticker |
| Name |
| Weight |
| EPS growth % ttm |
| P/E ttm |
| P/E fwd |
| Yield |
| Comerica, Inc. |
| 2.38% |
| 39.79 |
| 5.52 |
| 6.98 |
| 5.36 |
| Popular, Inc. |
| 2.26% |
| 21.99 |
| 5.38 |
| 9.39 |
| 3.01 |
| MGIC Investment Corp. |
| 2.24% |
| 14.52 |
| 6.82 |
| 7.97 |
| 2.56 |
| Citizens Financial Group, Inc. |
| 2.18% |
| 11.44 |
| 7.10 |
| 8.15 |
| 5.38 |
| CF Industries Holdings, Inc. |
| 2.17% |
| -0.91 |
| 6.72 |
| 10.16 |
| 1.97 |
| Regions Financial Corp. |
| 2.17% |
| 5.28 |
| 8.79 |
| 8.74 |
| 4.66 |
| Archer-Daniels-Midland Co. |
| 2.16% |
| 18.12 |
| 11.42 |
| 11.86 |
| 2.10 |
| Lam Research Corp. |
| 2.15% |
| 1.20 |
| 20.83 |
| 25.14 |
| 1.00 |
| Huntington Bancshares, Inc. |
| 2.13% |
| 37.85 |
| 7.86 |
| 8.87 |
| 5.09 |
| Aflac, Inc. |
| 2.11% |
| 12.66 |
| 10.29 |
| 13.04 |
| 2.19 |
Ratios from Portfolio123
Past performance
The next table compares performance and risk metrics since January 2014 of RDVY, SPY and three popular dividend growth ETFs:
- Vanguard Dividend Appreciation Index Fund ( VIG )
- ProShares S&P 500 Dividend Aristocrats ETF ( NOBL )
- WisdomTree U.S. Quality Dividend Growth Fund ( DGRW )
Since inception, RDVY is almost on par with the S&P 500 ETF in return, and it is significantly riskier regarding volatility and drawdowns. DGRW is the best performer of the list in return and risk-adjusted performance (Sharpe ratio).
| Total Return |
| Annual Return |
| Drawdown |
| Sharpe ratio |
| Volatility |
| RDVY |
| 190.55% |
| 11.80% |
| -40.60% |
| 0.67 |
| 18.58% |
| VIG |
| 166.60% |
| 10.80% |
| -31.72% |
| 0.79 |
| 13.60% |
| NOBL |
| 166.05% |
| 10.77% |
| -35.43% |
| 0.74 |
| 14.52% |
| DGRW |
| 199.75% |
| 12.16% |
| -32.04% |
| 0.84 |
| 14.25% |
| SPY |
| 192.43% |
| 11.87% |
| -33.72% |
| 0.78 |
| 15.12% |
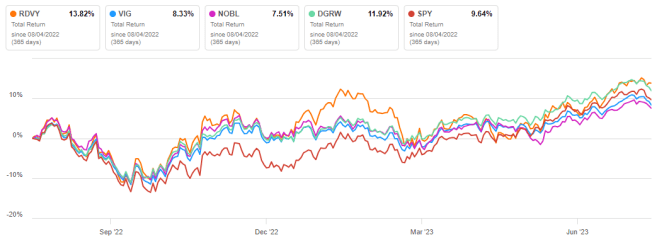
For the last 12 months, RDVY beats them all, ahead of DGRW by a short margin:
RDVY vs competitors and benchmark, last 12 months (Seeking Alpha)
In previous articles, I have shown how three factors may help cut the risk in a dividend portfolio: Return on Assets , Piotroski F-score , and Altman Z-score .
The next table compares RDVY with a subset of the S&P 500: stocks with an above-average dividend yield, an above-average ROA, a good Altman Z-score, a good Piotroski F-score and a sustainable payout ratio. The subset is rebalanced annually to make it comparable with a passive index.
| Total Return |
| Annual Return |
| Drawdown |
| Sharpe ratio |
| Volatility |
| RDVY |
| 190.55% |
| 11.80% |
| -40.60% |
| 0.67 |
| 18.58% |
| Large cap reference subset |
| 203.43% |
| 12.31% |
| -34.92% |
| 0.79 |
| 15.50% |
P ast performance is not a guarantee of future returns. Data Source: Portfolio123
The dividend quality subset outperforms RDVY and shows safer risk metrics. A note of caution: ETF performance is real and this subset simulation is hypothetical. My dividend quality portfolio holds 14 stocks selected in this subset (more info at the end of this post).
The sum of annual distributions per share was $0.42 in 2014 and $0.97 in 2022. It is an annualized dividend growth rate of 11%, which looks excellent. However, the next chart shows that the growth has not been steady: 2022 was an outlier. The 2022 growth represents 78% of the 8-year growth, so the annualized rate of 11% is unlikely to be representative of the future.
RDVY distribution history (Seeking Alpha)
Scanning RDVY portfolio
The usual valuation metrics, reported in the next table, are cheaper than for the S&P 500. However, fundamentals are biased by the weight of financials, where valuation ratios are lower and unreliable (the sector benchmark XLF has a price-to-book ratio of 1.84 vs. 4.1 for the S&P 500). Therefore, the numbers below must be considered with caution.
| RDVY |
| SPY |
| Price/Earnings TTM |
| 9.26 |
| 23.32 |
| Price/Book |
| 1.98 |
| 4.1 |
| Price/Sales |
| 1.69 |
| 2.62 |
| Price/Cash Flow |
| 7.56 |
| 16.37 |
Source: Fidelity
According to my calculations, the aggregate ROA is better than for the S&P 500 ( SPY ). The aggregate Altman Z-score and Piotroski F-score are similar.
| RDVY |
| SPY |
| Atman Z-score |
| 3.58 |
| 3.55 |
| Piotroski F-score |
| 5.53 |
| 5.56 |
| ROA % TTM |
| 9.95 |
| 7.22 |
The ROA points to a portfolio quality superior to the benchmark.
In my ETF reviews, risky stocks are companies with at least 2 red flags among: bad Piotroski score, negative ROA, unsustainable payout ratio, bad or dubious Altman Z-score, excluding financials and real estate where these metrics are less relevant. With these assumptions, RDVY holds only one risky stock: Micron Technology Inc. ( MU ) has a bad Piotroski F-score and a negative ROA. It weighs only 2% of assets, which is an excellent point (but once again, financials are not taken into account).
Takeaway
First Trust Rising Dividend Achievers ETF holds 50 stocks with growing dividends and EPS. Thanks to the equal-weight methodology, risks related to individual companies are low. However, the fund is overweight in financials. For this reason, the cheap valuation ratios are unreliable. Portfolio quality is superior to the benchmark and past performance is above average among competitors. However, risk metrics are quite high and the calculated dividend growth rate is unreliable due to last year's outlier.
For further details see:
RDVY: Dividend Growth ETF Overweight In Financials