SLRC - REITs To The Moon
2023-11-14 17:51:52 ET
Summary
- REITs experienced significant gains, outperforming other sectors.
- Investors are hesitant to own REITs during rising interest rates but don't want to miss out when rates fall. There's no time between rates falling and REITs rising.
- Lower interest rates can lead to higher profits and dividend growth for equity REITs, making them more attractive to income-seeking investors.
- Many preferred shares still offer extremely attractive returns through fixed-to-floating shares.
REITs ripped higher today. Nearly anything that can be called a REIT posted a big gain. They put other sectors to shame. There's a clear lesson here.
Investors are scared to own REITs when rates are rising, but they really don't want to miss out when rates fall. It was interesting to see the drop in rates sending equity REITs and mortgage REITs higher together.
These REITs appear to be headed to the moon, right where real estate belongs:
TheREITForum.com
Impact on Equity REITs
Equity REITs are companies that own, operate, or finance income-producing real estate across a range of property sectors. They offer a way for individuals to invest in large-scale, income-producing real estate. A REIT's mode of operation is simple: It leases space and collects rent on the properties, then distributes that income as dividends to shareholders.
As interest rates rise, the cost of financing property purchases or developments increases for REITs. This increase can lead to slower growth in their portfolios. Moreover, as alternative income investments like bonds become more appealing due to higher yields, investors may shift their focus away from REITs, causing their prices to fall.
Real estate is sometimes considered a bond proxy because, like bonds, it typically generates a steady income stream. When interest rates rise, bond yields generally increase, making bonds more attractive compared to REITs. This shift can cause investors to prefer bonds over real estate, leading to a decrease in demand and potentially lower prices for REITs.
Conversely, when interest rates start to decrease, the scenario flips. Lower interest rates mean lower borrowing costs for REITs, potentially leading to higher profits and more robust dividend growth. This makes REITs more attractive to income-seeking investors.
While interest rates are a significant factor, they are not the only one affecting REITs. Factors like the general economic condition, real estate market trends, and specific sector performance (such as commercial, residential, industrial) also play a crucial role.
Impact on Mortgage REITs
Mortgage Real Estate Investment Trusts (mREITs) operate differently from traditional REITs that own physical properties. Here's an overview of how they function:
Mortgage REITs primarily focus on investing in and owning mortgage-related assets, rather than physical real estate. They deal with both residential and commercial mortgage loans and mortgage-backed securities (MBS).
A distinctive feature of mREITs is their extensive use of leverage, which means they often borrow money to finance their investments. By doing so, they can potentially increase their returns on equity. However, this also increases their risk, especially in volatile interest rate environments.
Mortgage REITs profit from the spread between the interest income on these mortgage assets and the cost of their funding. This spread is often referred to as the net interest margin.
The general impact on mortgage REITs is pretty simple. In theory, lower interest rates will lead to higher book value. In practice, it doesn't always work. Volatility in interest rates is generally bad for mortgage REITs. However, rates increased so dramatically that the dip in rates is a nice development for them.
My Investments
I have relatively small allocations in the mortgage REIT common shares and BDC shares. The majority of my positions are in the preferred shares and the equity REITs. Within preferred shares, I'm primarily using fixed-to-floating shares.
These shares start out with a fixed-rate dividend, and then switch over to a floating-rate dividend.
Floating-rate preferred shares have dividends that adjust with changes in interest rates. This feature makes them less sensitive to interest rate fluctuations compared to fixed-rate preferred shares. When interest rates rise, the payouts on these shares increase, which helps protect investors from the declining market value that typically affects fixed-income securities.
Thankfully some of these fixed-to-floating shares remain cheap, even though their floating dates are quickly approaching.
Investors may not significantly value the floating-rate feature until the point where the rate is about to adjust, especially if the initial fixed rate is not particularly high. This is because the true benefit of a floating-rate preferred share - its ability to provide higher yields in a rising interest rate environment - becomes more tangible and imminent as the adjustment date approaches. Therefore, I'm interested in buying those shares before the market price adjusts to reflect the much higher dividend rate.
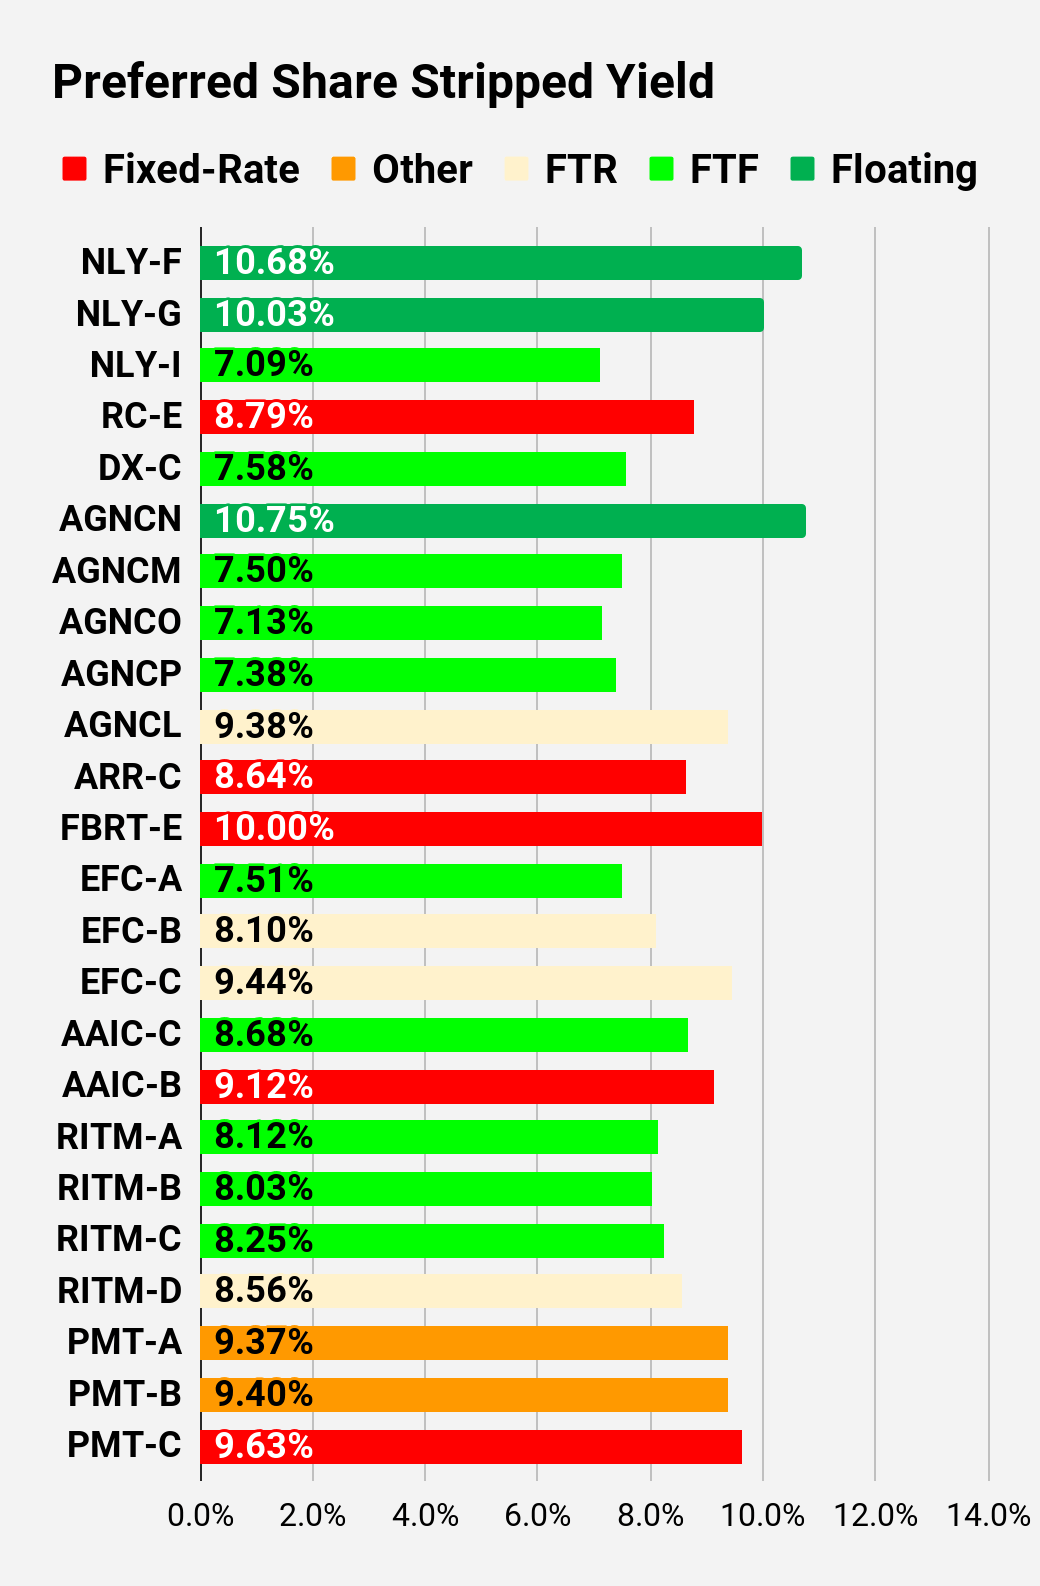
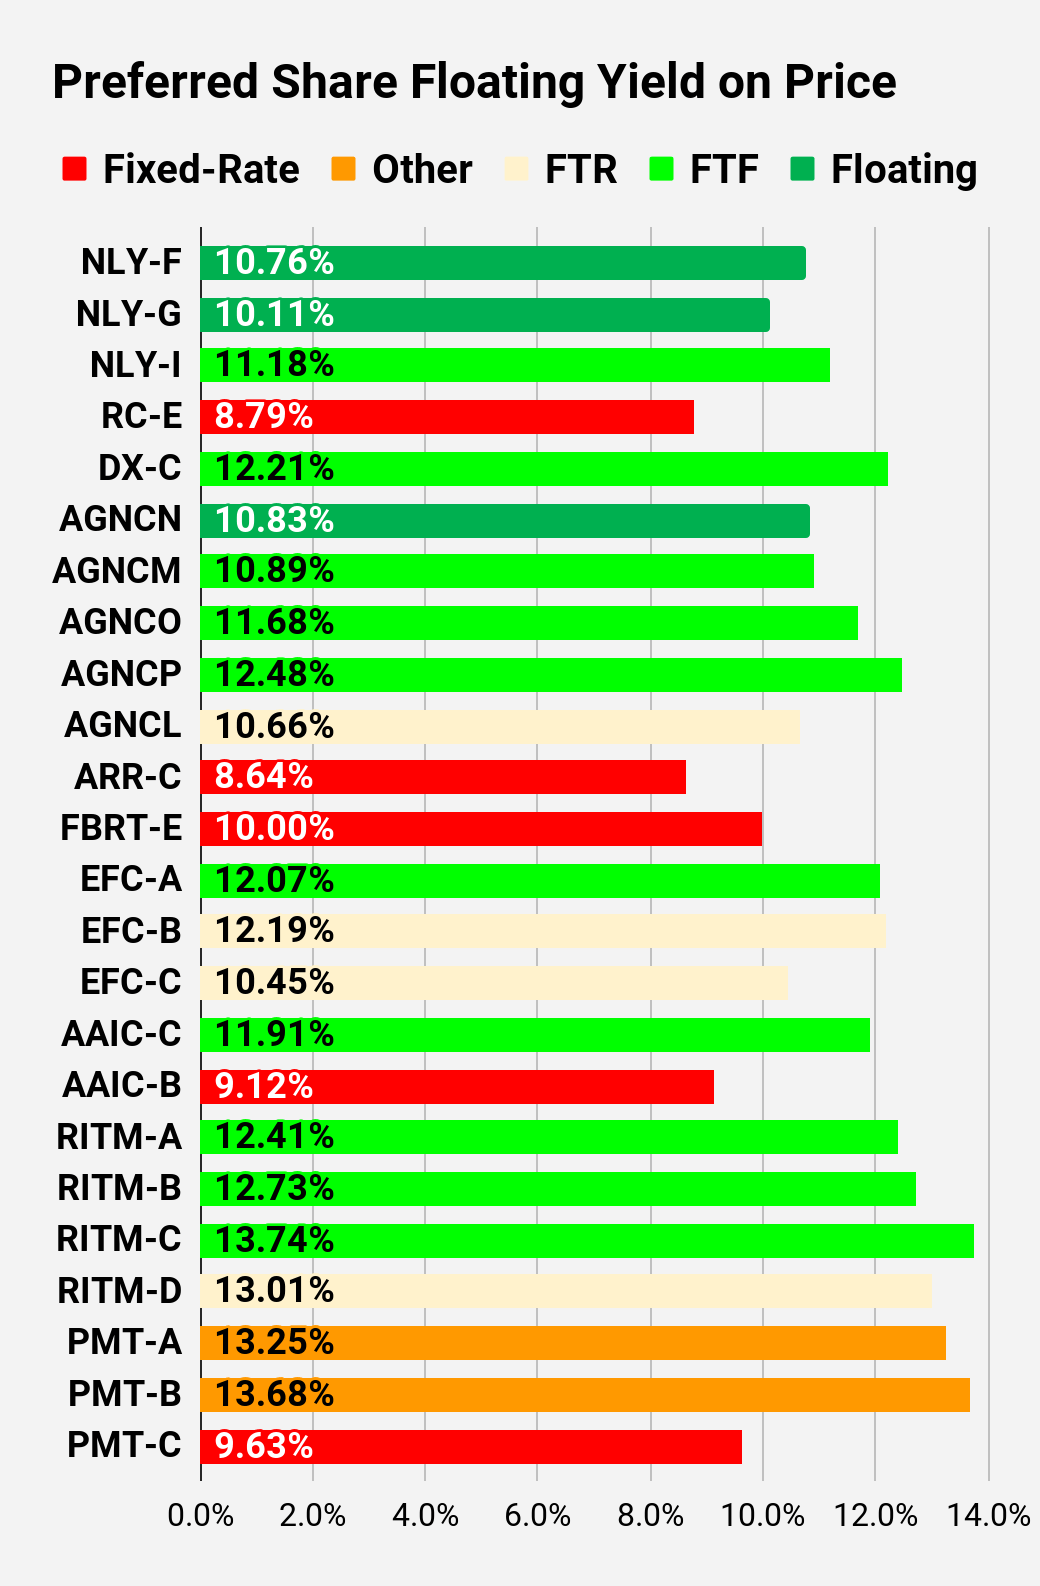
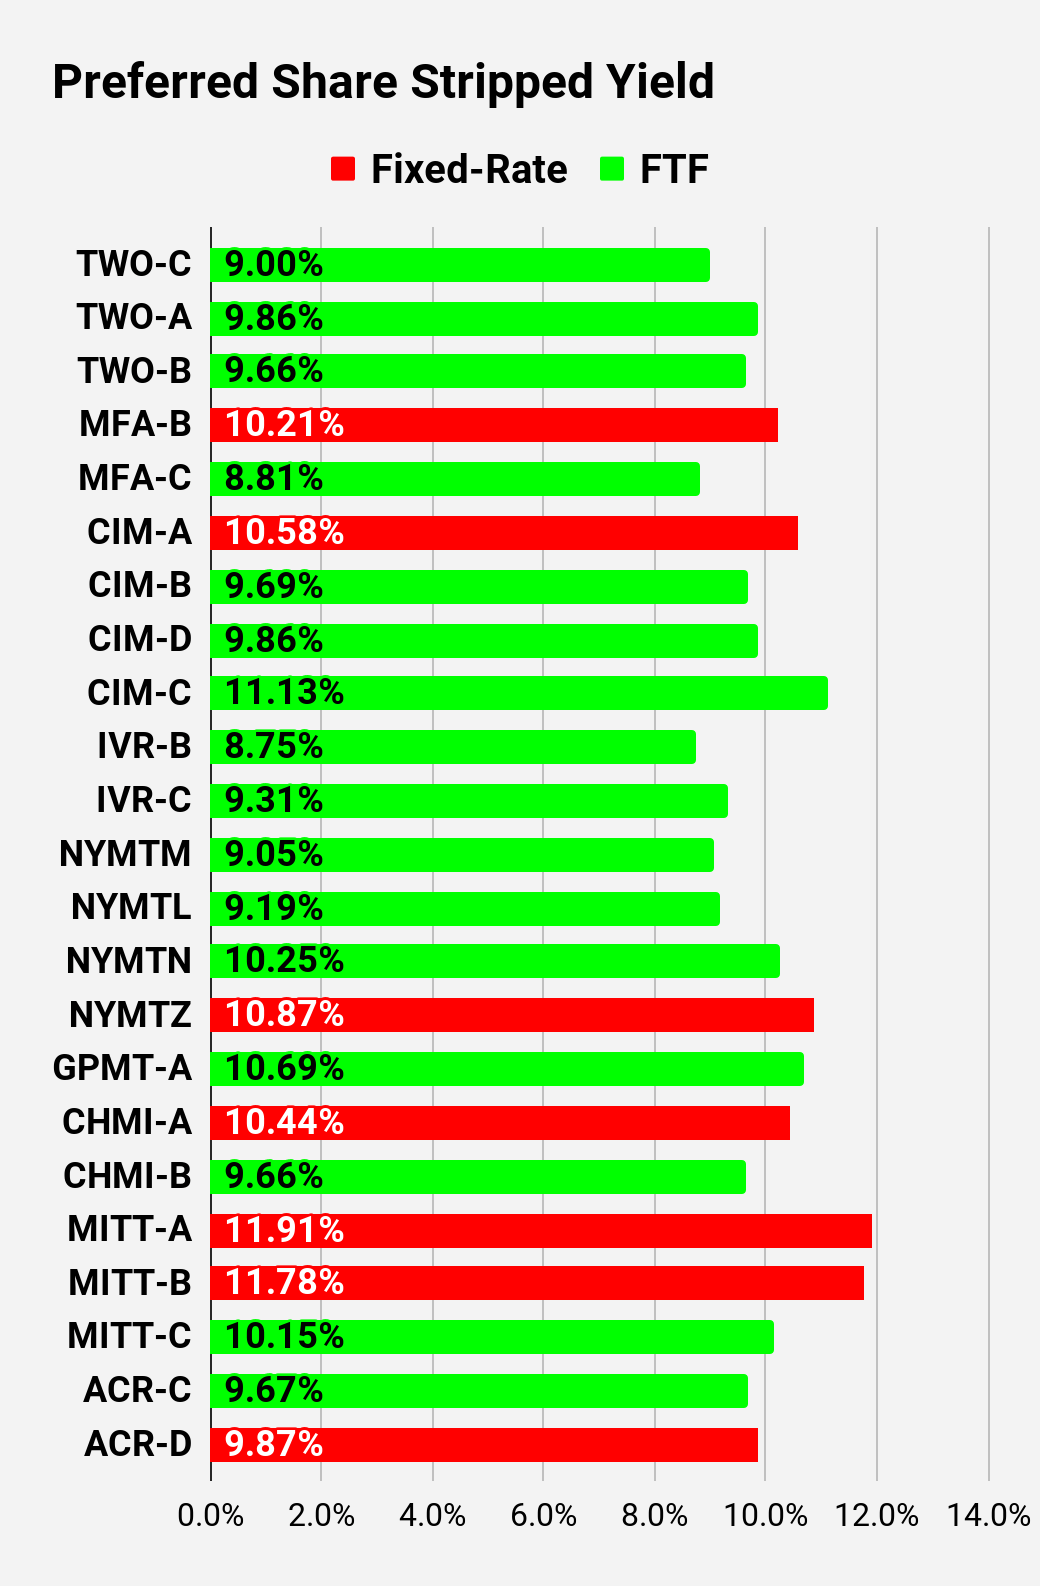
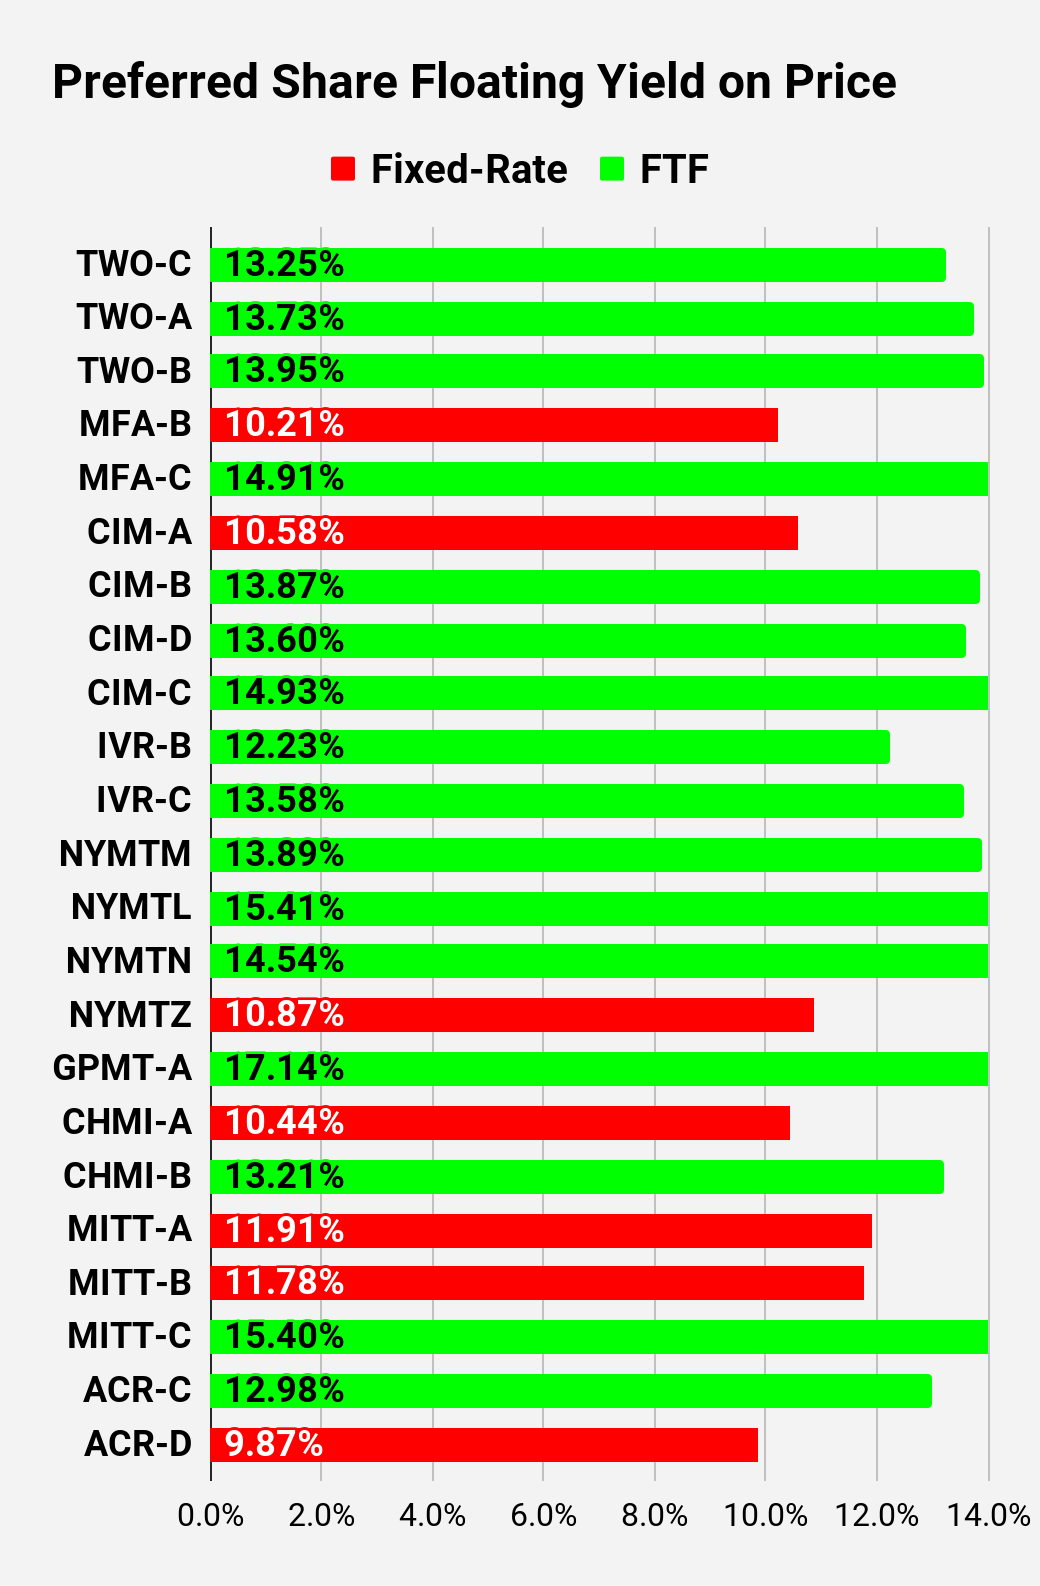
To recognize how large the gap can be between the initial yield and the yield implied when shares begin floating, simply look at some of the last preferred share charts in this article. You'll want to compare the "Stripped Yield" chart with the "Floating Yield on Price" chart.
Stock Table
We will close out the rest of the article with the tables and charts we provide for readers to help them track the sector for both common shares and preferred shares.
We're including a quick table for the common shares that will be shown in our tables:
| Type of REIT or BDC |
| Residential Agency |
| Residential Hybrid |
| Residential Originator and Servicer |
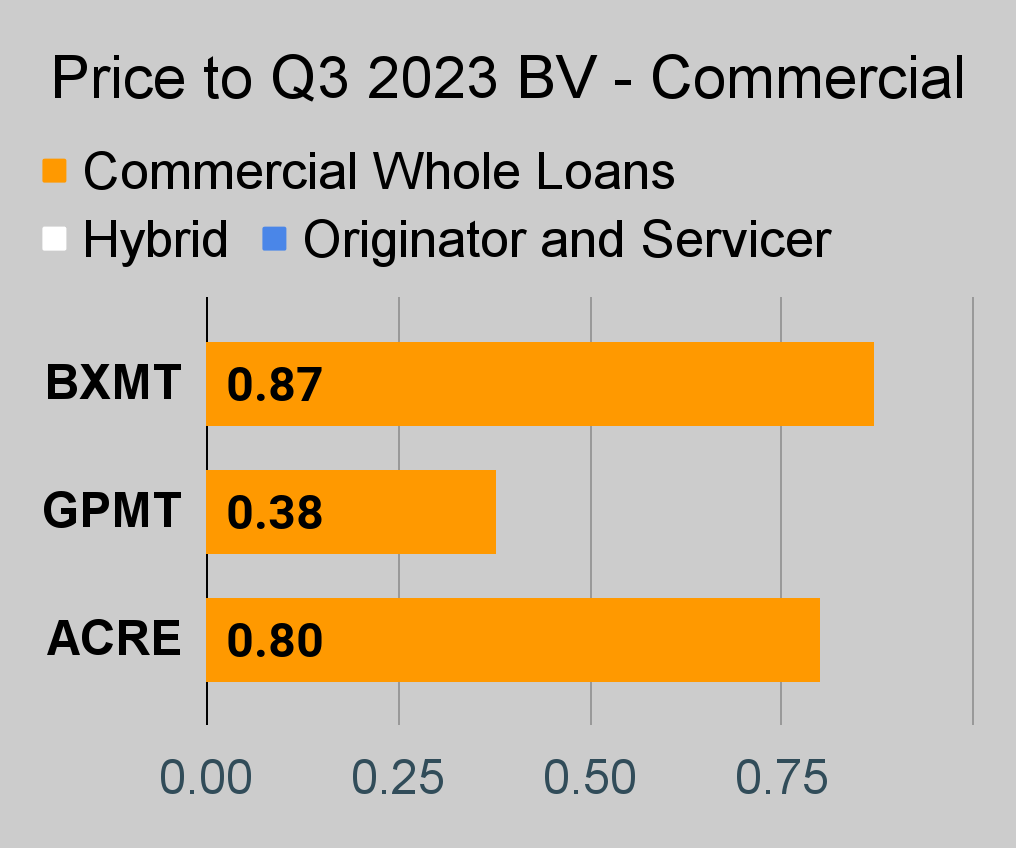
| Commercial |
| BDC |
If you're looking for a stock that I haven't mentioned yet, you'll still find it in the charts below. The charts contain comparisons based on price-to-book value, dividend yields, and earnings yield. You won't find these tables anywhere else.
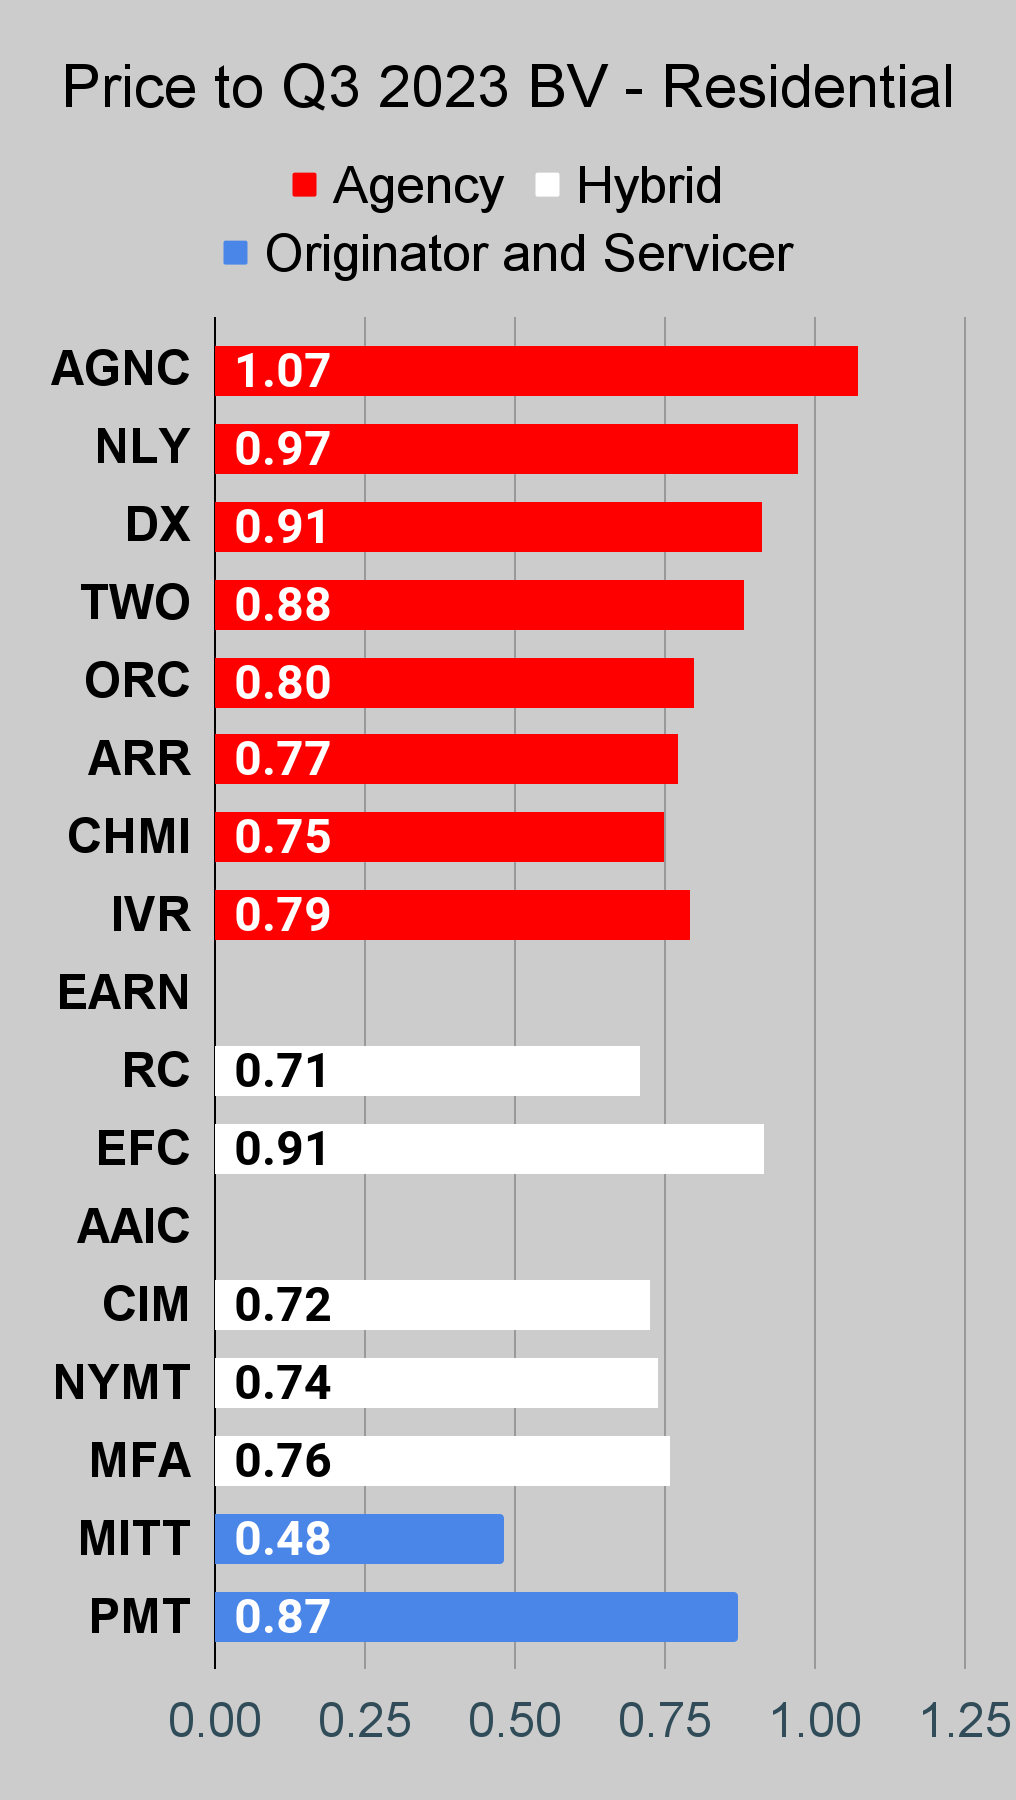
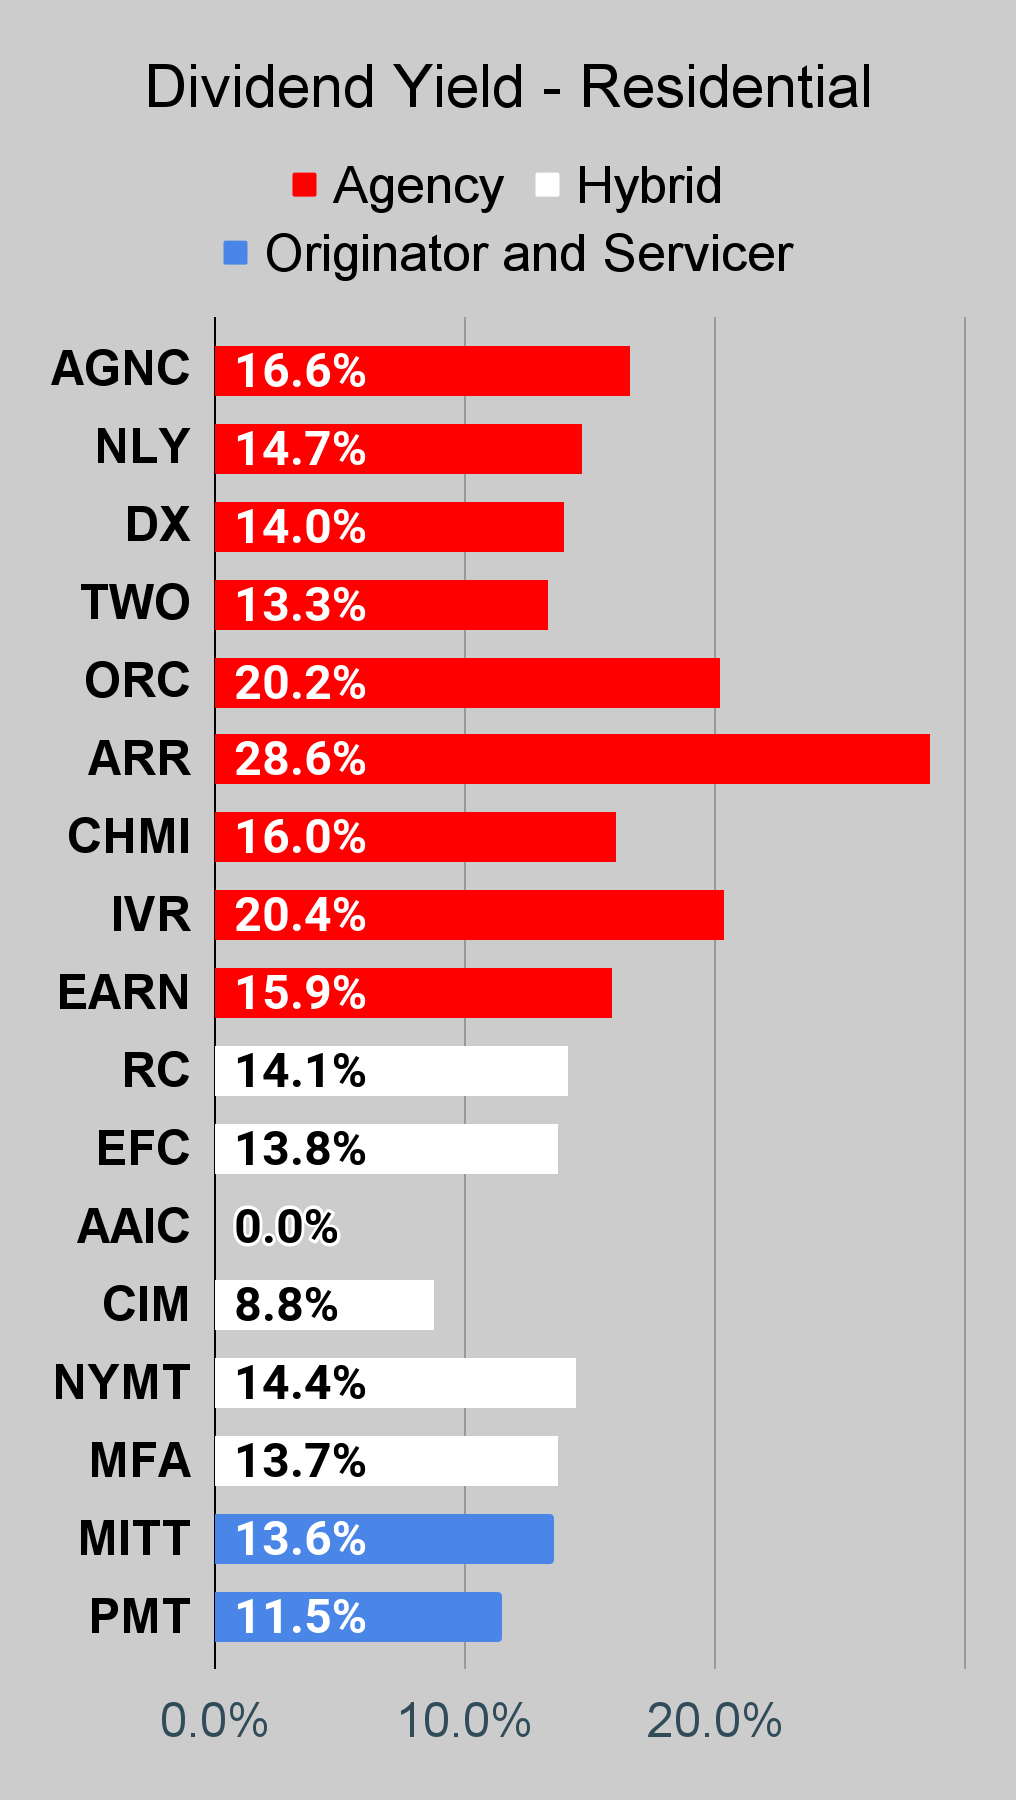
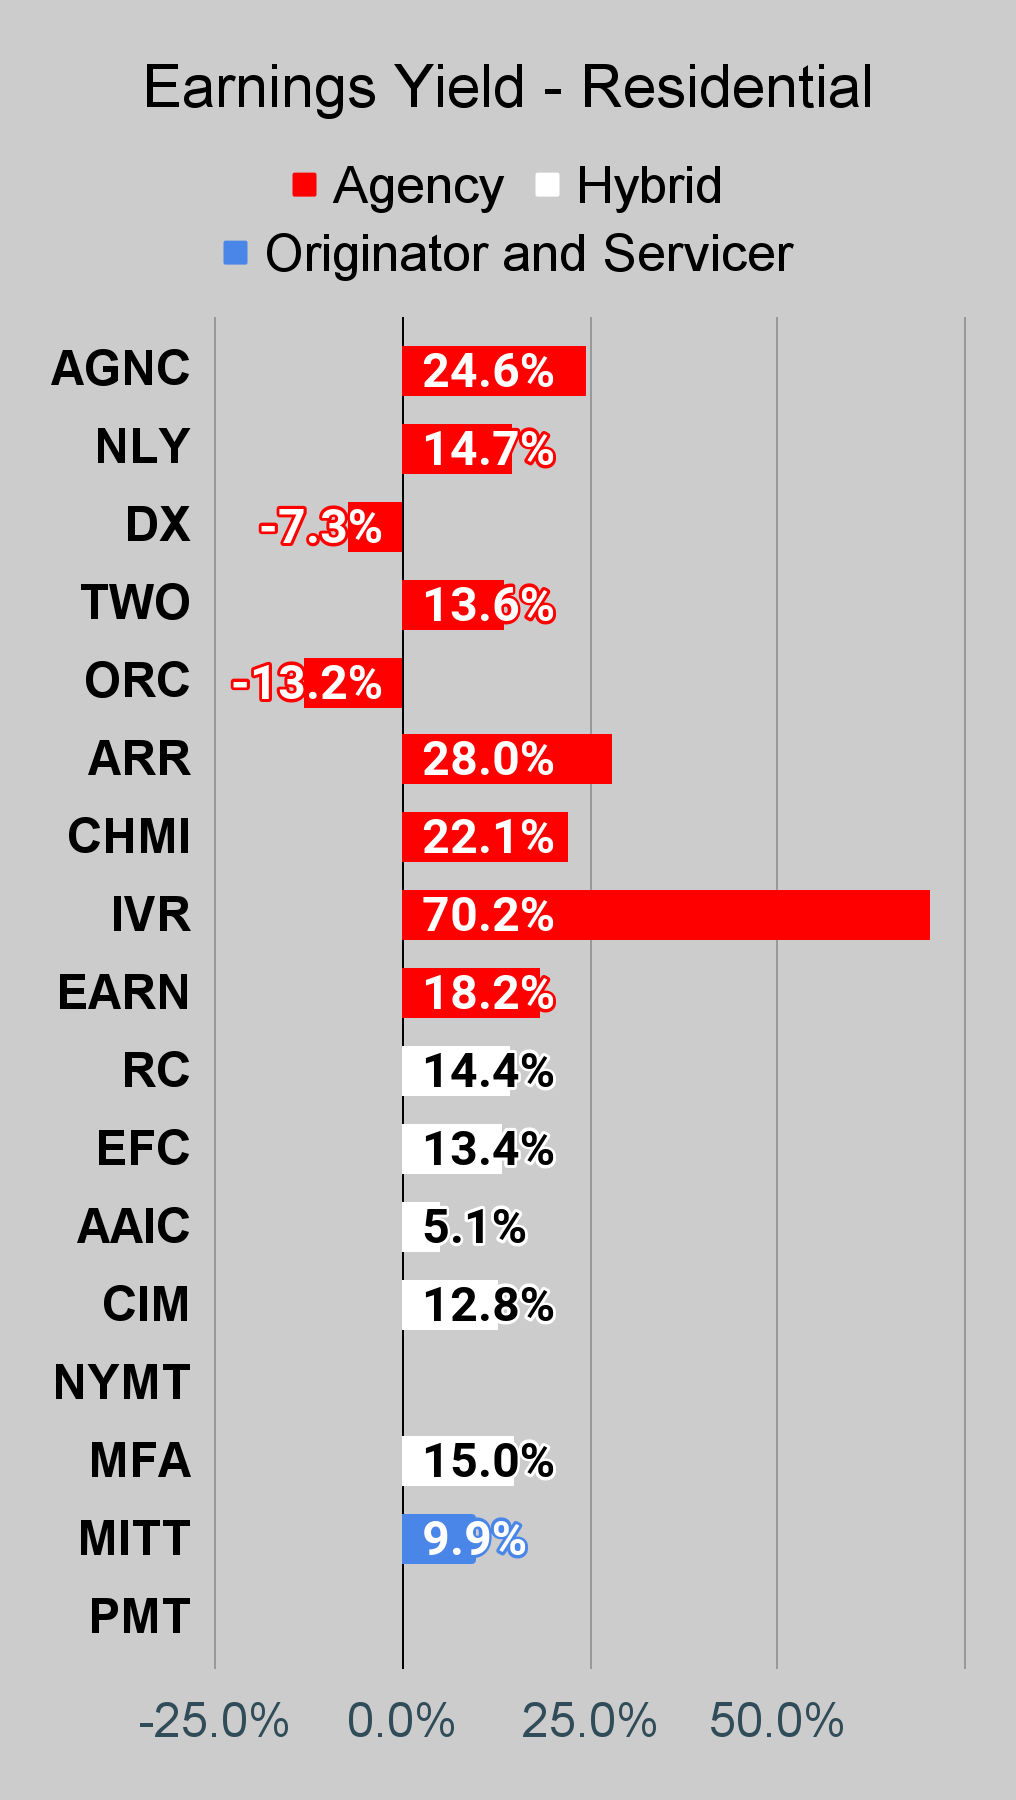
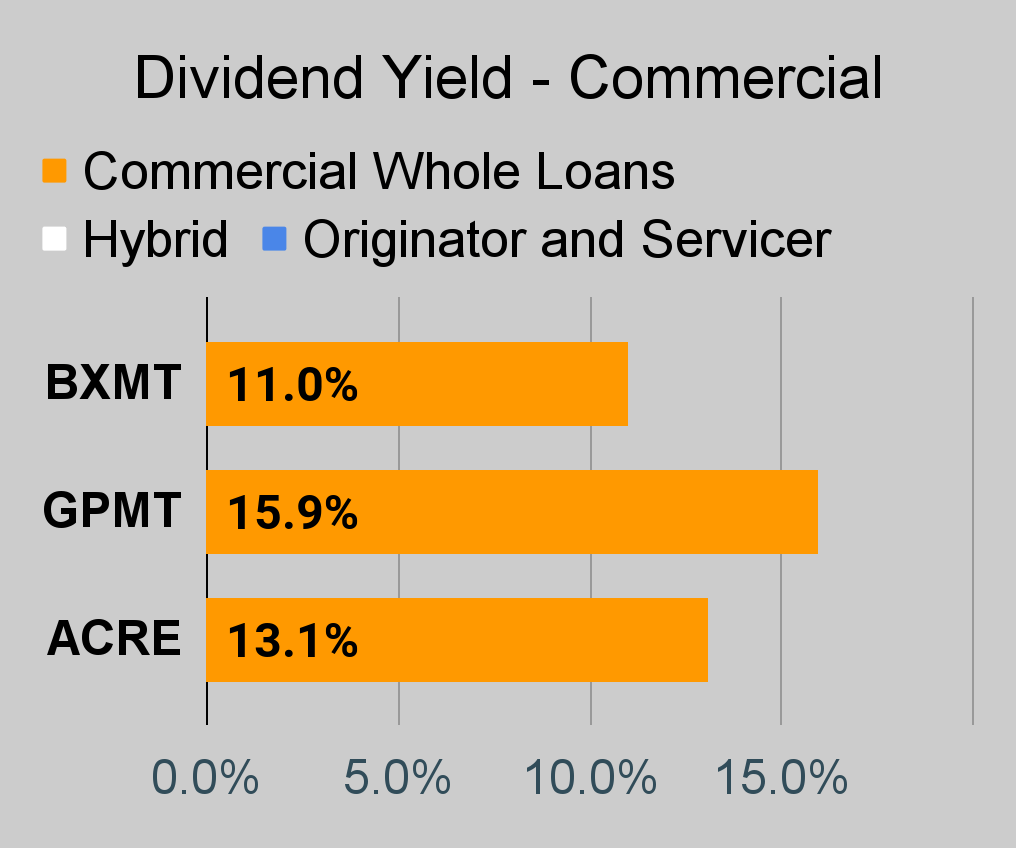
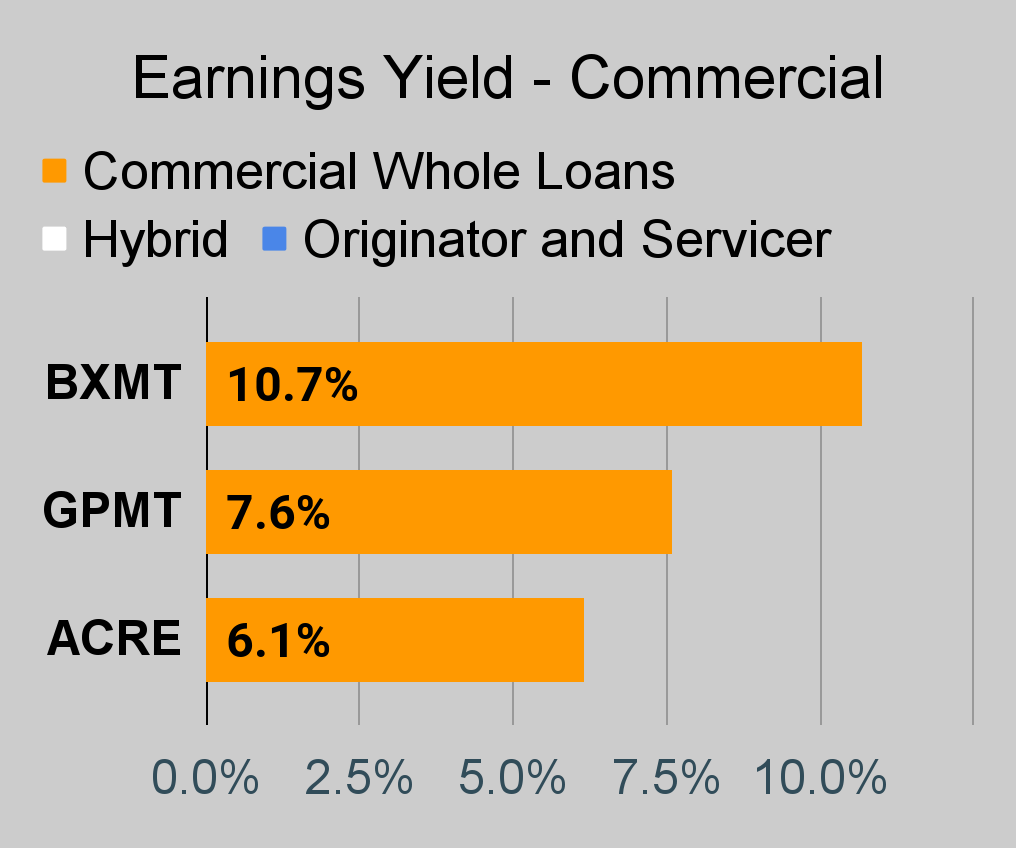
For mortgage REITs, please look at the charts for AGNC, NLY, DX, ORC, ARR, CHMI, TWO, IVR, EARN, CIM, EFC, NYMT, MFA, MITT, AAIC, PMT, RITM, BXMT, GPMT, WMC, and RC.
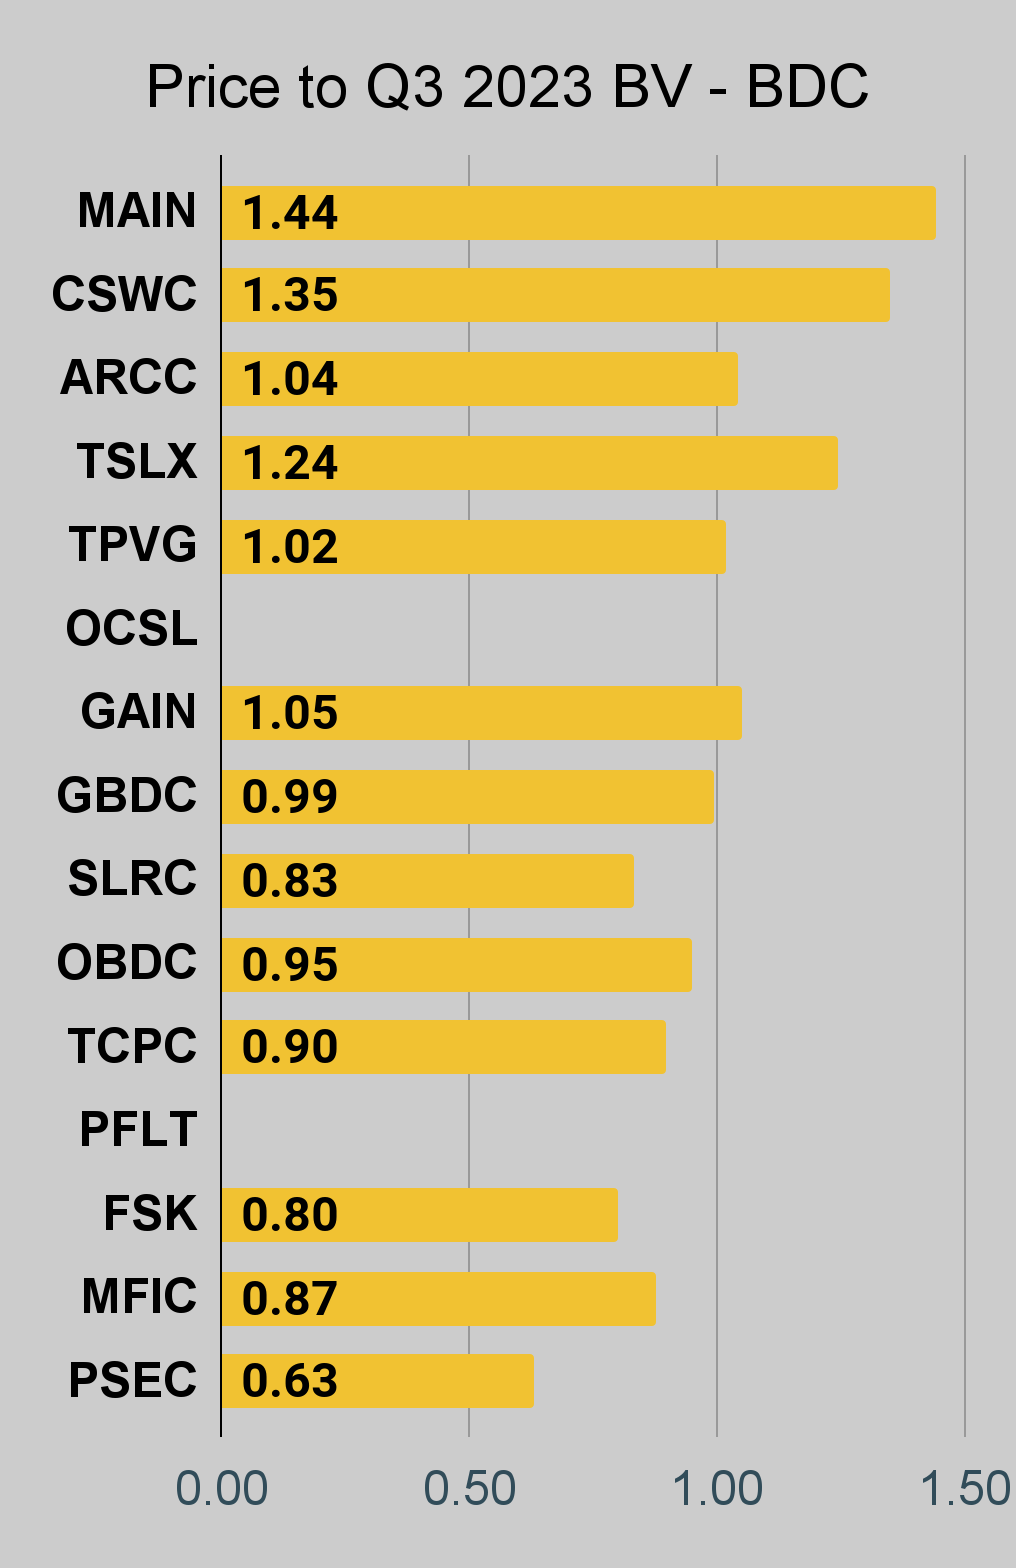
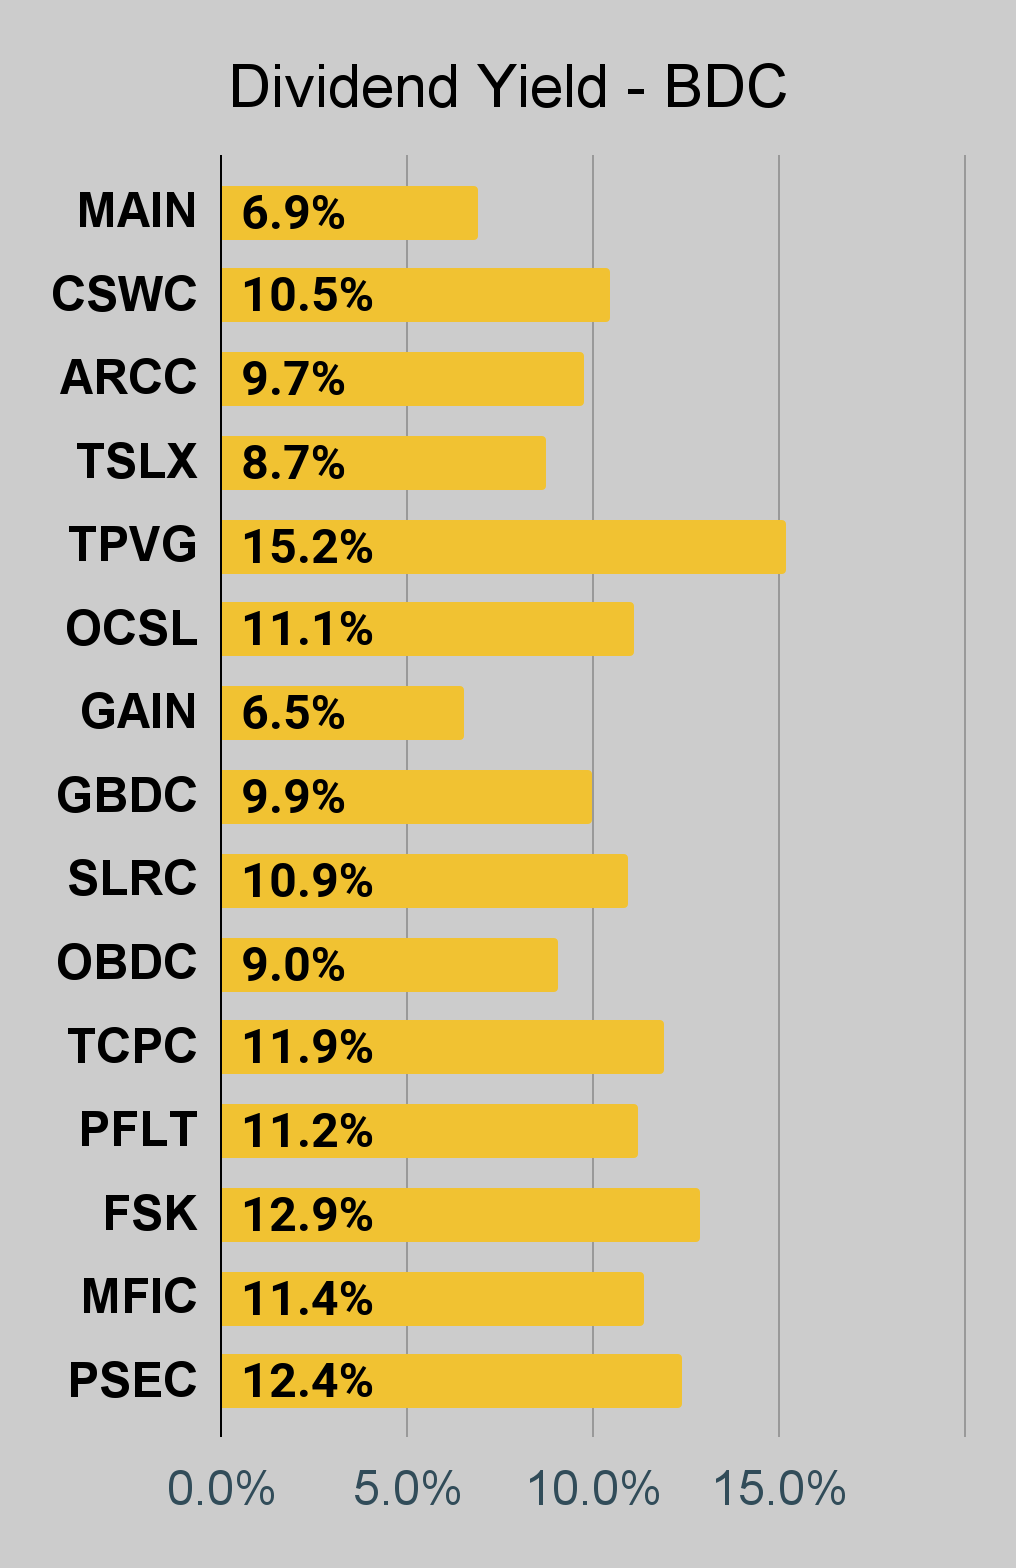
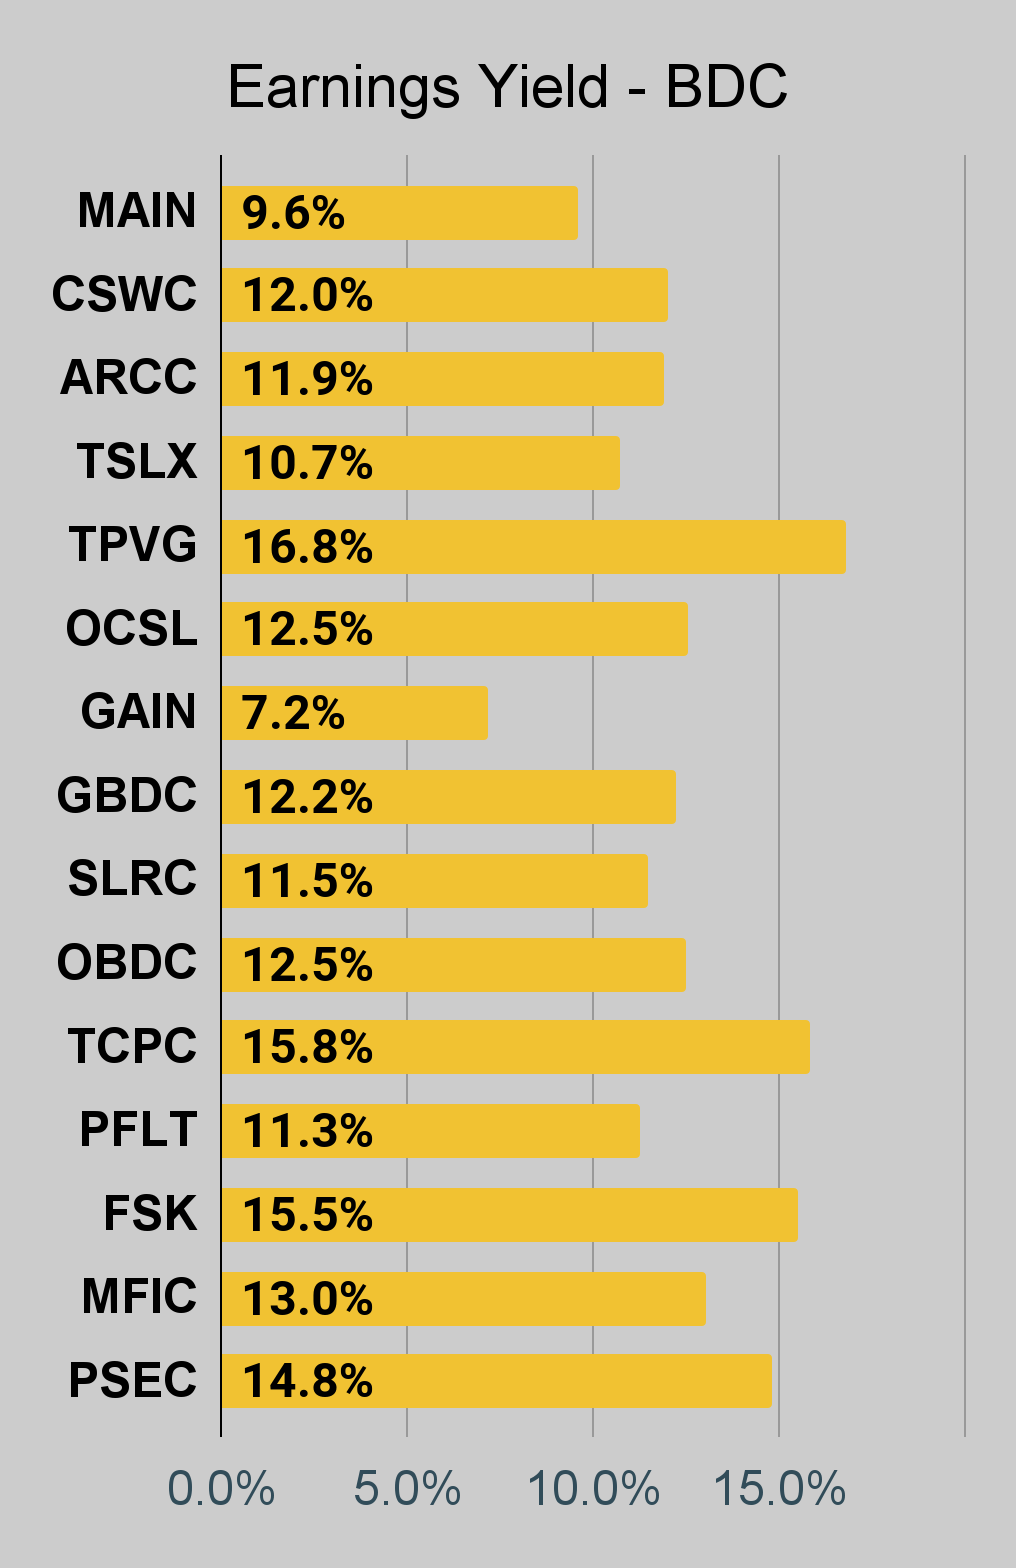
For BDCs, please look at the charts for MAIN, CSWC, ARCC, TSLX, TPVG, OCSL, GAIN, GBDC, SLRC, OBDC, PFLT, TCPC, FSK, PSEC, and MFIC.
This series is the easiest place to find charts providing up-to-date comparisons across the sector.
Note on Book Values
I've updated the charts to use Q3 2023 book values. These are much closer to current book values. Companies that have not reported values for Q3 2023 will be blank. We don't want to put Q2 2023 and Q3 2023 BVs in the same charts due to the significant changes.
Residential Mortgage REIT Charts
Note: The chart for our public articles uses the book value per share from the quarter indicated in the chart. We use the current estimated (proprietary estimates) book value per share to determine our targets and trading decisions. PMT and NYMT are not showing an earnings yield metric as neither REIT provides a quarterly "Core EPS" metric. Presently, a few other REITs also have no consensus estimate.
Second Note: Due to the way historical amortized cost and hedging are factored into the earnings metrics, it's possible for two mortgage REITs with similar portfolios to post materially different metrics for earnings. I would be very cautious about putting much emphasis on the consensus analyst estimate (which is used to determine the earnings yield). In particular, throughout late 2022 the earnings metric became less comparable for many REITs.
Commercial Mortgage REIT Charts
BDC Charts
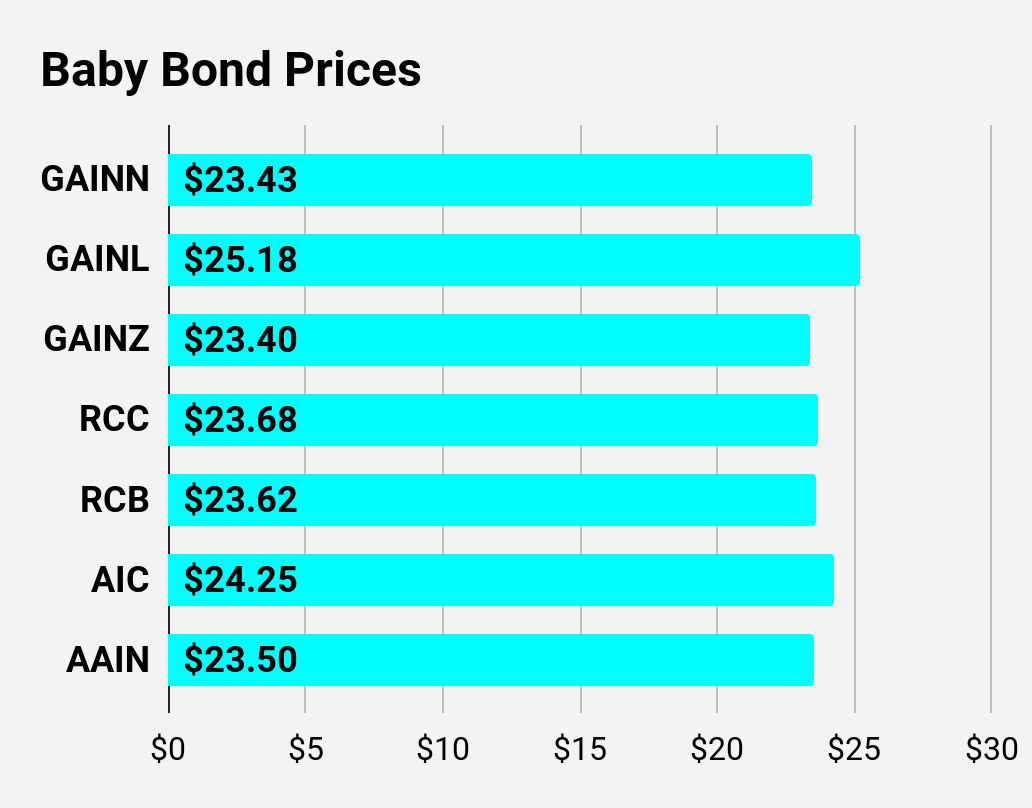
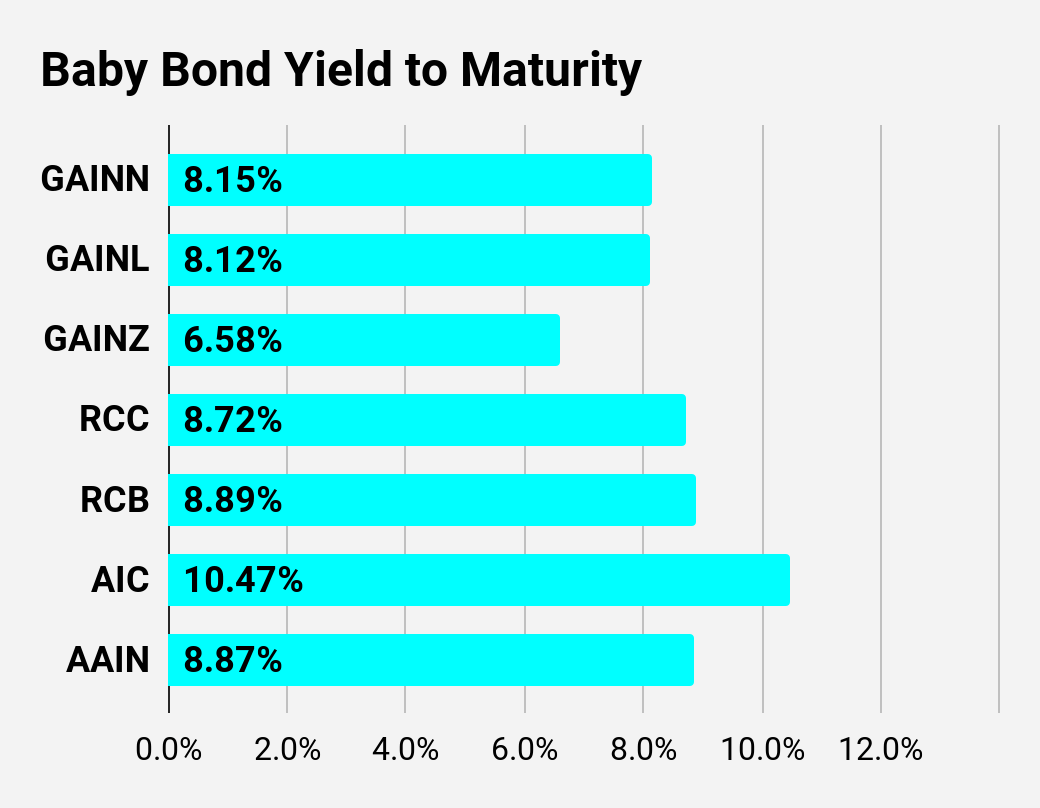
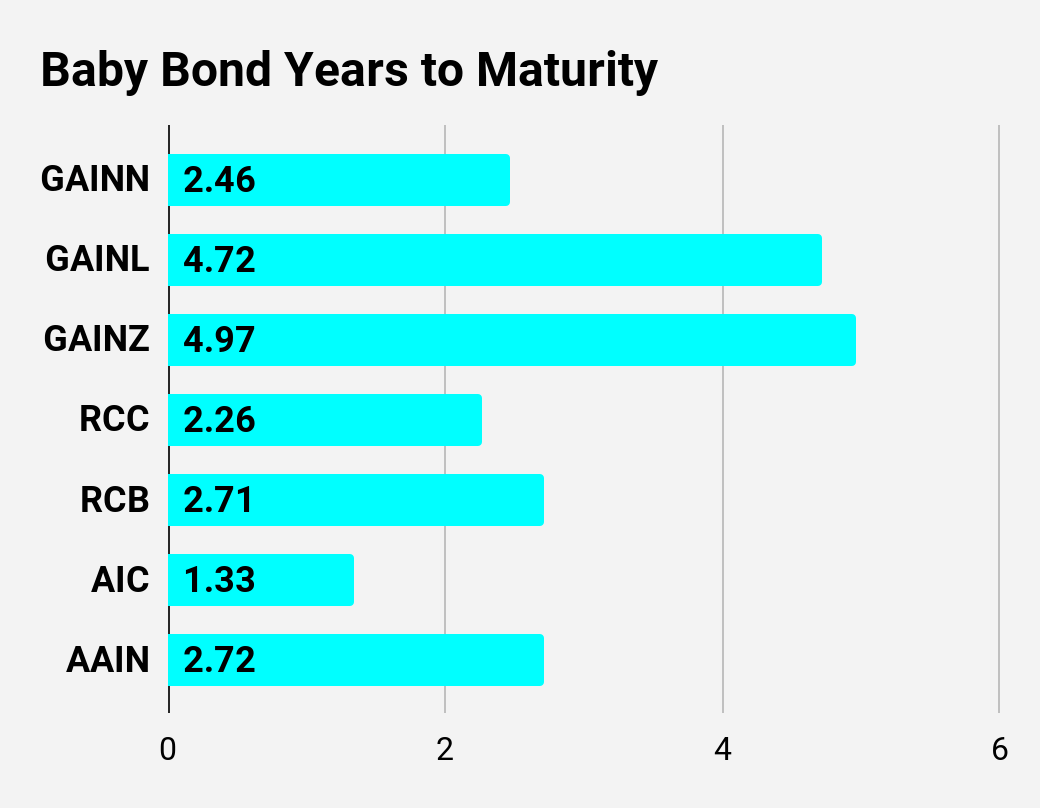
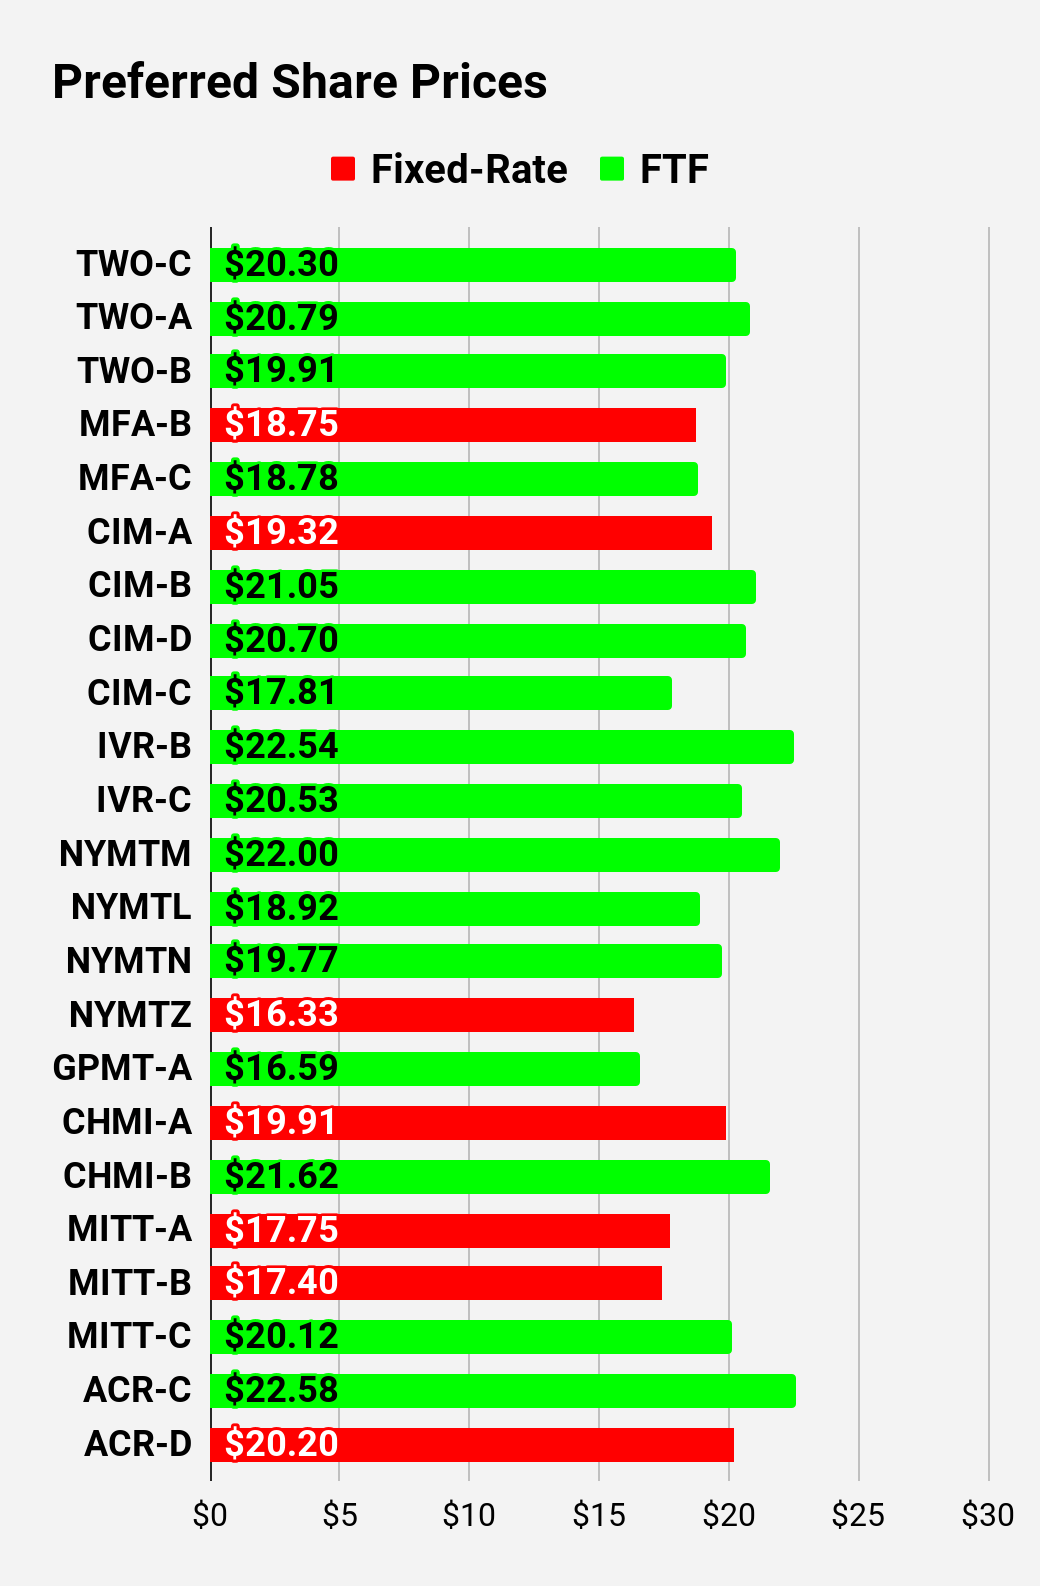
Preferred Share and Baby Bond Charts
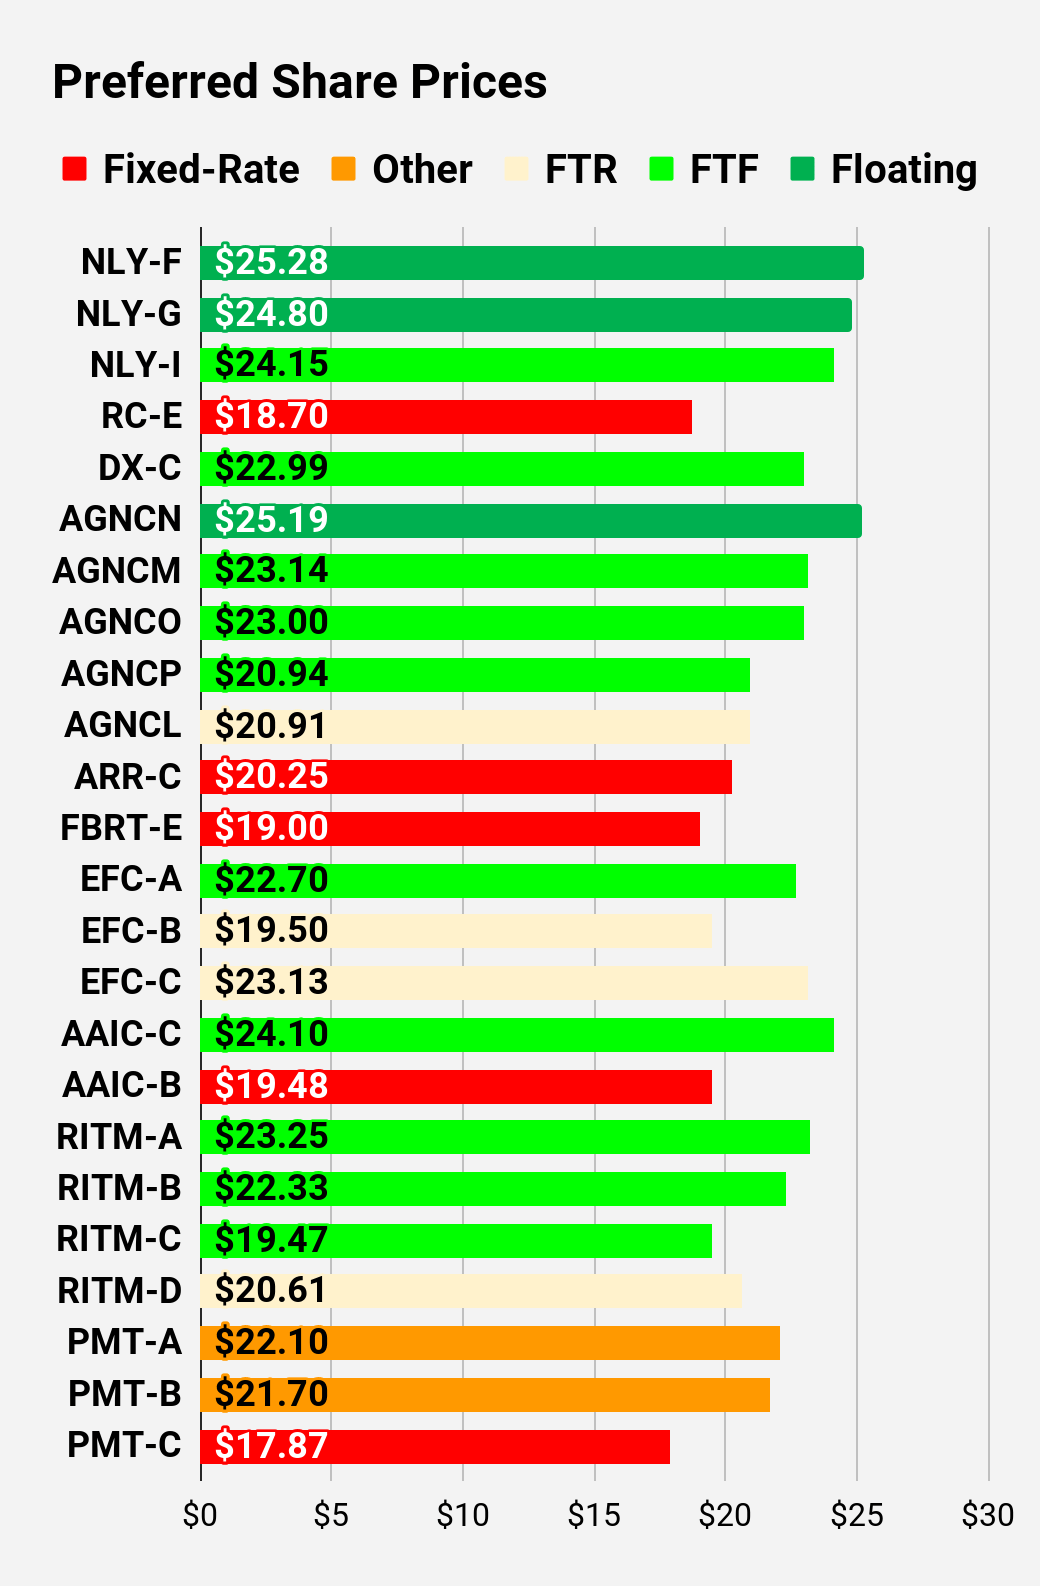
I changed the coloring a bit. We needed to adjust to include that the first fixed-to-floating shares have transitioned over to floating rates. When a share already is floating, the stripped yield may be different from the "Floating Yield on Price" due to changes in interest rates. For instance, NLY-F already has a floating rate. However, the rate is only reset once per three months. The stripped yield is calculated using the upcoming projected dividend payment and the "Floating Yield on Price" is based on where the dividend would be if the rate reset today. In my opinion, for these shares the "Floating Yield on Price" is clearly the more important metric.
Note: Shares that are classified as "Other" are not necessarily the same. We provide further distinction. For the purpose of these charts, I lumped all of them together as "Other." Now there are only two left, PMT-A and PMT-B. Those both have the same issue. Management claims the shares will be fixed-rate, even though the prospectus says they should be fixed-to-floating.
Preferred Share Data
Beyond the charts, we're also providing our readers with access to several other metrics for the preferred shares.
After testing out a series on preferred shares, we decided to try merging it into the series on common shares. After all, we're still talking about positions in mortgage REITs. We don't have any desire to cover preferred shares without cumulative dividends, so any preferred shares you see in our column will have cumulative dividends. You can verify that by using Quantum Online. We've included the links in the table below.
To better organize the table, we needed to abbreviate column names as follows:
- Price = Recent Share Price - Shown in Charts.
- S-Yield = Stripped Yield - Shown in Charts.
- Coupon = Initial Fixed-Rate Coupon.
- FYoP = Floating Yield on Price - Shown in Charts.
- NCD = Next Call Date (the soonest shares could be called).
- Note: For all FTF issues, the floating rate would start on NCD.
- WCC = Worst Cash to Call (lowest net cash return possible from a call).
- QO Link = Link to Quantum Online Page.
| Ticker |
| Price |
| S-Yield |
| Coupon |
| FYoP |
| NCD |
| WCC |
| QO Link |
| P-Link |
| $23.43 |
| $0.08 |
| $0.05 |
| 8.15% |
| 12/14/2023 |
| $1.72 |
| $25.18 |
| $0.08 |
| $0.08 |
| 8.12% |
| 8/1/2025 |
| $3.33 |
| $23.40 |
| $0.07 |
| $0.05 |
| 6.58% |
| 12/14/2023 |
| $1.75 |
| $23.68 |
| $0.09 |
| $0.06 |
| 8.72% |
| 12/14/2023 |
| $1.50 |
| $23.62 |
| $0.09 |
| $0.06 |
| 8.89% |
| 12/14/2023 |
| $1.57 |
| $24.25 |
| $0.10 |
| $0.07 |
| 10.47% |
| 12/14/2023 |
| $1.16 |
| $23.50 |
| $0.09 |
| $0.06 |
| 8.87% |
| 12/14/2023 |
| $1.66 |
Second batch:
| Ticker |
| Price |
| S-Yield |
| Coupon |
| FYoP |
| NCD |
| WCC |
| QO Link |
| P-Link |
| $25.28 |
| $0.11 |
| $0.11 |
| 10.76% |
| 12/14/2023 |
| $0.27 |
| $24.80 |
| $0.10 |
| $0.10 |
| 10.11% |
| 12/14/2023 |
| $0.70 |
| $24.15 |
| $0.07 |
| $0.07 |
| 11.18% |
| 6/30/2024 |
| $2.12 |
| $18.70 |
| $0.09 |
| $0.07 |
| 8.79% |
| 6/10/2026 |
| $10.56 |
| $22.99 |
| $0.08 |
| $0.07 |
| 12.21% |
| 4/15/2025 |
| $4.60 |
| $25.19 |
| $0.11 |
| $0.11 |
| 10.83% |
| 12/14/2023 |
| $0.27 |
| $23.14 |
| $0.08 |
| $0.07 |
| 10.89% |
| 4/15/2024 |
| $2.73 |
| $23.00 |
| $0.07 |
| $0.07 |
| 11.68% |
| 10/15/2024 |
| $3.64 |
| $20.94 |
| $0.07 |
| $0.06 |
| 12.48% |
| 4/15/2025 |
| $6.37 |
| $20.91 |
| $0.09 |
| $0.08 |
| 10.66% |
| 10/15/2027 |
| $11.86 |
| $20.25 |
| $0.09 |
| $0.07 |
| 8.64% |
| 1/28/2025 |
| $6.79 |
| $19.00 |
| $0.10 |
| $0.08 |
| 10.00% |
| 12/14/2023 |
| $6.31 |
| $22.70 |
| $0.08 |
| $0.07 |
| 12.07% |
| 10/30/2024 |
| $4.00 |
| $19.50 |
| $0.08 |
| $0.06 |
| 12.19% |
| 1/30/2027 |
| $10.60 |
| $23.13 |
| $0.09 |
| $0.09 |
| 10.45% |
| 4/30/2028 |
| $11.60 |
| $24.10 |
| $0.09 |
| $0.08 |
| 11.91% |
| 3/30/2024 |
| $1.85 |
| $19.48 |
| $0.09 |
| $0.07 |
| 9.12% |
| 12/14/2023 |
| $5.81 |
| $23.25 |
| $0.08 |
| $0.08 |
| 12.41% |
| 8/15/2024 |
| $3.17 |
| $22.33 |
| $0.08 |
| $0.07 |
| 12.73% |
| 08/15/2024 |
| $4.02 |
| $19.47 |
| $0.08 |
| $0.06 |
| 13.74% |
| 02/15/2025 |
| $7.54 |
| $20.61 |
| $0.09 |
| $0.07 |
| 13.01% |
| 11/15/2026 |
| $9.66 |
| $22.10 |
| $0.09 |
| $0.08 |
| 13.25% |
| 3/15/2024 |
| $3.92 |
| $21.70 |
| $0.09 |
| $0.08 |
| 13.68% |
| 6/15/2024 |
| $4.81 |
| $17.87 |
| $0.10 |
| $0.07 |
| 9.63% |
| 8/24/2026 |
| $12.10 |
Third batch:
| Ticker |
| Price |
| S-Yield |
| Coupon |
| FYoP |
| NCD |
| WCC |
| QO Link |
| P-Link |
| $20.30 |
| $0.09 |
| $0.07 |
| 13.25% |
| 1/27/2025 |
| $6.97 |
| $20.79 |
| $0.10 |
| $0.08 |
| 13.73% |
| 4/27/2027 |
| $11.32 |
| $19.91 |
| $0.10 |
| $0.08 |
| 13.95% |
| 7/27/2027 |
| $12.24 |
| $18.75 |
| $0.10 |
| $0.08 |
| 10.21% |
| 12/14/2023 |
| $6.64 |
| $18.78 |
| $0.09 |
| $0.07 |
| 14.91% |
| 3/31/2025 |
| $8.67 |
| $19.32 |
| $0.11 |
| $0.08 |
| 10.58% |
| 12/14/2023 |
| $6.18 |
| $21.05 |
| $0.10 |
| $0.08 |
| 13.87% |
| 3/30/2024 |
| $5.03 |
| $20.70 |
| $0.10 |
| $0.08 |
| 13.60% |
| 3/30/2024 |
| $5.38 |
| $17.81 |
| $0.11 |
| $0.08 |
| 14.93% |
| 9/30/2025 |
| $11.15 |
| $22.54 |
| $0.09 |
| $0.08 |
| 12.23% |
| 12/27/2024 |
| $4.91 |
| $20.53 |
| $0.09 |
| $0.08 |
| 13.58% |
| 9/27/2027 |
| $12.00 |
| $22.00 |
| $0.09 |
| $0.08 |
| 13.89% |
| 1/15/2025 |
| $5.47 |
| $18.92 |
| $0.09 |
| $0.07 |
| 15.41% |
| 10/15/2026 |
| $11.24 |
| $19.77 |
| $0.10 |
| $0.08 |
| 14.54% |
| 10/15/2027 |
| $13.24 |
| $16.33 |
| $0.11 |
| $0.07 |
| 10.87% |
| 1/15/2027 |
| $14.37 |
| $16.59 |
| $0.11 |
| $0.07 |
| 17.14% |
| 11/30/2026 |
| $13.87 |
| $19.91 |
| $0.10 |
| $0.08 |
| 10.44% |
| 12/14/2023 |
| $5.36 |
| $21.62 |
| $0.10 |
| $0.08 |
| 13.21% |
| 4/15/2024 |
| $4.34 |
| $17.75 |
| $0.12 |
| $0.08 |
| 11.91% |
| 12/14/2023 |
| $7.71 |
| $17.40 |
| $0.12 |
| $0.08 |
| 11.78% |
| 12/14/2023 |
| $8.05 |
| $20.12 |
| $0.10 |
| $0.08 |
| 15.40% |
| 9/17/2024 |
| $6.85 |
| $22.58 |
| $0.10 |
| $0.09 |
| 12.98% |
| 7/30/2024 |
| $4.05 |
| $20.20 |
| $0.10 |
| $0.08 |
| 9.87% |
| 5/21/2026 |
| $9.84 |
Strategy
Our goal is to maximize total returns . We achieve those most effectively by including "trading" strategies. We regularly trade positions in the mortgage REIT common shares and BDCs because:
- Prices are inefficient.
- Long-term, share prices generally revolve around book value.
- Short-term, price-to-book ratios can deviate materially.
- Book value isn't the only step in analysis, but it's the cornerstone.
We also allocate to preferred shares and equity REITs. We encourage buy-and-hold investors to consider using more preferred shares and equity REITs.
For further details see:
REITs To The Moon