AGNCO - Rithm Capital's Sector Comparative Analysis - Part 1 (Includes Recommendation For 19 Peers As Of 12/1/2023)
2023-12-06 08:59:20 ET
Summary
- Part 1 of this article compares RITM’s recent investment composition, leverage, hedging coverage ratio, quarterly BV, economic return (loss), and current valuation to 19 mREIT peers.
- Due to what has occurred during the fourth quarter of 2023 (fluctuating rates/yields), understanding the composition of RITM’s MSR/investment and derivatives portfolio is crucial in understanding current/future performance.
- My current RITM BV projection and updated price target is in the “Conclusions Drawn” section. RITM is currently deemed undervalued (buy recommendation).
- I also provide a list of the mREIT covered stocks I currently believe are undervalued (a buy recommendation), overvalued (a sell recommendation), or appropriately valued (a hold recommendation).
- Part 1 also performs a detailed analysis of RITM’s MSR and derivatives portfolios as of 9/30/2023. This includes RITM’s projected performance during the fourth quarter of 2023 (through 12/1/2023).
Focus of Article
The focus of PART 1 of this article is to analyze Rithm Capital Corp.’s ( RITM ) recent results and compare several of the company’s metrics to 19 mortgage real estate investment trust (mREIT) peers. This analysis will show past and current data with supporting documentation within four tables. Table 1a will compare RITM’s investment composition, recent leverage, hedging coverage ratio, and change in investment portfolio size to the 19 mREIT peers. Table 1b will compare RITM’s BV, economic return (loss), and premium (discount) to estimated CURRENT BV using stock prices as of 12/1/2023 to the 19 mREIT peers. Table 2a will show an overview of RITM’s investment portfolio while Table 2b will provide some details regarding the company’s largest driver of earnings, its mortgage servicing rights (“MSR”) sub-portfolio. Table 3 will show RITM’s recent hedging coverage ratio over the prior 5 quarters (only contributor/team to provide continuous detailed hedging metrics).
I am writing this 2-part article due to requests that such an analysis be specifically performed on RITM versus its mREIT peers at periodic intervals. This article also discusses the importance of understanding the composition of RITM’s investment and derivatives portfolios regarding projecting the company’s future quarterly results as interest rates/yields fluctuate. Understanding the characteristics of a company’s investment and derivatives portfolios can shed some light on which companies are overvalued or undervalued strictly per a “numbers” analysis. This is not the only data that should be examined to initiate a position within a particular stock/sector. However, I believe this analysis is a good “starting-point” to begin a discussion on the topic.
At the end of this article, there will be a conclusion regarding the following comparisons between RITM and the 19 mREIT peers: 1) trailing 24-month economic return (loss) ; 2) leverage as of 9/30/2023 ; 3) hedging coverage ratio as of 9/30/2023 ; and 4) premium (discount) to my estimated CURRENT BV (BV as of 12/1/2023) . My BUY, SELL, or HOLD recommendation and updated price target for RITM will be in the “Conclusions Drawn” section of this article. This includes providing a list of the mREIT stocks I currently believe are undervalued (a buy recommendation), overvalued (a sell recommendation), or appropriately valued (a hold recommendation).
Overview of Several Classifications within the mREIT Sector
I believe there are several different classifications when it comes to mREIT companies. For purposes of this article, I am focusing on four. It should be noted in light of several prior acquisitions and certain changes in overall investment strategies, some mREIT companies have minor-modest sub-portfolios outside each entity’s main concentration. However, I have continued to group certain mREIT companies in each entity’s main classification for purposes of this article. Some market participants (and even some mREIT companies) have different classifications when compared to Table 1a. Some market participants/companies base classifications on the percentage of capital deployed in each entity’s investment portfolio. However, my preference is to base a company’s classification on the monetary “fair market value” (“FMV”) of each underlying portfolio which, for a fact, is what drives valuation fluctuations. In my professional opinion, there is no “uniform” methodology when it comes to classifying mREIT companies but more of an underlying preference. Readers should understand this as the analysis is presented below.
First, there are mREIT companies who earn a majority of income from investing in fixed-rate agency mortgage-backed securities (“MBS”). These investments consist of commercial/residential MBS, collateralized mortgage obligations (“CMO”), and agency debentures for which the principal and interest payments are guaranteed by government-sponsored enterprises/entities (“GSE”). This is extremely important to understand (especially when markets incorrectly priced in this notion at the onset of COVID-19 in early 2020). Since these investments typically have higher durations versus most other investments within the broader mREIT sector, companies within this classification typically utilize higher hedging coverage ratios in times of rising mortgage interest rates/U.S. Treasury yields (or a projected rise over the foreseeable future). AGNC Investment Corp. ( AGNC ), ARMOUR Residential REIT Inc. ( ARR ), Cherry Hill Mortgage Investment Corp. ( CHMI ), Dynex Capital Inc. ( DX ), Invesco Mortgage Capital Inc. ( IVR ), Annaly Capital Management Inc. ( NLY ), Orchid Island Capital Inc. ( ORC ), and Two Harbors Investment Corp. ( TWO ) are currently classified as a fixed-rate agency mREIT. Out of these 8 agency mREITs, CHMI and TWO currently have a large mortgage servicing rights (“MSR”) sub-portfolio as well.
Second, there are mREIT companies who earn varying portions of income from investing in agency MBS holdings, non-agency MBS holdings, other securitizations, and non-securitized mortgage-related debt and equity investments (including residential/commercial loans). This type of company is known as a “hybrid” mREIT. In regards to non-agency MBS, this includes (but is not limited to) Alt-A, prime, subprime, and re/non-performing loans where the principal and interest are not guaranteed by a GSE. Since there is no “government guarantee” on the principle or interest payments of non-agency MBS and residential/commercial loans (or rental income on properties), coupons are generally higher when compared to agency MBS of a similar maturity. However, borrowing costs (including repurchase agreements) for these specific investments are also higher (no government guarantee; credit risk). Due to the subtle yet identifiable differences between agency MBS, non-agency MBS, and residential/commercial loans, I like to differentiate between an agency and a hybrid mREIT company. Since there is credit risk when it comes to non-agency MBS and residential/commercial loans, leverage ratios are typically lower when investing in these securitizations/investments when compared to agency MBS (even when credit risk remains low). Arlington Asset Investment Corp. ( AAIC ), Chimera Investment Corp. ( CIM ), Ellington Financial Inc. ( EFC ) (converted to a REIT in 2019), MFA Financial Inc. ( MFA ), AG Mortgage Investment Trust Inc. ( MITT ), New York Mortgage Trust Inc. ( NYMT ), and Ready Capital Corp. ( RC ) are currently classified as a hybrid mREIT. It should be noted, during July 2022, AAIC was moved from a fixed-rate agency mREIT to a hybrid mREIT due to the company’s gradual shift away from fixed-rate agency MBS into a greater proportion of non-agency MBS, non-securitized mortgage-related investments, and mortgage servicing rights financing receivables. AAIC exited the company’s single-family residential (“SFR”) sub-portfolio late last year. It should also be noted RC was moved from an originator and servicer mREIT to a hybrid mREIT during the fourth quarter of 2023 due to the company’s rapidly declining proportion of paycheck protection program (“PPP”) loans (which the company also services) directly due to the COVID-19 pandemic.
Third, there are mREIT companies that invest in, but are not limited to, a combination of agency MBS, non-agency MBS, credit risk transfers (“CRT”), other mortgage-related investments, non-securitized debt investments (including residential, multifamily, and commercial loans), and MSRs. There are also mREIT companies that have underlying subsidiaries who directly originate mortgages (including via correspondent production) and/or mortgage-related debt products. I currently believe RITM and PennyMac Mortgage Investment Trust ( PMT ) should be classified as an “originator and servicer” mREIT. Since RITM and PMT currently have at least a modest portion of the company’s investment portfolio in MSR and MSR-related investments, which act as an “indirect” hedge (the same can be said regarding interest only [IO] securities), these companies do not need to utilize as high of a hedging coverage ratio when compared to the agency mREIT sub-sector (some could even argue to not have derivative instruments in place; if anything, “contra” hedges to counter a drop in rates/yields). Indirect hedges are not calculated within each company’s hedging coverage ratio within this analysis (not the main purpose of these investments). As I have pointed out in the past, these investments actually benefit, from a valuation standpoint, in a rising interest rate environment as prepayment risk (and in a majority of scenarios credit risk) decreases while there is an increase in projected future discounted cash flows (and vice versa).
Finally, there are mREIT companies that basically solely invest in non-securitized, commercial whole loans with underlying collateral (real estate) tied to offices, multifamily units, hotels, retail stores, industrial complexes, and other miscellaneous types of properties. Regarding the three commercial whole loan mREIT peers I currently cover, Ares Commercial Real Estate Corp. ( ACRE ), Blackstone Mortgage Trust, Inc. ( BXMT ), and Granite Point Mortgage Trust Inc. ( GPMT ), these companies typically originate/invest in variable-rate, interest-only senior secured (typically first lien) debt. Since ACRE, BXMT, and GPMT all had 98%+ of its investment portfolio in variable-rate debt as of 9/30/2023, these companies currently do not need to utilize a high hedging coverage ratio (some could even argue to not have derivative instruments in place; LIBOR/SOFR floors are a good substitute as well).
Now let us start the comparative analysis between RITM and the 19 mREIT peers.
Leverage, Hedging Coverage Ratio, BV, Economic Return (Loss), and Premium (Discount) to Estimated Current BV Analysis - Overview
Let us start this analysis by first getting accustomed to the information provided in Table 1a and 1b below. This will be beneficial when explaining how RITM compares to the 19 mREIT peers in regards to the metrics stated earlier.
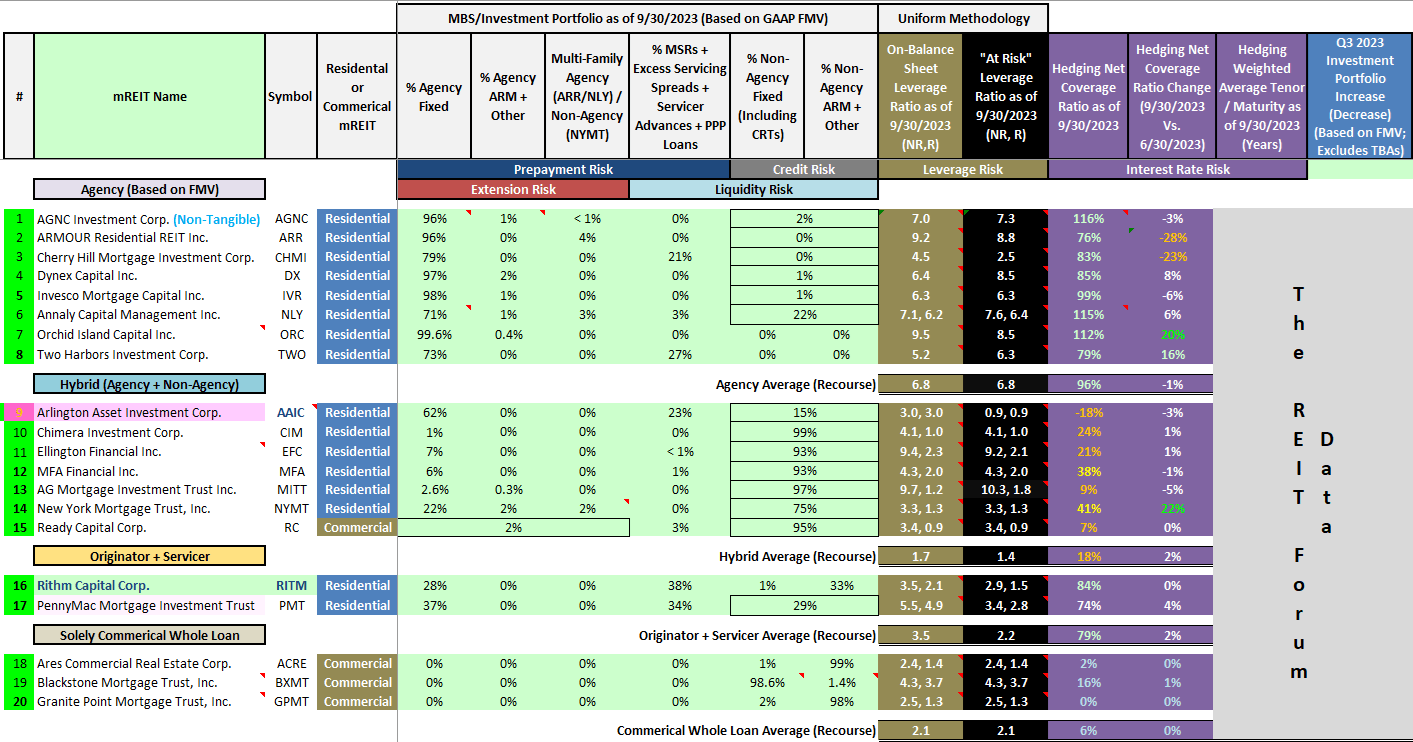
Table 1a – mREIT Asset Composition, Leverage, Hedging Coverage Ratio, and Change in Investment Portfolio Size
The REIT Forum
(Source: Table created by me, calculating asset compositions, leverage, and hedging coverage ratios from data provided by the SEC’s EDGAR Database )
Table 1a above provides the following information on RITM and the 19 mREIT peers (see each corresponding column): 1) generalized MBS/investment portfolio composition as of 9/30/2023; 2) on-balance sheet leverage ratio as of 9/30/2023; 3) at-risk (total) leverage ratio as of 9/30/2023; 4) hedging coverage ratio as of 9/30/2023; 5) quarterly change in hedging coverage ratio (9/30/2023 versus 6/30/2023); 6) hedging weighted average tenor/maturity; and 7) change in investment portfolio size (excludes off-balance sheet transactions). Some readers may notice some mREIT peers have “two sets” of leverage ratios within one color set. This is due to the fact I break out both non-recourse and recourse leverage. Within the two sets of leverage ratios within one column, recourse leverage ratios are represented by the lower figure on the right-hand side and are deemed more important.
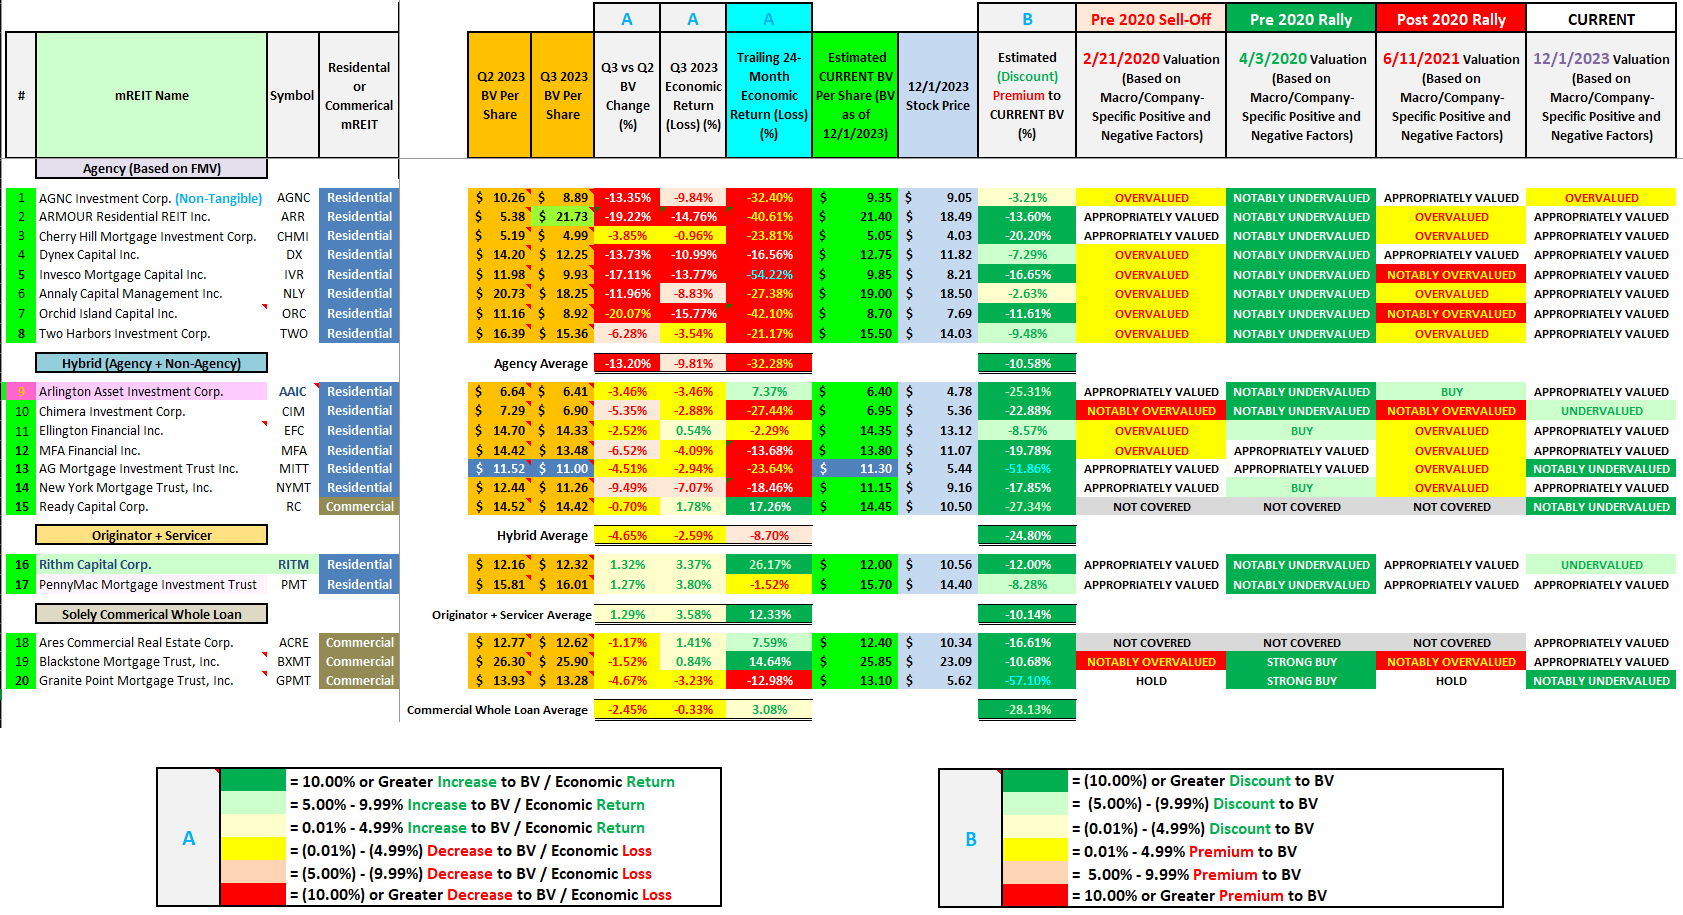
Table 1b – BV, Economic Return (Loss), and Premium (Discount) to Estimated Current BV Analysis
The REIT Forum
(Source: Table created by me, obtaining historical stock prices from NASDAQ and each company’s BV per share figures from the SEC’s EDGAR Database [link provided below Table 1a])
Table 1b above provides the following information on RITM and the 19 mREIT peers (see each corresponding column): 1) BV per share at the end of the second quarter of 2023 ; 2) BV per share at the end of the third quarter of 2023 ; 3) BV per share change during the third quarter of 2023 (percentage) ; 4) economic return (loss) (change in BV and dividends accrued for/paid) during the third quarter of 2023 (percentage) ; 5) economic return (loss) during the trailing 24-months (percentage) ; 6) my estimated CURRENT BV per share (BV as of 12/1/2023) ; 7) stock price as of 12/1/2023 ; 8) 12/1/2023 premium (discount) to my estimated CURRENT BV (percentage) ; 9) 2/21/2020 valuation assessment (pre market sell-off due to coronavirus [COVID-19]) ; 10) 4/3/2020 valuation assessment (post majority of market sell-off due to COVID-19) ; 11) 6/11/2021 valuation assessment (post majority of market rally due to COVID-19 epidemic and prior to more “hawkish” interest rate and monetary policy rhetoric) ; and 12) 12/1/2023 valuation assessment .
Analysis of RITM
As of 9/30/2023, RITM’s investment portfolio consisted of 28% and 0% fixed- and variable-rate agency MBS, respectively (based on FMV). When compared to 6/30/2023, RITM’s percentage of fixed- and variable-rate agency MBS increased 1% and remained unchanged, respectively. RITM also had 38% allocated to MSR investments. When calculated, this sub-sector remained unchanged. Finally, RITM continued to invest in non-agency MBS and non-MBS holdings (mainly mortgage-related residential whole loans) which accounted for 34% of the company’s investment portfolio balance as of 9/30/2023. When calculated, this combined sub-sector decreased (1%). When broken out, this sub-sector included, but was not limited to, RITM’s investments in residential whole loans, single-family rental (“SFR”) loans, consumer finance loans, commercial real estate (very minor proportion), and other miscellaneous mortgage-related investments.
Using Table 1a above as a reference, when excluding borrowings collateralized by assets held in “securitization trusts” (non-recourse debt), RITM had an on-balance sheet leverage ratio of 2.1x while the company’s at-risk (total) leverage ratio, when including its off-balance sheet net (short) “to-be-announced” (“TBA”) MBS position, was 1.5x as of 9/30/2023. RITM had an on-balance sheet and at-risk (total) leverage ratio of 2.0x and 1.3x as of 6/30/2023, respectively. As such, RITM very slightly increased the company’s on-balance sheet and at-risk (total) leverage during the third quarter of 2023. This was mainly due to a very minor increase in RITM’s on-balance sheet investment portfolio size and a slight decrease in the company’s net (short) TBA MBS position during the quarter. As of 9/30/2023, RITM had the lowest at-risk (total) leverage ratio when compared to the other originator + servicer mREIT sub-sector peer within this analysis, PMT.
Moving on, RITM had a BV of $12.16 per common share at the end of the second quarter of 2023. RITM had a BV of $12.32 per common share at the end of the third quarter of 2023. This calculates to a quarterly BV increase of 1.32%. When including RITM’s quarterly dividend of $0.25 per common share, the company had an economic return of 3.37% for the third quarter of 2023. When compared to RITM’s originator + service mREIT sub-sector peer PMT, a very similar quarterly BV and economic return performance. As a whole, I correctly projected most agency mREIT sub-sector peers would record a notable (at or greater than a 10.00%) BV decrease during the third quarter of 2023. I also correctly projected most hybrid mREIT sub-sector peers would record a minor - modest (up to a 9.99%) BV decrease during the third quarter of 2023. I also correctly projected the solely commercial whole loan mREIT sub-sector peers would record a minor (up to a 4.99%) BV decrease during the third quarter of 2023. I also correctly projected RITM and PMT would modestly - notably outperform the broader mREIT sector regarding these performance metrics. Each mREIT’s earnings results were previously discussed with Investing Group subscribers in “real time” through earnings chat notes and subsequent earnings articles.
Unlike basically all other mREIT sub-sector peers, RITM has actually been able to grow the company’s BV over the prior 2 years or so as mortgage interest rates/U.S. Treasury yields have quickly risen. As shown in Table 1b above, this has led to a notable economic return outperformance for RITM. In fact, RITM’s trailing 24-month economic return of 26.17% is nearly a 9% outperformance when compared to the second best mREIT peer performer RC, at 17.26%. In close comparison, PMT has reported a trailing 24-month economic loss of (1.52%). Simply put, RITM has notably outperformed both the company’s sub-sector and broader sector peers over the past 2 years regarding both BV fluctuations and economic returns. This notable outperformance should be seen as a positive catalyst/trend which markets continue to not factor in regarding RITM’s stock price when compared to peers.
To understand RITM’s recent economic return dominance, it is important to have a basic understanding of what the company invests in and how it is different when compared to most broader mREIT sector peers. Table 1a above provided a good starting point on this distinction. However, let us now further discuss RITM’s investment and derivatives portfolios to spot certain characteristics which has impacted (and will impact future) results. Table 2a below provides an overview of RITM’s investment portfolio.
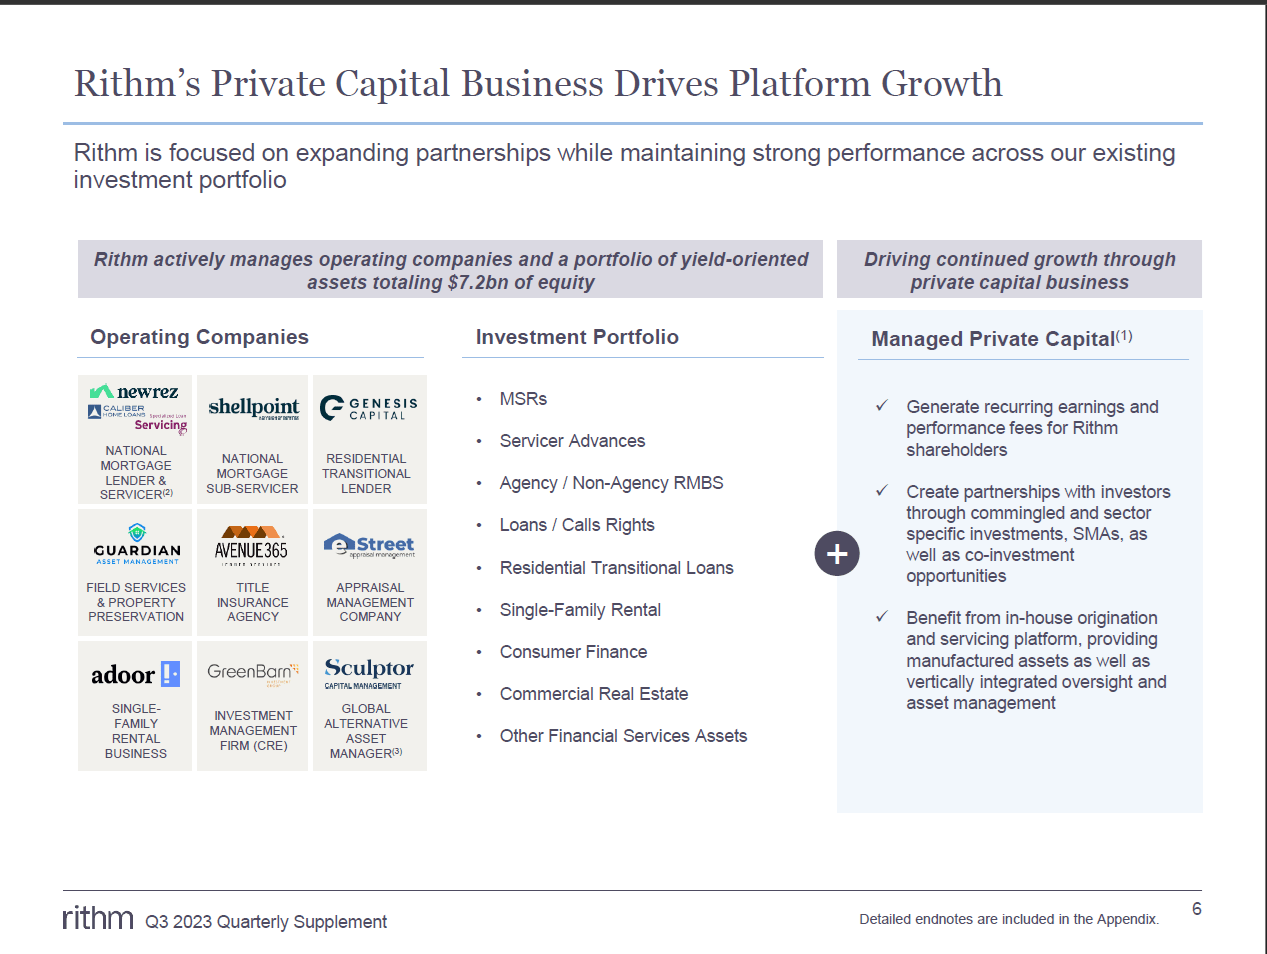
Table 2a – RITM Investment Portfolio Overview
RITM Q3 2023 Shareholder Presentation
(Source: Table obtained from RITM’s quarterly shareholder presentation for the third quarter of 2023.)
Using Table 2a above as a reference, RITM’s investment portfolio consists of the following: 1) MSRs; 2) servicer advances (directly related to MSRs); 3) agency/non-agency residential MBS; 4) residential whole loans (including certain call rights on said loans); 5) residential transitional/bridge loans; 6) SFR loans; 7) consumer finance loans; 8) commercial real estate loans; and 9) other financial servicing-related assets. This table also provides the applicable underlying subsidiary(ies) for each sub-portfolio. Simply put, when compared to say a typical agency mREIT peer, RITM has a wide array of financial investments. This added diversification directly results in “natural hedges” which actually acts as a “contra-hedge” versus the agency mREIT sector. For instance, when mortgage interest rates/U.S. Treasury yields net increase, generally all agency mREIT sub-sector peers typically experience BV decreases over a prolonged period of time. This becomes especially true when spread/basis risk spikes (as we recently saw earlier this year). This is due to the fact the value of long-term, fixed-rate agency MBS prices decrease which is only partially mitigated by related hedging/derivative instruments. However, within RITM’s investment portfolio, the company has allocated a notable proportion of capital to MSR and MSR-related assets. As extensively discussed in the past, mainly through our Investing Group, MSR and MSR-related asset typically gain in value when mortgage interest rates/U.S. Treasury yields net increase.
Of course, fully modeling out valuation fluctuations within each of RIMT’s sub-portfolios is much more involved versus this basic statement (again, something we do on the subscriber side) but readers should get the basic “gist” of this relationship for purposes of this sector comparison article. Table 2 is simply providing a basic understanding of the underlying operating companies that are owned/managed by RITM. This includes, but is not limited to, 9 existing underlying subsidiaries and 2 recently closed acquisitions, Specialized Loan Servicing LLC (“SLS”) and Sculptor Capital Management Inc. (“SCU”). Again, the key point here is continued acquisitions within core business operations (MSR-related investments regarding SLS) and broadening diversification within new investment opportunities (amongst other investments, another asset manager with SCU).
While RITM continues to have a diverse array of underlying subsidiaries and investment segments, one of the company’s main driver of BV fluctuations and earnings remains its MSR and MSR-related investments. As such, let us take a quick look at RITM’s MSR sub-portfolio via Table 2b below.
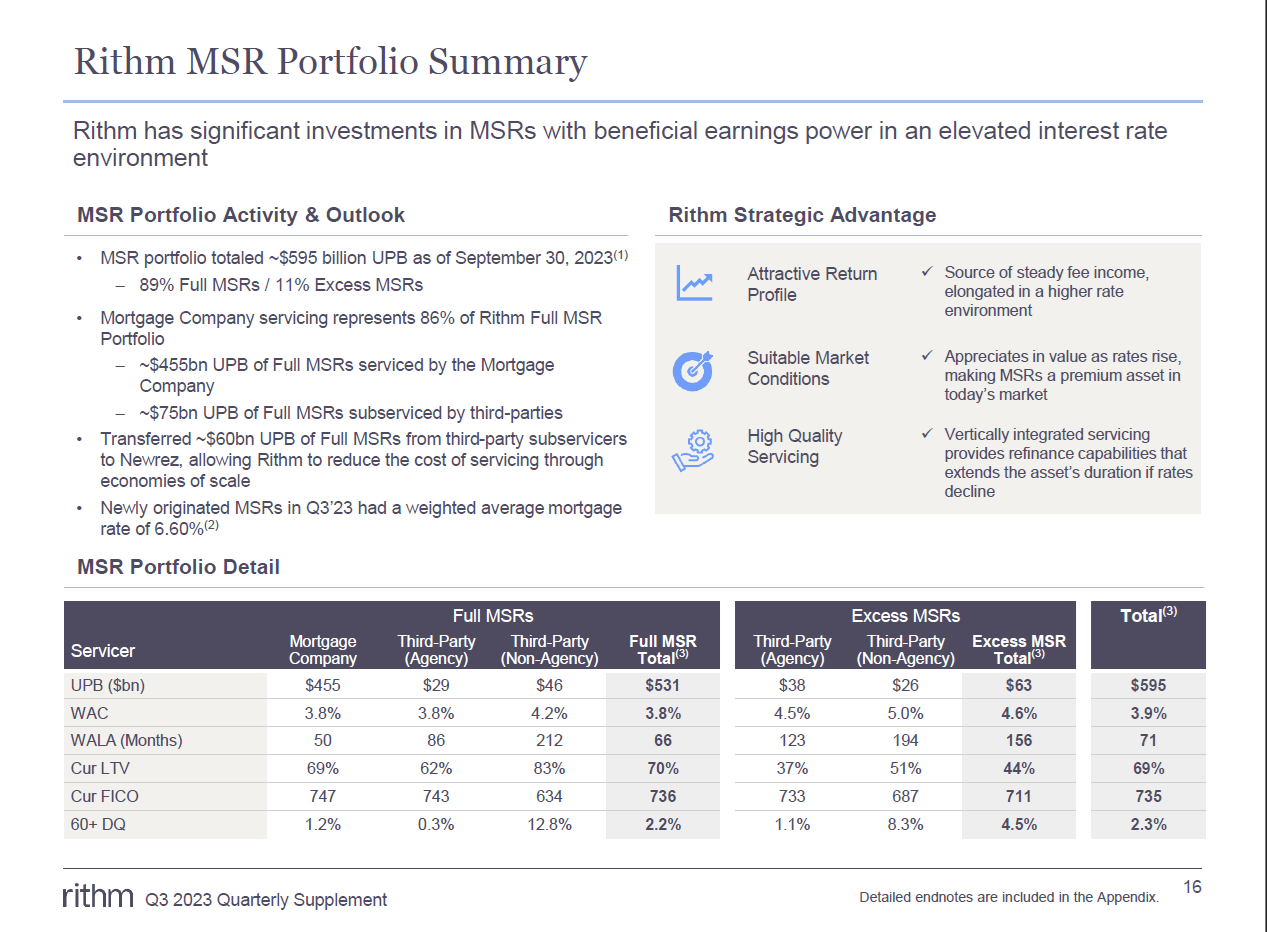
Table 2b – RITM MSR Sub-Portfolio Overview
RITM Q3 2023 Shareholder Presentation
(Source: Table obtained from RITM’s quarterly shareholder presentation for the third quarter of 2023 [link provided below Table 2a].)
Using Table 3 above as a reference, let us provide an overview of some key metrics regarding this sub-portfolio. RITM’s MSR sub-portfolio consisted of an underlying unpaid principal balance (“UPB”) of $595 billion as of 9/30/2023. In addition, RITM’s MSRs and excess MSRs had a weighted average coupon (“WAC”) of 3.8% and 4.6%, respectively. RITM’s MSRs and excess MSRs had a loan-to-value (“LTV”) of 70% and 44%, respectively. Regarding credit metrics, RITM’s MSRs and excess MSRs had a 60-day+ delinquency rate of 2.2% and 4.5%, respectively. These percentages remain near recent historical lows. To remain non-bias, I anticipate a minor – modest “uptick” in delinquency rates over the foreseeable future (2024 – 2025) but nothing overly “alarming” ; even if the economy moves into a mild recession. This is already factored into our modeling, per share recommendation ranges, and risk rating. Further analysis of RITM’s underlying investment sub-portfolios is outside the scope of this particular sector comparison article (and provided within our Investing Group).
Moving on, to highlight the recent activity within RITM’s derivatives portfolio, Table 3 is presented below.
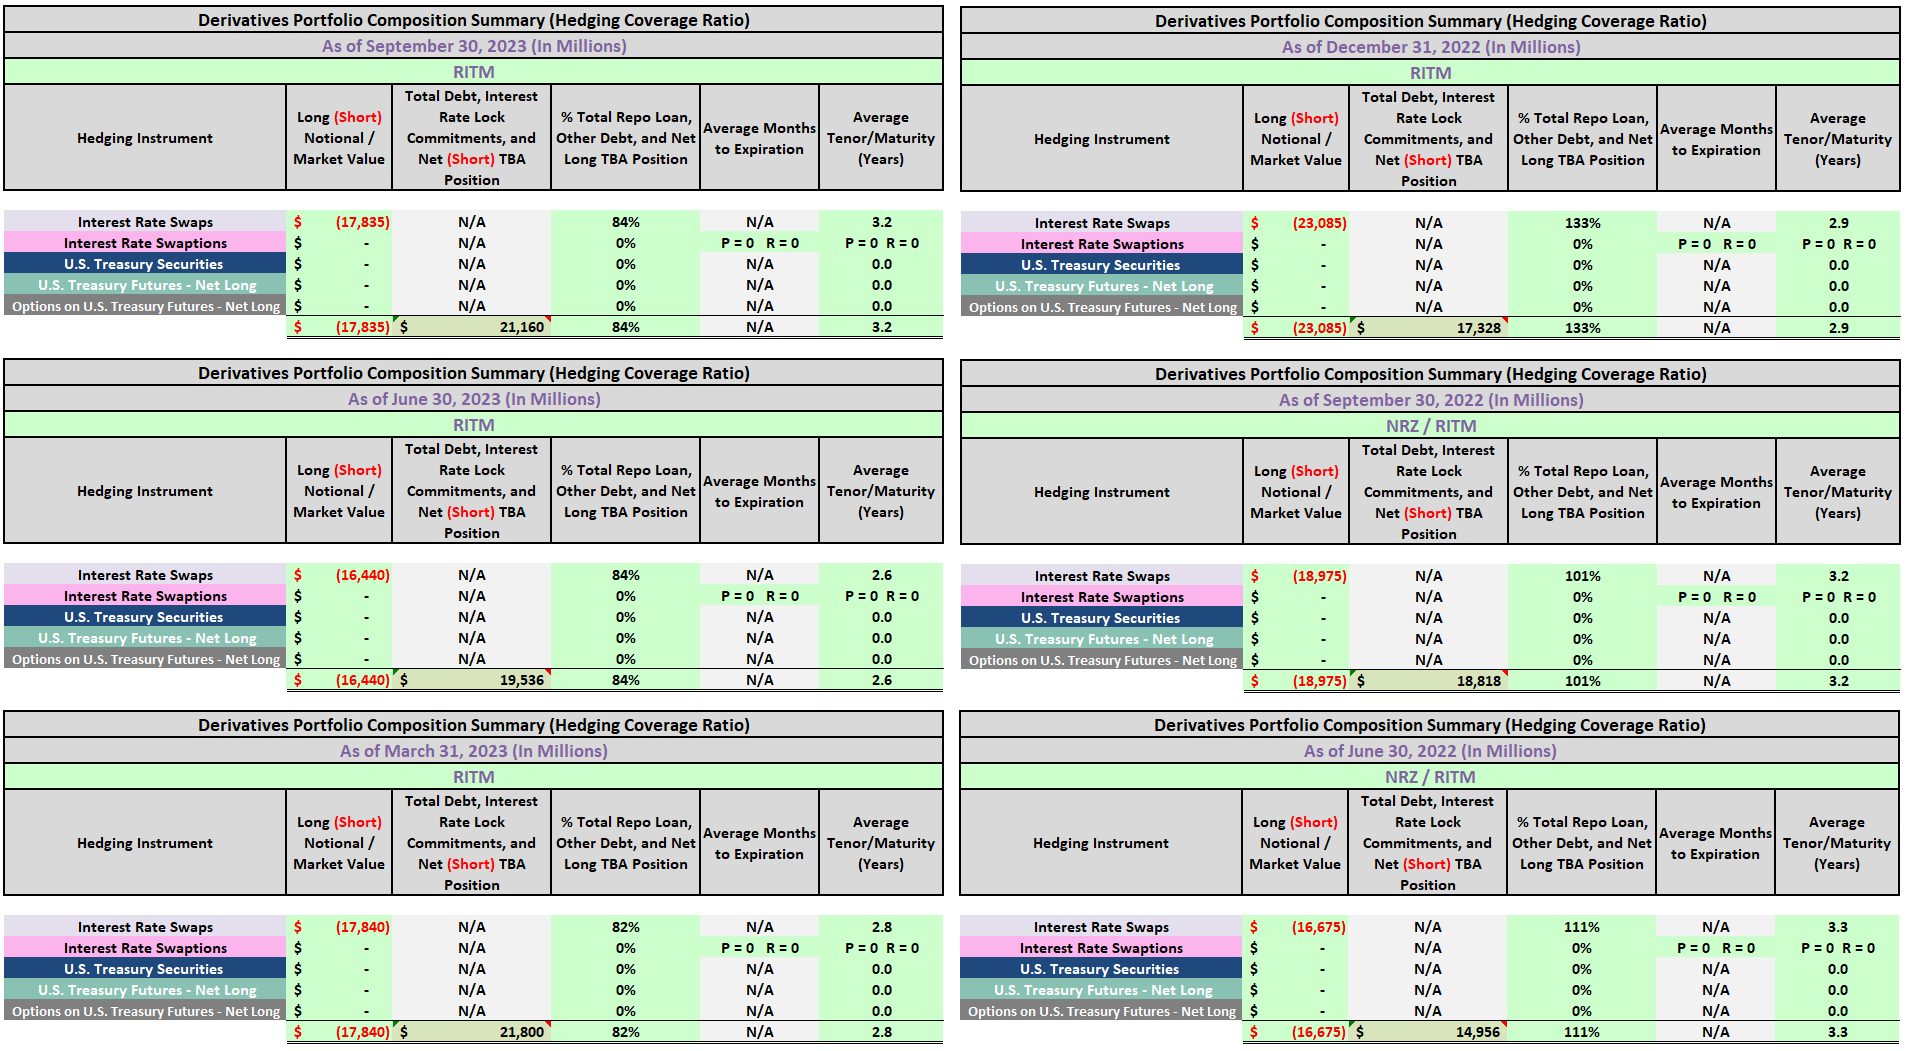
Table 3 – RITM Hedging Coverage Ratio (As of 9/30/2023 Versus Prior 5 Quarters)
The REIT Forum
(Source: Table created by me, partially using RITM data obtained from the SEC’s EDGAR Database [link provided below Table 1a])
Since one of RITM’s main investments are MSR and MSR-related assets, the company also invests in fixed-rate agency MBS which act as a natural hedge to said investments. However, to take RITM’s derivatives/hedging strategy one step further, to further combat interest rate/spread risk inherently associated with fixed-rate agency MBS, the company also utilizes interest rate payer swaps and net (short) TBA MBS investments.
Using Table 3 above as a reference, RITM had a net (short) interest rate swaps position of ($16.4) billion as of 6/30/2023. When calculated, RITM’s hedging coverage ratio very slightly increased to 84% as of 6/30/2023 from 82% as of 3/31/2023. RITM had a net (short) interest rate swaps position of ($17.8) billion as of 9/30/2023. When calculated, mainly due to the slight increase in RITM’s on-balance sheet fixed-rate agency MBS sub-portfolio offset by a slight decrease in the company’s net (short) TBA MBS position, its hedging coverage ratio remained unchanged at 84% as of 9/30/2023.
Moving on, once again using Table 1b above as a reference, as of 12/1/2023 RITM’s stock price traded at $10.56 per share. When calculated, RITM’s stock price was trading at a (12.00%) discount to my estimated CURRENT BV (BV as of 12/1/2023). Simply put, RITM’s stock price traded at a notable (greater than a 10%) discount to my estimated CURRENT BV and at a slightly more attractive valuation when compared to PMT. I continue to believe RITM “deserves” to trade at a slightly - modestly higher valuation when compared to the company’s closest sub-sector peer, PMT, and a modestly higher valuation when compared to most broader sector mREIT peers .
I believe the trailing 24-month total economic return (loss) metric is a great tool in spotting each mREIT’s historical performance. A great tool when also considering future general expectations versus peers. As such, as stated later in the article, I currently believe RITM is undervalued (a BUY recommendation) from a stock price perspective.
Comparison of RITM’s Recent Economic Return (Loss), Leverage, Hedging Coverage Ratio, and Valuation to 19 mREIT Peers in Ranking Order:
The REIT Forum Feature
Conclusions Drawn (PART 1)
PART 1 of this article has analyzed RITM and 19 mREIT peers in regards to the following metrics: 1) trailing 24-month economic return (loss) ; 2) leverage as of 9/30/2023 ; 3) hedging coverage ratio as of 9/30/2023 ; and 4) premium (discount) to my estimated CURRENT BV .
First, RITM’s trailing 24-month economic return of 26.17% was a notable outperformance versus ALL covered mREIT peers (both sub-sector and broader sector peers). For example, the agency, hybrid, originator + servicer, and commercial whole loan average was (32.28%), (8.70%), 12.33%, and 3.08%, respectively. Specifically, RITM notably outperformed the company’s closest sector peer, PMT, by a whopping 27.68%. This was mainly due to the recent composition of RITM’s investment and derivatives portfolio and the net movement of mortgage interest rates/U.S. Treasury yields during this timeframe. Extremely detailed reasoning of RITM’s recent notable economic return outperformance was provided in quarterly earnings assessment articles (Investing Group feature).
Second, RITM’s at-risk (total) leverage as of 9/30/2023 was below both the originator + servicer sub-sector and broader mREIT sector average. RITM typically runs below average leverage versus the company’s closest sector peer, PMT, and agency mREIT peers when looking back multiple years. This helps combat BV volatility.
Third, RITM’s hedging coverage ratio remained near the originator + servicer mREIT average as of 9/30/2023. However, RITM continues to utilize net long fixed-rate agency MBS in case mortgage interest rates/U.S. Treasury yields net decrease over the foreseeable future. This is not represented in RITM’s hedging coverage ratio to maintain a consistent, sector-wide metric but is tracked separately within another version of the ratio. Simply put, RITM remains well diversified to deliver attractive risk-adjusted returns over multiple interest rate scenarios. That said, to remain non-bias, RITM should be considered more of a “contra mREIT play” . RITM typically notably outperforms most (if not all) broader sector peers in a rising/elevated interest rate environment but will gravitate towards sector averages when mortgage interest rates/U.S. Treasury yields net decrease to, at the least, a modest extent.
Finally, RITM’s current valuation, when compared to my estimate of each mREIT’s CURRENT BV (BV as of 12/1/2023), was slightly more attractively valued when compared to PMT. In addition, through the metrics provided within this two-part sector comparison article (including factors/metrics not directly discussed), I believe RITM “deserves” to trade at a slight - modest premium valuation to basically all mREIT peers (including PMT). As such, this is one of the reasons why I believe RITM is currently undervalued. I would strongly suggest readers consider CURRENT BVs (as opposed to prior period BVs) when assessing whether a stock is attractively valued or not (available to subscribers on a weekly basis).
Dependent upon the metrics laid out in the tables above, results across the broader mREIT sector will slightly - notably vary from peer-to-peer; dependent upon specific asset classifications and risk management strategies put into place. The relationship between MBS/investment pricing and derivative instrument valuations needs to be constantly monitored (which I continually perform throughout the quarter). If I start to see a more notable positive/negative relationship unfold, I will inform readers through several avenues within Seeking Alpha (through articles, the live chat feature of our Investing Group, and/or comments).
Moving forward, the prior Caliber Homes and Genesis acquisitions will continue to benefit RITM as a whole. The same holds true regarding RITM’s more recent partial equity stake in GreenBarn, a subsidiary focused on investments in commercial real estate (again, thinking longer-term here). As such, RITM continues to diversify the business model into areas outside residential mortgages and mortgage-related investments. Management remains in the process of “spinning-off” the mortgage origination/servicing business (including, but not necessarily limited to, NewRez/Caliber/Shellpoint). This has been discussed, at length, within our Investing Group starting back in 2020 – 2021. The “value unlocking” of these sub-portfolios, by spinning off several subsidiaries, forming a new entity, and taking it public (current RITM shareholders would theoretically own shares in the newly-formed public entity), would be a positive catalyst/trend. This possibility has been built into our bifurcated modeling for RITM since 2019 (separate BVs). As such, this entire concept has already been taken into consideration regarding RITM’s percentage recommendation ranges, risk rating, and price target.
Regarding RITM’s proposed acquisition of the asset manager SCU, on 11/17/2023 SCU common shareholders (Class A + B) overwhelmingly voted FOR the RITM merger proposal (by nearly a 10:1 ratio). This ends a long, drawn-out/drama-filled process. This has been discussed, at length, within our Investing Group. Regarding RITM’s definitive agreement to acquire SLS, this is right in the company’s “ballpark” per se; MSRs and related assets (including an origination servicing business). As stated at the time this acquisition was first announced, I believe this was a smart decision by RITM. The SLS acquisition equates to 10% of RITM’s total shareholder’s equity as of 9/30/2023.
My BUY, SELL, or HOLD Recommendation
From the analysis provided above (using Table 1b as a direct reference), including additional catalysts/factor not discussed within this article, I current rate RITM as a SELL when I believe the company's stock price is trading at or greater than a 5% premium to my projected CURRENT BV (BV as of 12/1/2023; $12.00 per share), a HOLD when trading at less than a 5% premium through less than a (7.5%) discount to my projected CURRENT BV, and a BUY when trading at or greater than a (7.5%) discount to my projected CURRENT BV.
Therefore, I currently rate RITM as UNDERVALUED from a stock price perspective .
As such, I currently believe RITM is a BUY recommendation.
However, to remain non-bias, I/we had a NOTABLY UNDERVALUED classification (STRONG BUY recommendation) on RITM (and most of the broader mREIT sector) earlier this year which quickly “paid off” to readers/subscribers who deeded our advice with the recent rally. So, currently some good value with RITM but technically, yes, not as great of value versus earlier this year.
My current price target for RITM is approximately $12.60 per common share. This is currently the price where my recommendation would change to OVERVALUED/a SELL recommendation. The current price where my classification/recommendation would change to APPROPRIATELY VALUED/a HOLD recommendation is approximately $11.10 per common share. Put another way, the following are my CURRENT BUY, SELL, or HOLD per share recommendation ranges (subscribers get this type of data on all 20 mREIT stocks I currently cover on a weekly basis):
$12.60 per share or above = SELL
$11.11 - $12.59 per share = HOLD
$9.61 - $11.10 per share = BUY
$9.60 per share or below = STRONG BUY
Along with the data presented within this article, this recommendation considers the following mREIT catalysts/factors: 1) projected future MBS/investment price movements ; 2) projected future derivative valuations ; and 3) projected near-term (up to 1-year) dividend per share rates. As discussed earlier, this includes all recent, current, and projected macroeconomic indicators and FOMC monetary policy.
mREIT Sector Recommendations as of 12/1/2023
Once again using Table 1b above as a reference, I want to highlight to readers what I/we are conveying to subscribers when it comes to sector recommendations as of 12/1/2023 (last Friday’s close).
As of 12/1/2023, I/we had a STRONG BUY recommendation (notably undervalued) on the following mREIT stocks analyzed above (in no particular order): 1) MITT; 2) RC; and 3) GPMT.
As of 12/1/2023, I/we had a BUY recommendation (undervalued) on the following mREIT stocks analyzed above (in no particular order): 1) CIM; and 2) RITM.
As of 12/1/2023, I/we had a HOLD recommendation (appropriately valued) on the following mREIT stocks analyzed above (in no particular order): 1) ARR; 2) CHMI; 3) DX; 4) IVR; 5) NLY; 6) ORC; 7) TWO; 8 ) AAIC; 9) EFC; 10) MFA; 11) NYMT; 12) PMT; 13) ACRE; and 14) BXMT.
As of 12/1/2023, I/we had a SELL recommendation (overvalued) on the following mREIT stocks analyzed above (in no particular order): 1) AGNC.
So, as of 12/1/2023 I/we now have 3 mREITs rated as a STRONG BUY, 2 rated as a BUY, 14 rated as a HOLD, 1 rated as a SELL, and 0 rated as a STRONG SELL. Simply put, more bullish when compared to the December – March 2023 and August – September 2023 but a bit less bullish when compared to April – July 2023 and October – November 2023.
PART 2 of this article will cover dividend metrics for the fourth quarter of 2023 and projections for the first quarter of 2024. Readers looking for my/our mREIT dividend projections for the fourth quarter of 2023 can look in last quarter’s article (link provided near the beginning of this article).
My Personal RITM Past + Current Stock Disclosures
The following are my RITM (formerly NRZ) past and current stock disclosures and total returns since I have been writing on Seeking Alpha:
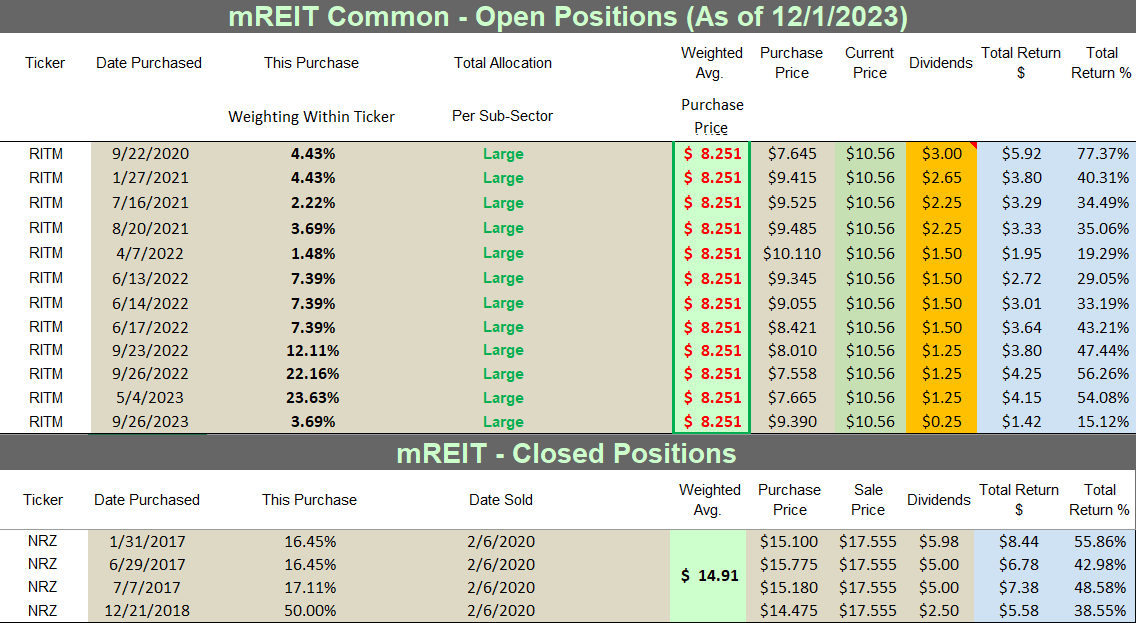
Table 8 – RITM Past + Current Stock Disclosures/Returns
The REIT Forum
Source: Taken Directly from the REIT Forum’s © Spreadsheets/Data
Final Note: All trades/investments I have performed over the past 7+ years have been disclosed to readers in “real time” (that day at the latest) via either the StockTalks feature of Seeking Alpha or, more recently, the “live chat” feature of our Investing Group (which cannot be changed/altered). Through these resources, readers can look up all my prior disclosures (buys/sells) regarding all companies I cover here at Seeking Alpha (see my profile page for a list of all stocks covered). Through StockTalk disclosures and/or the live chat feature of our Investing Group, at the end of November 2023 I had an unrealized/realized gain “success rate” of 89.9% and a total return (includes dividends received) success rate of 97.1% out of 69 total past and present mREIT and business development company ( “BDC”) positions (updated monthly; multiple purchases/sales in one stock count as one overall position until fully closed out). I encourage other Seeking Alpha contributors to provide real time buy and sell updates for their readers/subscribers which would ultimately lead to greater transparency/credibility. Beginning in January 2020, I transitioned all my real-time purchase and sale disclosures solely to members of our Investing Group. All applicable public articles will still have my “main ticker” purchase and sale disclosures (just not real-time alerts).
Simply put, a contributor’s/team’s recommendation track record should “count for something” and should always be considered when it comes to credibility/successful investing.
Understanding My/Our Valuation Methodology Regarding mREIT Common and BDC Stocks
The basic "premise" around my/our recommendations in the mREIT common and BDC sectors is value. Regarding operational performance over the long-term, there are above average, average, and below average mREIT and BDC stocks. That said, better-performing mREIT and BDC peers can be expensive to own, as well as being cheap. Just because a well-performing stock outperforms the company’s sector peers over the long-term, this does not mean this stock should be owned at any price. As with any stock, there is a price range where the valuation is cheap, a price where the valuation is expensive, and a price where the valuation is appropriate. The same holds true with all mREIT common and BDC peers. As such, regarding my/our investing methodology, each mREIT common and BDC peer has their own unique BUY, SELL, or HOLD recommendation range (relative to estimated CURRENT BV/NAV). The better-performing mREITs and BDCs typically have a recommendation range at a premium to BV/NAV (varying percentages based on overall outperformance) and vice versa with the average/underperforming mREITs and BDCs (typically at a discount to estimated CURRENT BV/NAV).
Each company’s recommendation range is "pegged" to estimated CURRENT BV/NAV because this way subscribers/readers can track when each mREIT and BDC peer moves within the assigned recommendation ranges (daily if desired). That said, the underlying reasoning why I/we place each mREIT and BDC recommendation range at a different premium or (discount) to estimated CURRENT BV/NAV is based on roughly 15-20 catalysts which include both macroeconomic catalysts/factors and company-specific catalysts/factors (both positive and negative). This investing strategy is not for all market participants. For instance, not likely a “good fit” for extremely passive investors. For example, investors holding a position in a particular stock, no matter the price, for say a period of 5+ years. However, as shown throughout my articles written here at Seeking Alpha since 2013, in the vast majority of instances I have been able to enhance my personal total returns and/or minimize my personal total losses from specifically implementing this particular investing valuation methodology. I hope this provides some added clarity/understanding for new subscribers/readers regarding my valuation methodology utilized in the mREIT common and BDC sectors.
Each investor's BUY, SELL, or HOLD decision is based on one's risk tolerance, time horizon, and dividend income goals. My personal recommendation will not fit each reader’s current investing strategy. The factual information provided within this article is intended to help assist readers when it comes to investing strategies/decisions. Please disregard any minor “cosmetic” typos if/when applicable.
For further details see:
Rithm Capital's Sector Comparative Analysis - Part 1 (Includes Recommendation For 19 Peers As Of 12/1/2023)