SMAWF - ROBO: Dragged Down By Manufacturing Semiconductors (Technical Analysis)
Summary
- Automation and robotics are mega-trends for multiple years and decades going forward. But now is not the right time to bet alongside this view.
- Weak global manufacturing activities and capex spend cuts in the semiconductor industry will dampen demand outlook.
- Technical analysis also suggests a sell-bias as prices are near monthly resistance locations.
Introduction
The automation industry has maintained steady growth over the past few years, with its many developments and applications seen in almost every walk of life. From robots fine-tuning manufacturing processes in industries to the self-checkout process in supermarkets, automation has pervaded our society more than we know.
With the recent downturn in the global economy's trajectory, a lot has veered off course, with every industry feeling the effect in one way or another. The robotics and automation industry is not exempt from this shakeup. I evaluate the opportunities this provides us here in this article:
ROBO: Exposure to Robotics & Automation
The ROBO Global Robotics and Automation Index ETF ( ROBO ) is an ETF that tracks companies involved in the development and production of robotics and automation technologies.
ROBO Exposure Mix
Sector Mix
ROBO Sector Mix (ROBO Website, Author's Analysis)
As can be seen in the chart above, ROBO is heavily geared towards just 3 industries; information technology (and within this, it would mostly be semiconductors), industrials and healthcare. Together, they make up almost 97% of the overall exposure. The top two sectors make up more than 84% of the overall exposure.
Within information technology, you may see software related exposure in sub-sectors such as semiconductor design. Cadence Design ( CDNS ) is a global leader here.
If you've ever visited a manufacturing plant, you would see a lot of stuff run by machines. These machines are made by the likes of ABB ( ABB ), Siemens ( SIEGY ), Honeywell ( HON ), Rockwell Automation ( ROK ), Fanuc Corporation ( FANUY ) ( FANUF ).
In the healthcare sector, many robots are used to aid in surgeries, and surgery simulations. Companies like Intuitive Surgical ( ISRG ) are good examples.
ROBO ETF Top 5 Holdings
ROBO Top 5 Holdings Mix (ROBO Website, Author's Analysis)
The top 5 holdings in ROBO are Harmonic Drive Systems ( HSYDF ), Intuitive Surgical ( ISRG ), Kardex Holding ( KRDXF ), IPG Photonics ( IPGP ), and Fanuc Corporation ( FANUY ) ( FANUF ).
ROBO's top 5 holdings only account for 9.2% of its total portfolio exposure, across various industries and geographies. Moreover, no single position has outsized representation in the portfolio to contribute significantly to overall performance of the ETF. This shows that ROBO is a well diversified ETF.
Fundamental Drivers for the ROBO ETF
Given their high sectoral weights, developments in the global industrial and semiconductor sectors will drive future performance of ROBO. Specifically, in industrials, capex spends of companies into new automotive equipment would be the key driver, not production volumes. However, it is reasonable to believe that upbeat production activity would lend itself to more capex investments as companies have more cash at their disposal to invest in improving their businesses and making them more competitive. To assess production activity levels, I look at the global manufacturing PMIs in three major global economies that together make up almost 50% of the global economy:
Global Contraction in Industrial Activity
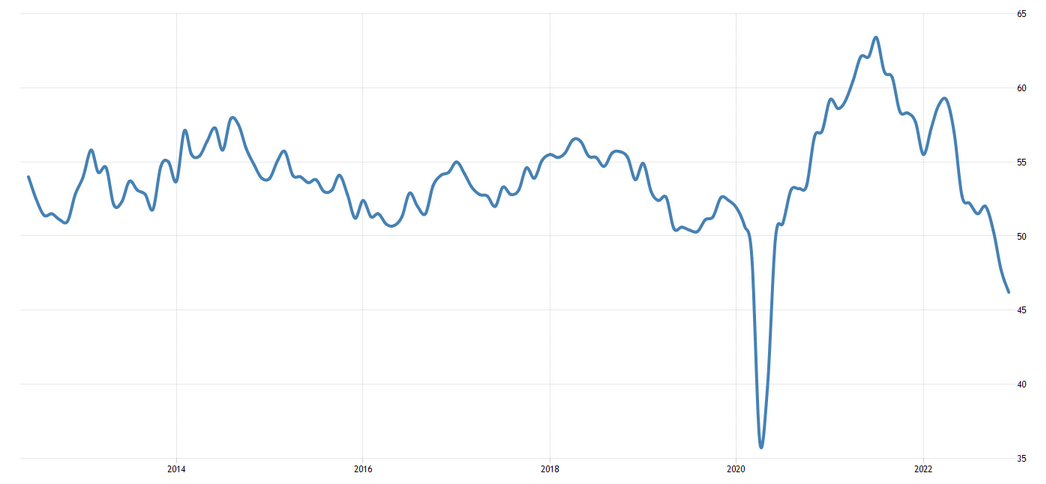
United States Manufacturing PMI
US Manufacturing PMI (Trading Economics)
The latest US Manufacturing PMI reading is at 46.2. As this figure is below 50, it indicates a contraction in the economy.
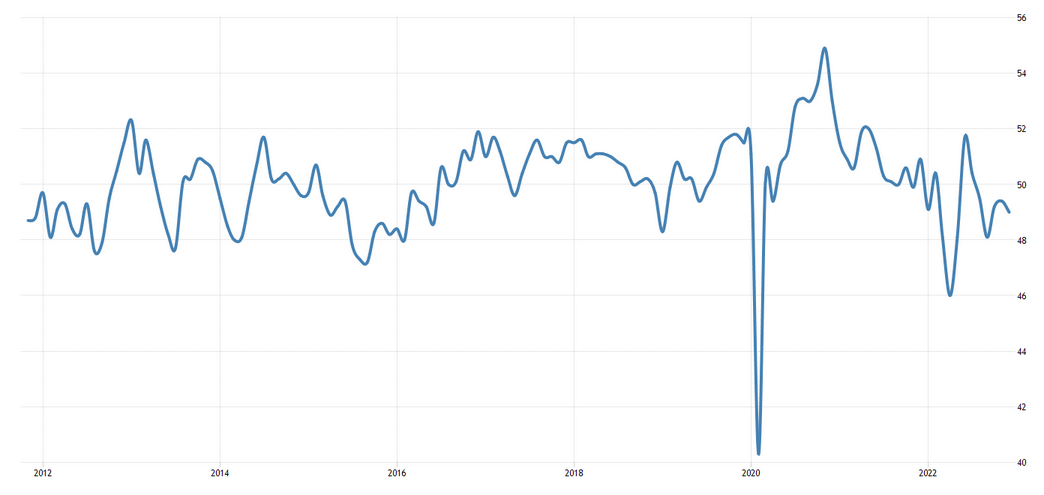
China Manufacturing PMI
China Caixin Manufacturing PMI (Trading Economics)
The latest China Caixin Manufacturing PMI reading is at 49. As this figure is below 50, it indicates a contraction in the economy.
Japan Manufacturing PMI
Japan Manufacturing PMI (Trading Economics)
The latest Japan Manufacturing PMI reading is at 48.9. As this figure is below 50, it indicates a contraction in the economy.
Thus, a large part of the global industrial activity is in contraction mode. As a consequence, the chances of capex investments being made across industrials is reduced. This implies that there are few bullish triggers for automation related stocks, despite a structural longer term trend that expects the market to grow at an 8.2% CAGR over the next 5 years.
Semiconductor Demand De-Growth in 2023
As noted earlier, the semiconductor market is a key driver of industrial automation product and services sales. Indeed, some of the most technologically advanced equipment in the world is found in semiconductor foundries.
In my earlier article on the Taiwanese stock market ( EWT ), I noted how an industry forecast by Gartner expects the revenue of the global semiconductor industry to fall in 2023 by 3.6% from the $618 billion recorded in 2022. More relevantly, on the capex side of things, IC Insights forecasts a 19% drop in capex spending in 2023. This is driven by general slowdown in the economy leading to delayed capex plans, and an especially weak memory chips market, for which capex spending in 2023 is expected to be down by at least 25% .
Takeaway
Naturally, these demand driver slowdowns do not spell much bullish sentiments for automation stocks.
Wisdom of the Crowds (Technical Analysis)
If this is your first time reading a Hunting Alpha article using technical analysis, you may want to read this post , which explains how and why I read the charts the way I do, utilizing the principles of Flow, Location, and Trap.
Relative Read of ROBO vs S&P500
ROBO vs SPX500 Technical Analysis (TradingView, Author's Analysis)
On the ROBO/SPX500 monthly chart, there's a fine emergence of a sell setup from the monthly resistance. After failing to break above the resistance, the ETF has ended up printing a trap confirmation as bulls bought the fake-out and got caught wrong-sided. I expect a return to the monthly support level as highlighted in the chart.
Standalone Read of ROBO
ROBO Technical Analysis (TradingView, Author's Analysis)
On the standalone ROBO monthly chart, a similar price pattern to what was seen in the relative chart is observed. Failing to break the $49.19 monthly resistance in December 2022, I think the price is now on a retreat to the $38.88 base. This move presents early sellers with an opportunity to ride the near-term wave for a 20.5% play. This setup aligns with the outlook of the fundamentals highlighted earlier.
Summary
Contracting industrial activities and cuts in planned capex spending does not bode well for sale of industrial automation and robotics solutions. This, combined with a clear near-term downtrend on both the standalone and relative charts, leads me to have a bit of a bearish outlook on ROBO. I will be keeping a continuous track on global PMI numbers to determine reliable signs of bullish trends again.
For further details see:
ROBO: Dragged Down By Manufacturing, Semiconductors (Technical Analysis)