XYLD - RYLD: Inflation First Dividends Second
2023-09-25 16:08:31 ET
Summary
- Global X Russell 2000 Covered Call ETF is a covered call exchange-traded fund that focuses on small cap stocks and employs an at-the-money buy write strategy with a dividend yield of 13.77%.
- When considering total returns compared to inflation, RYLD has not kept up with inflation since its inception in 2019.
- RYLD may not be a sustainable income investment for those living off the income for mid-long periods of time.
Thesis
The Global X Russell 2000 Covered Call ETF (RYLD) is an exchange-traded fund, or ETF, with a high dividend yield income seeking investors would love. Although the fund provides consistently high distributions, it has failed to outpace inflation in the last 4 years, making it a strong sell for me as it is not a sustainable investment for those living off the income now or in the future.
Fund Overview
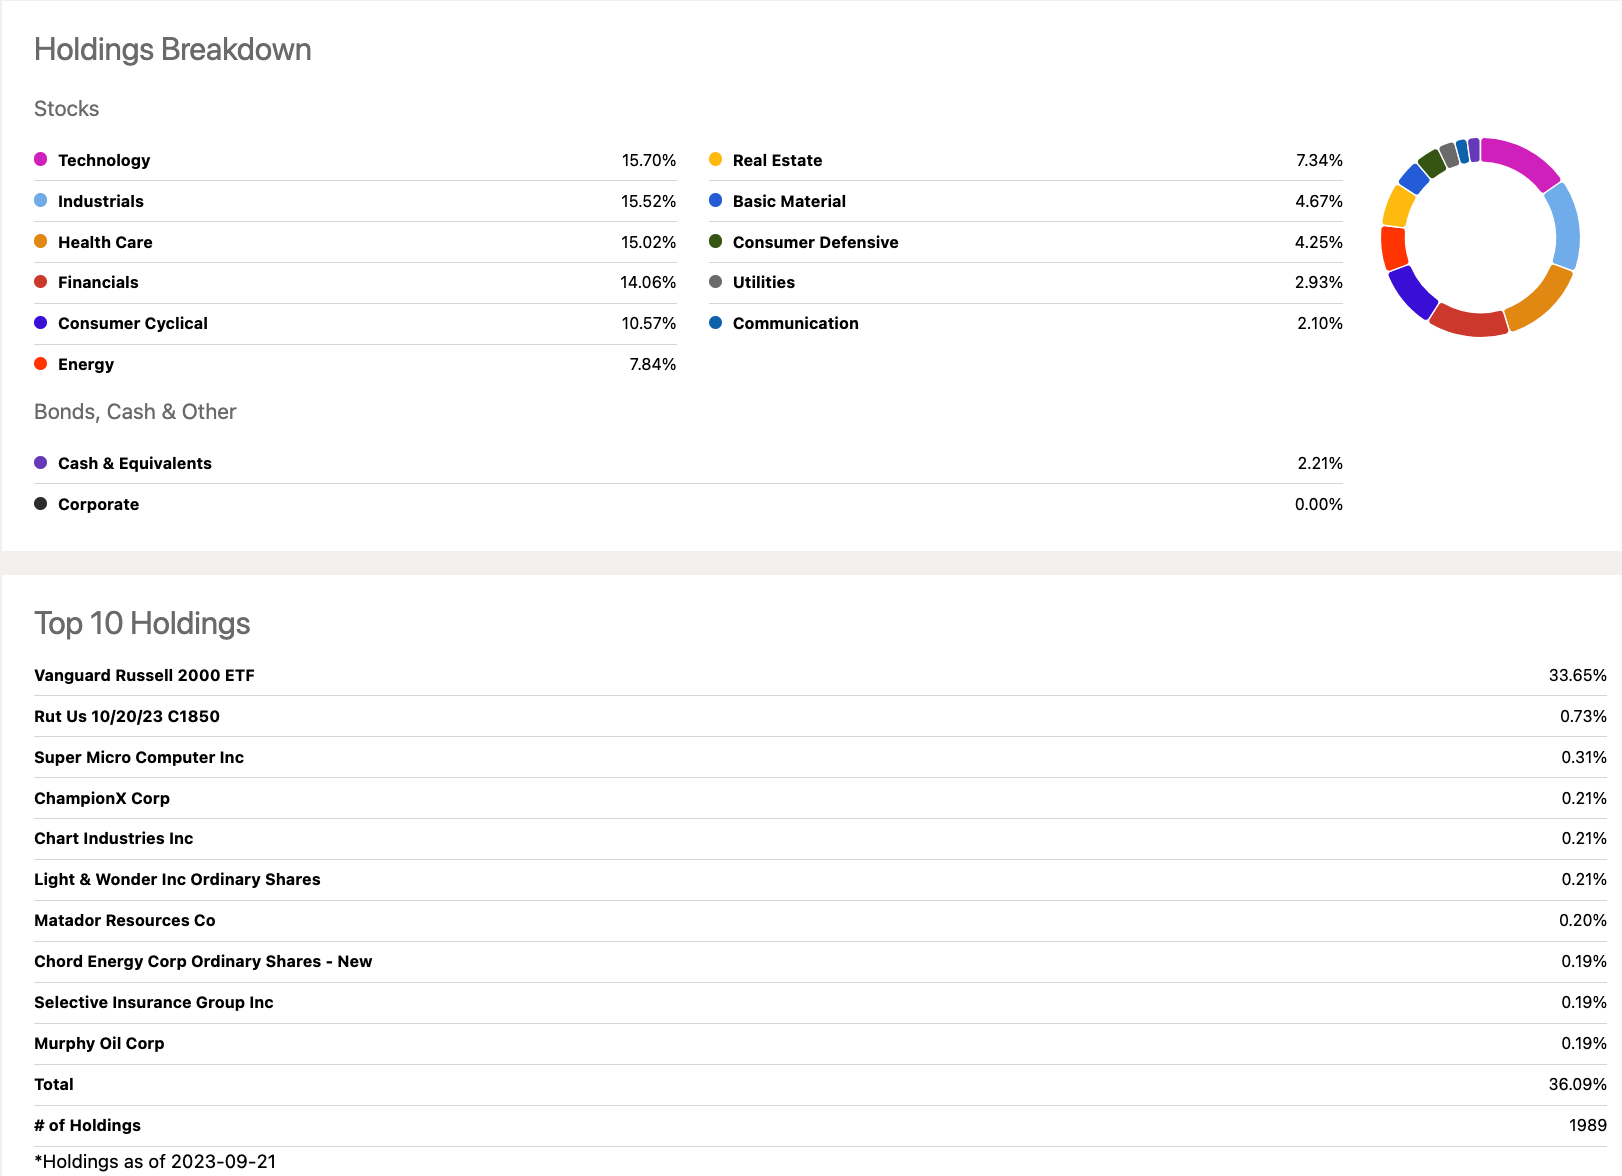
RYLD is a popular covered call ETF, with $1.5B assets under management ("AUM"), a diversified set of holdings, and a high yielding monthly dividend. Cousin of the popular The Global X NASDAQ 100 Covered Call ETF ( QYLD ), both employ the same at-the-money buy-write strategy :
The Global X Russell 2000 Covered Call ETF ((RYLD)) follows a “covered call” or “buy-write” strategy, in which the Fund buys the stocks in the Russell 2000 Index (at times by exposure to the Vanguard Russell 2000 ETF), and “writes” or “sells” corresponding call options on the Russell 2000 Index.
RYLD provides investors with exposure to the performance of the Russell 2000 Index, which represents the small-cap segment of the U.S. equity market, while generating income through an at-the-money covered call strategy. It includes approximately 2,000 smaller companies. For the covered call strategy, the ETF sells call options on some or all of the stocks it holds in its portfolio. By selling these call options, RYLD collects premiums from option buyers. These premiums generate income for the ETF, which is then distributed to investors in the form of dividends.
Typically, the fund's monthly distribution is either 1% of the NAV or 50% of the options premium, whichever is lower. The rest of the premium is reinvested into the fund to stabilize/grow the NAV. When the call options are sold on its holdings, it caps the gains because it agrees to sell the underlying assets at a specified price if the options are exercised. This strategy is a tradeoff between generating income and potentially limiting upside potential. It's an interesting business model, and that's what you're really buying into here: a risk management business, but is their model really addressing your personal finance risk management?
Dividend Performance
RYLD has high dividend metrics:
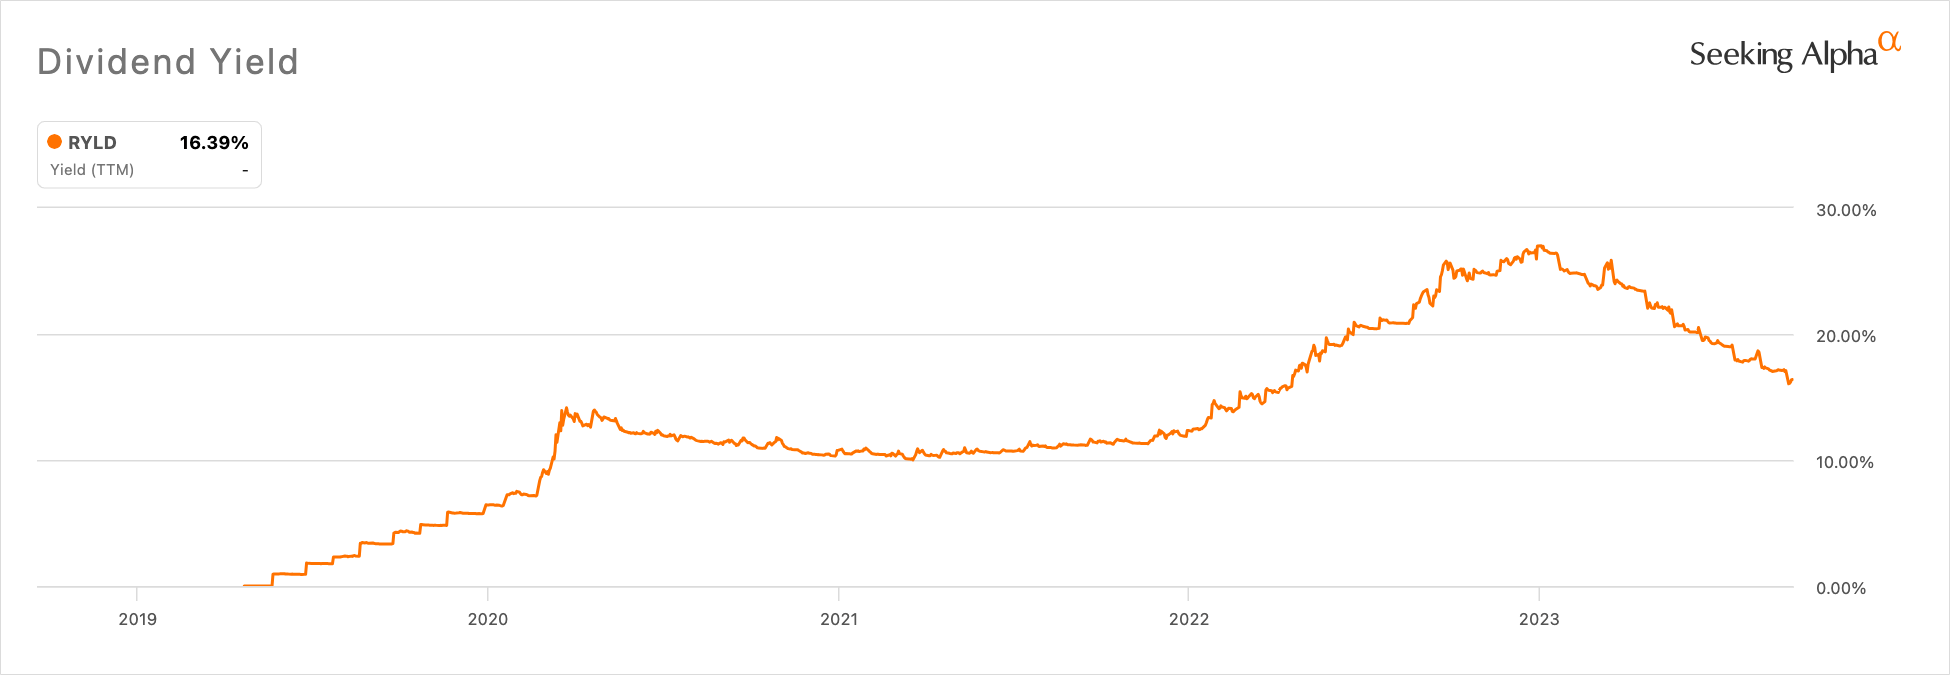
- Dividend Yield ((TTM)) 13.77%
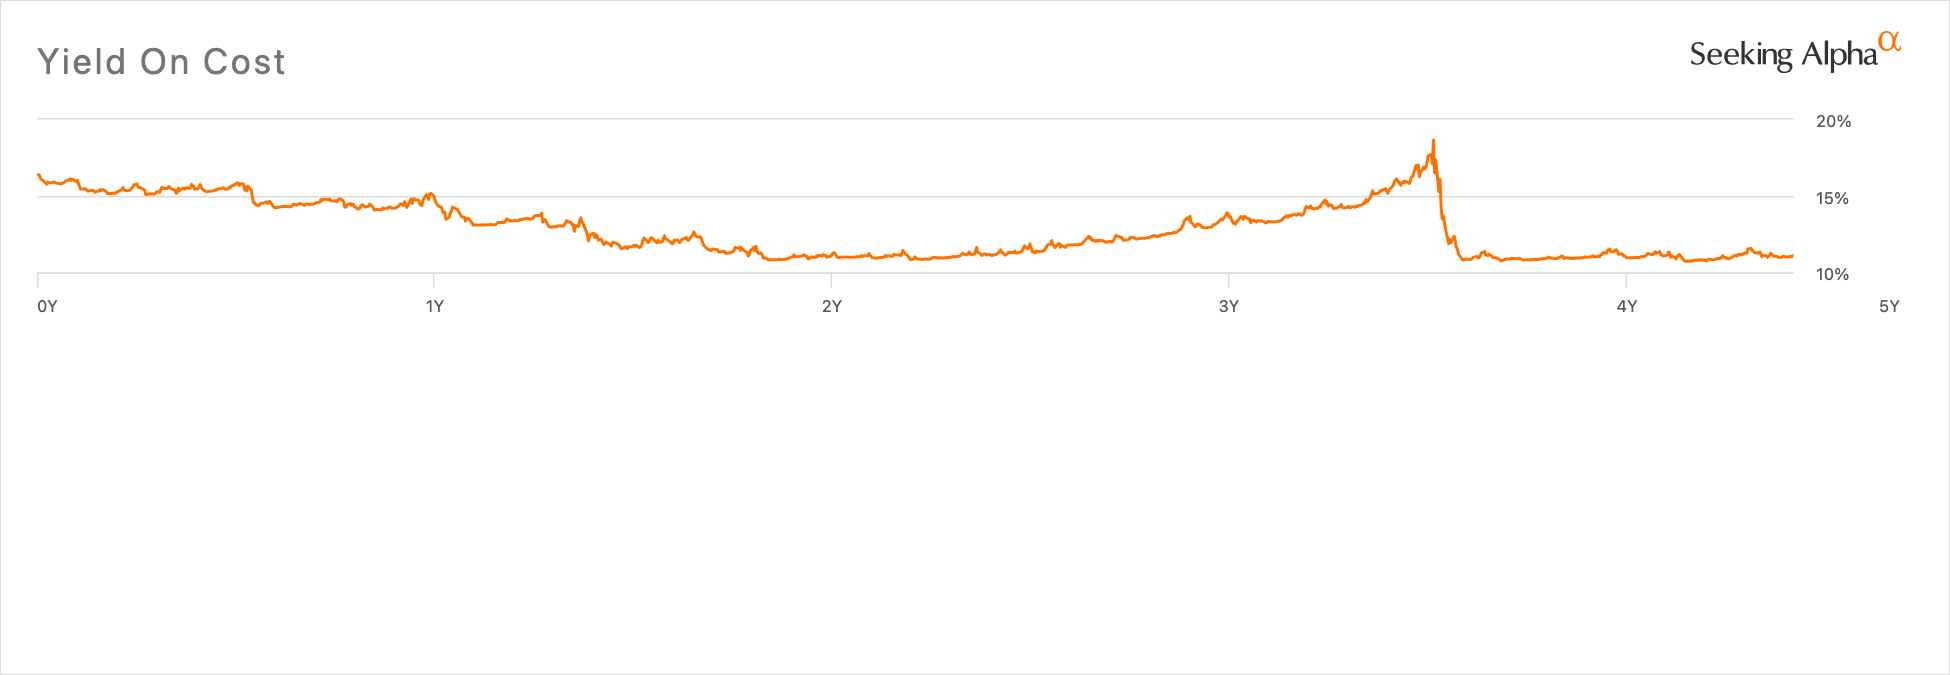
- Yield on Cost above 10% since inception
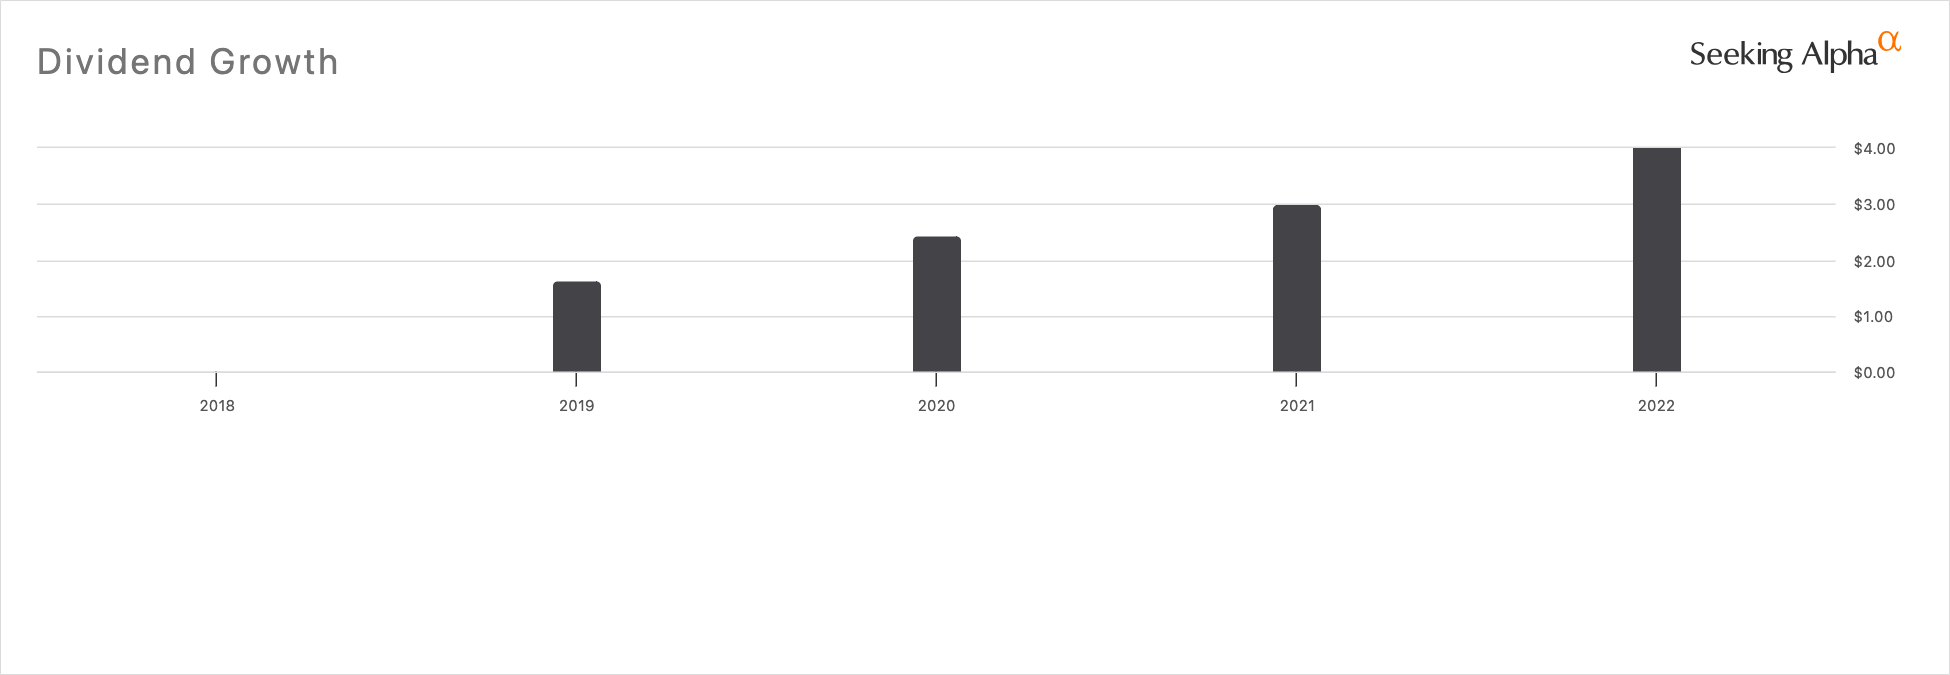
- YoY Average Dividend Growth CAGR of 52.5%.
RYLD Dividend Yield (TTM) (Seeking Alpha)
I believe Seeking Alpha's data is not updated or miscalculated at 16.39%, according to Global X's Website the fund's TTM yield is 13.77%. This is still quite high and attractive for an income investor.
RYLD Yield on Cost (Seeking Alpha)
The yield on cost is also pretty high, at around 11% if you invested at inception. Though we see it has actually declined from about 15% looking backward from now till 2019. This marks a 4% loss of yield on cost from an initial investment.
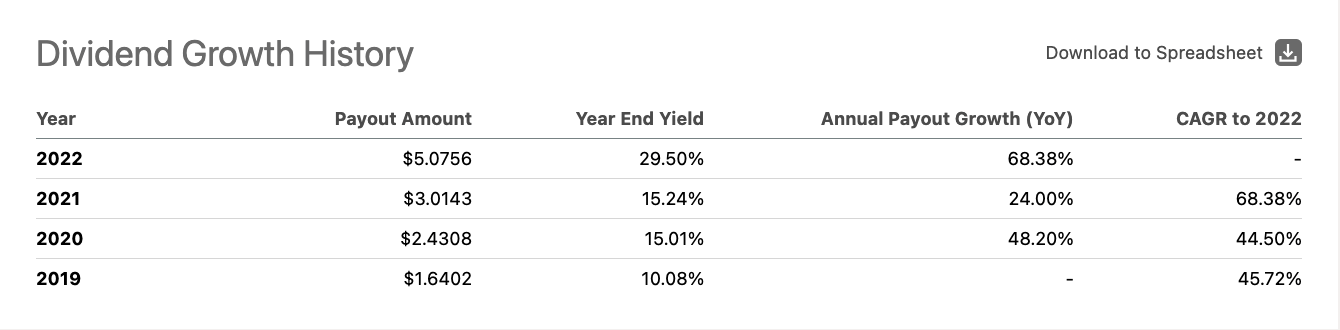
RYLD Dividend Growth (Seeking Alpha) RYLD Dividend Growth History (Seeking Alpha)
Last, RYLD has grown its payout every year, it's paying almost double what it was paying from 2020 to 2022. I took the average of the CAGR to 2022 and calculated about 52.5%.
For an income investor, they may be thinking this fund can seriously cash flow for them, but will that cash flow grow and be useful in the future? After all, even if you're spending the money or reinvesting a portion of your distribution if it's not outpacing inflation, you will not be able to sustain yourself or what that money is assigned to do in your budget.
Inflation and Total Returns
What's missing from these attractive dividend metrics is the total return compared to inflation. The USA has been and is continually feeling the effects of inflation in our consumer spending. It doesn't take a research paper for many of us to have an intuitive sense that things just feel tighter. Food at both grocery stores and restaurants is high, gas for my V8 truck (ok, partially my fault) has turned into an actual bill, and seemingly every service I pay for is increasing their prices. I personally am feeling the pressure, and it's really made me think critically about my entire personal finance system, especially investments. Inflation affects all investing strategies, however for dividend and income investing, which are heavily focused on cash flow, inflation bites pretty directly.
I'll use RYLD's inception year, 2019 through today, 2023. $1 dollar in 2019 is worth about $1.20 in 2023 according to a CPI calculator . That's an average inflation rate of 4.68%. Let's see how RYLD held up:
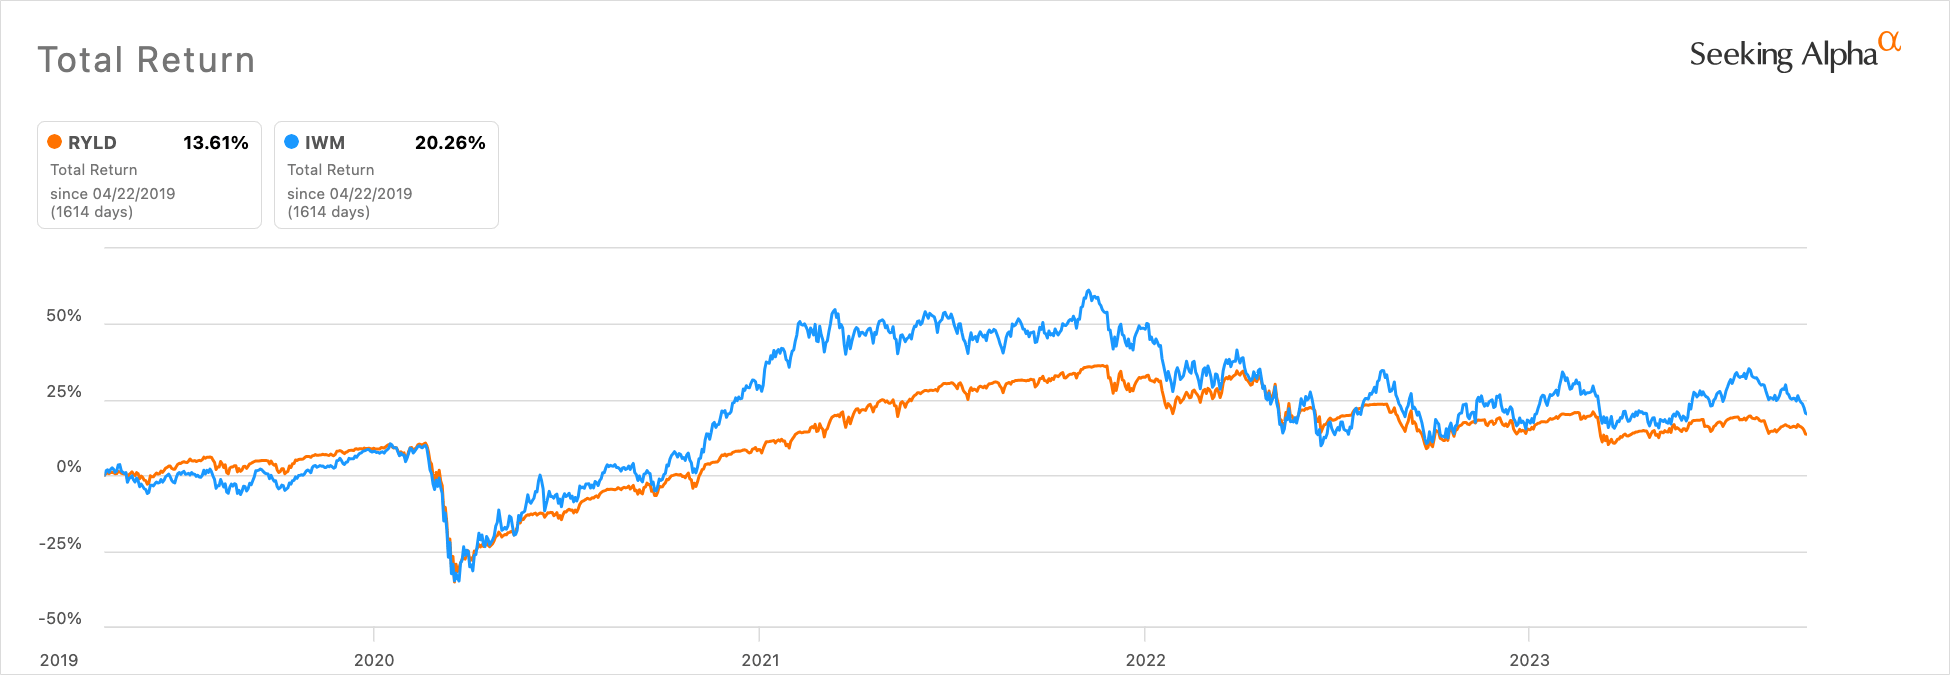
RYLD vs. IWM Total Return (Seeking Alpha)
We see since inception, RYLD has a total return of 13.61% while it's underlying it writes at-the-money call options has a total return of 20.26%. Right off the bat, you would have been better off holding all the small caps in IWM than writing calls against them. Let's see how both these funds compare to the U.S. dollar over the same time period:
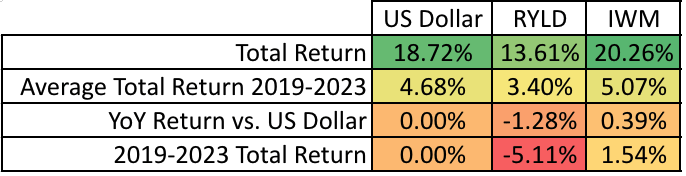
US Dollar vs. RYLD vs. IWM (Nicholas Bratto, Seeking Alpha, CPI Inflation Calculator)
The US Dollar had an average inflation rate of 4.68%, RYLD had an average total return of 3.40% and IWM 5.07%. RYLD lost a total of 5.11% or 1.28% average annual to inflation. IWM did beat inflation by 1.54% over 4 years, 0.39% per year, I guess it's better than cash, but treasuries, high yield savings, and money markets have been increasingly looking better and better. Although investing in RYLD was better than letting your cash sit under your mattress, you still aren't keeping up with inflation in the last four years since its inception. Total return is taking into account those dividends, if you're actually spending your dividends and not reinvesting, your dollars are losing purchasing power year over year. To date, this is not a sustainable investment for those living off the income.
Risk Analysis
It's easy to understand why RYLD has not kept up with inflation due to the distribution rules 1% of NAV or 50% of options premium. In an environment where the underlying are flat, increasing or decreasing very slowly for a period of time, we could see RYLD actually outperform its underlying. This is because the NAV will increase and with that, the distributions from selling options. We would need to see RYLD return into the $20 range and long term, preferably approach the $30 range, to keep up with inflation.
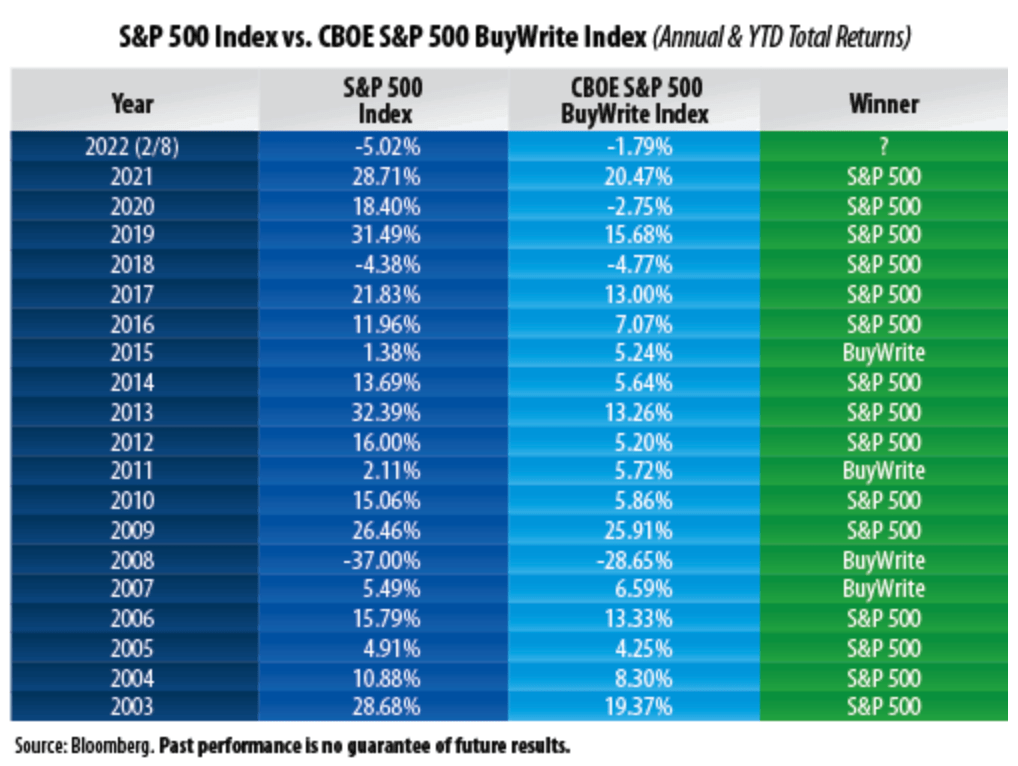
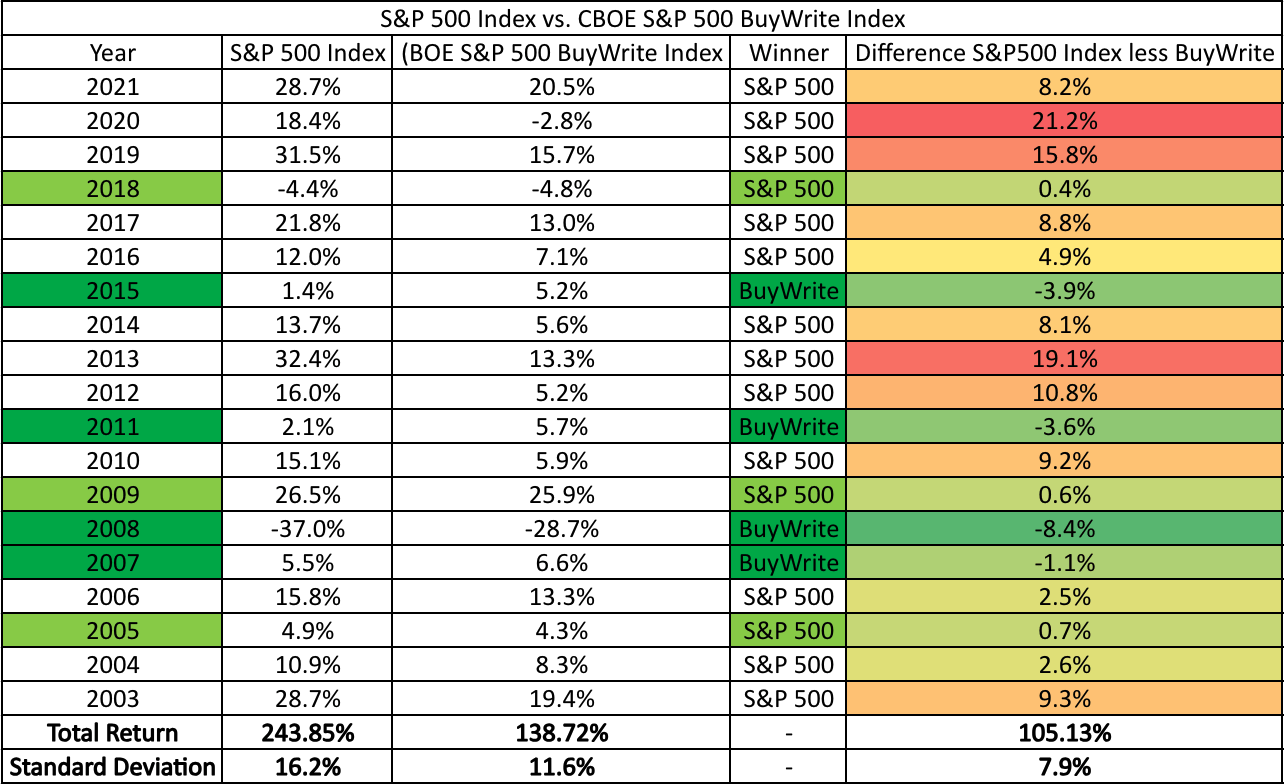
Looking at data for the S&P equivalent , there were some years: 2007, 2008, 2011, and 2015, where the BuyWrite outperformed the index.
S&P500 vs. CBOE S&P500 BuyWrite Indices (Bloomberg)
I couldn't find data for the BXR, the CBOE Russell 2000 BuyWrite Index, however using data for the S&P500 equivalent and accounting that IWM's beta is 1.05 , I calculated the standard deviation to determine the approximate uncertainty for this type of strategy. It's probably an appropriate time to mention the third cousin, The Global X S&P 500 Covered Call ETF ( XYLD ).
S&P 500 Variation of Returns for BuyWrite Strategy (Bloomberg, Nicholas Bratto)
While the total return is markedly lower, the variation of the return for a BuyWrite Strategy is less, so it is more consistent. Additionally, there were years when the BuyWrite did outperform the underlying index, sometimes consecutively like in 2007 & 2008, 2011, and 2015 with honorable mentions in 2005, 2009, and 2018 for their negligible difference. For an income investor, they likely would have preferred the cash flow in those years over an extra half percent sitting in the market. On the other hand, the difference in this uncertainty is about 7.9% for the data, meaning between the two strategies, there is about +/- 8% in return differences year to year on average, which is significant, that's an entire standard market return you're practically doing a coin flip for. While most years the index outperformed, there are enough years, about 20%, where it did not and about 33% where a BuyWrite was practically the same return. Therefore, it may warrant to have some exposure to this strategy, for those living off the income.
Final Thoughts
In conclusion, while Global X Russell 2000 Covered Call ETF offers a high dividend yield and consistent income generation, so far it has not been a sustainable investment option for those who rely on income to cover living expenses. Its failure to outpace inflation in recent years and the limitations of the covered call strategy make it a less attractive choice for long-term income investors. Investors should carefully consider their personal cash flow, goals, and risk tolerance when evaluating RYLD or similar covered call ETFs. At this point, I'm personally going to wait for my ROC distribution at the end of the year and willing to sell when my total loss is a few hundred dollars.
For further details see:
RYLD: Inflation First, Dividends Second