RYLD - RYLD: Low NAV Erosion And Occasional Tax Benefits
2023-08-13 12:08:09 ET
Summary
- The Global X Russell 2000 Covered Call ETF (RYLD) seeks to generate income by selling at-the-money covered calls on tickers in the Russel 2000.
- Their variable distributions are currently paying a trailing yield of 11.36%; portions of which can be paid out as Return Of Capital.
- The fund mitigates some of its long-term NAV erosion by retaining a portion of the premium collected.
- RYLD's volatility can be hedged by entering a short position in URTY.
- I currently rate RYLD a Buy.
Thesis
I have been researching a variety of high yield ETFs for eventual use in a high margin portfolio. The desire to search for many viable choices has me researching several types of ETFs. Global X offers several covered call ETFs which all function using the same mechanics. I have decided to take a look at their Russell 2000 Covered Call ETF ( RYLD ) first. After looking over how it generates yield and its distribution policy, I find the fund attractive. I currently rate RYLD a Buy.
Fund Background
The Global X Russell 2000 Covered Call ETF ( RYLD ) is an exchange traded fund which seeks to generate income through what is frequently referred to as either a covered call or a buy-write strategy. Their prospectus reveals that the fund holds at least 80% of its total assets in securities within the index or in investments that have economic characteristics that are substantially identical to the economic characteristics of such component securities. Each month, they sell a fresh set of at-the-money covered calls with an expiration a month out. They have a history of paying out a portion of their distributions as Return of Capital. The fund carries a gross expense ratio of 0.66% and a net expense ratio of 0.60%.
Holdings
Their holdings are updated frequently. As of August 8th, 2023, 32.34% of the fund was gaining exposure through the Vanguard Russel 2000 ETF and the rest is held in individual companies.
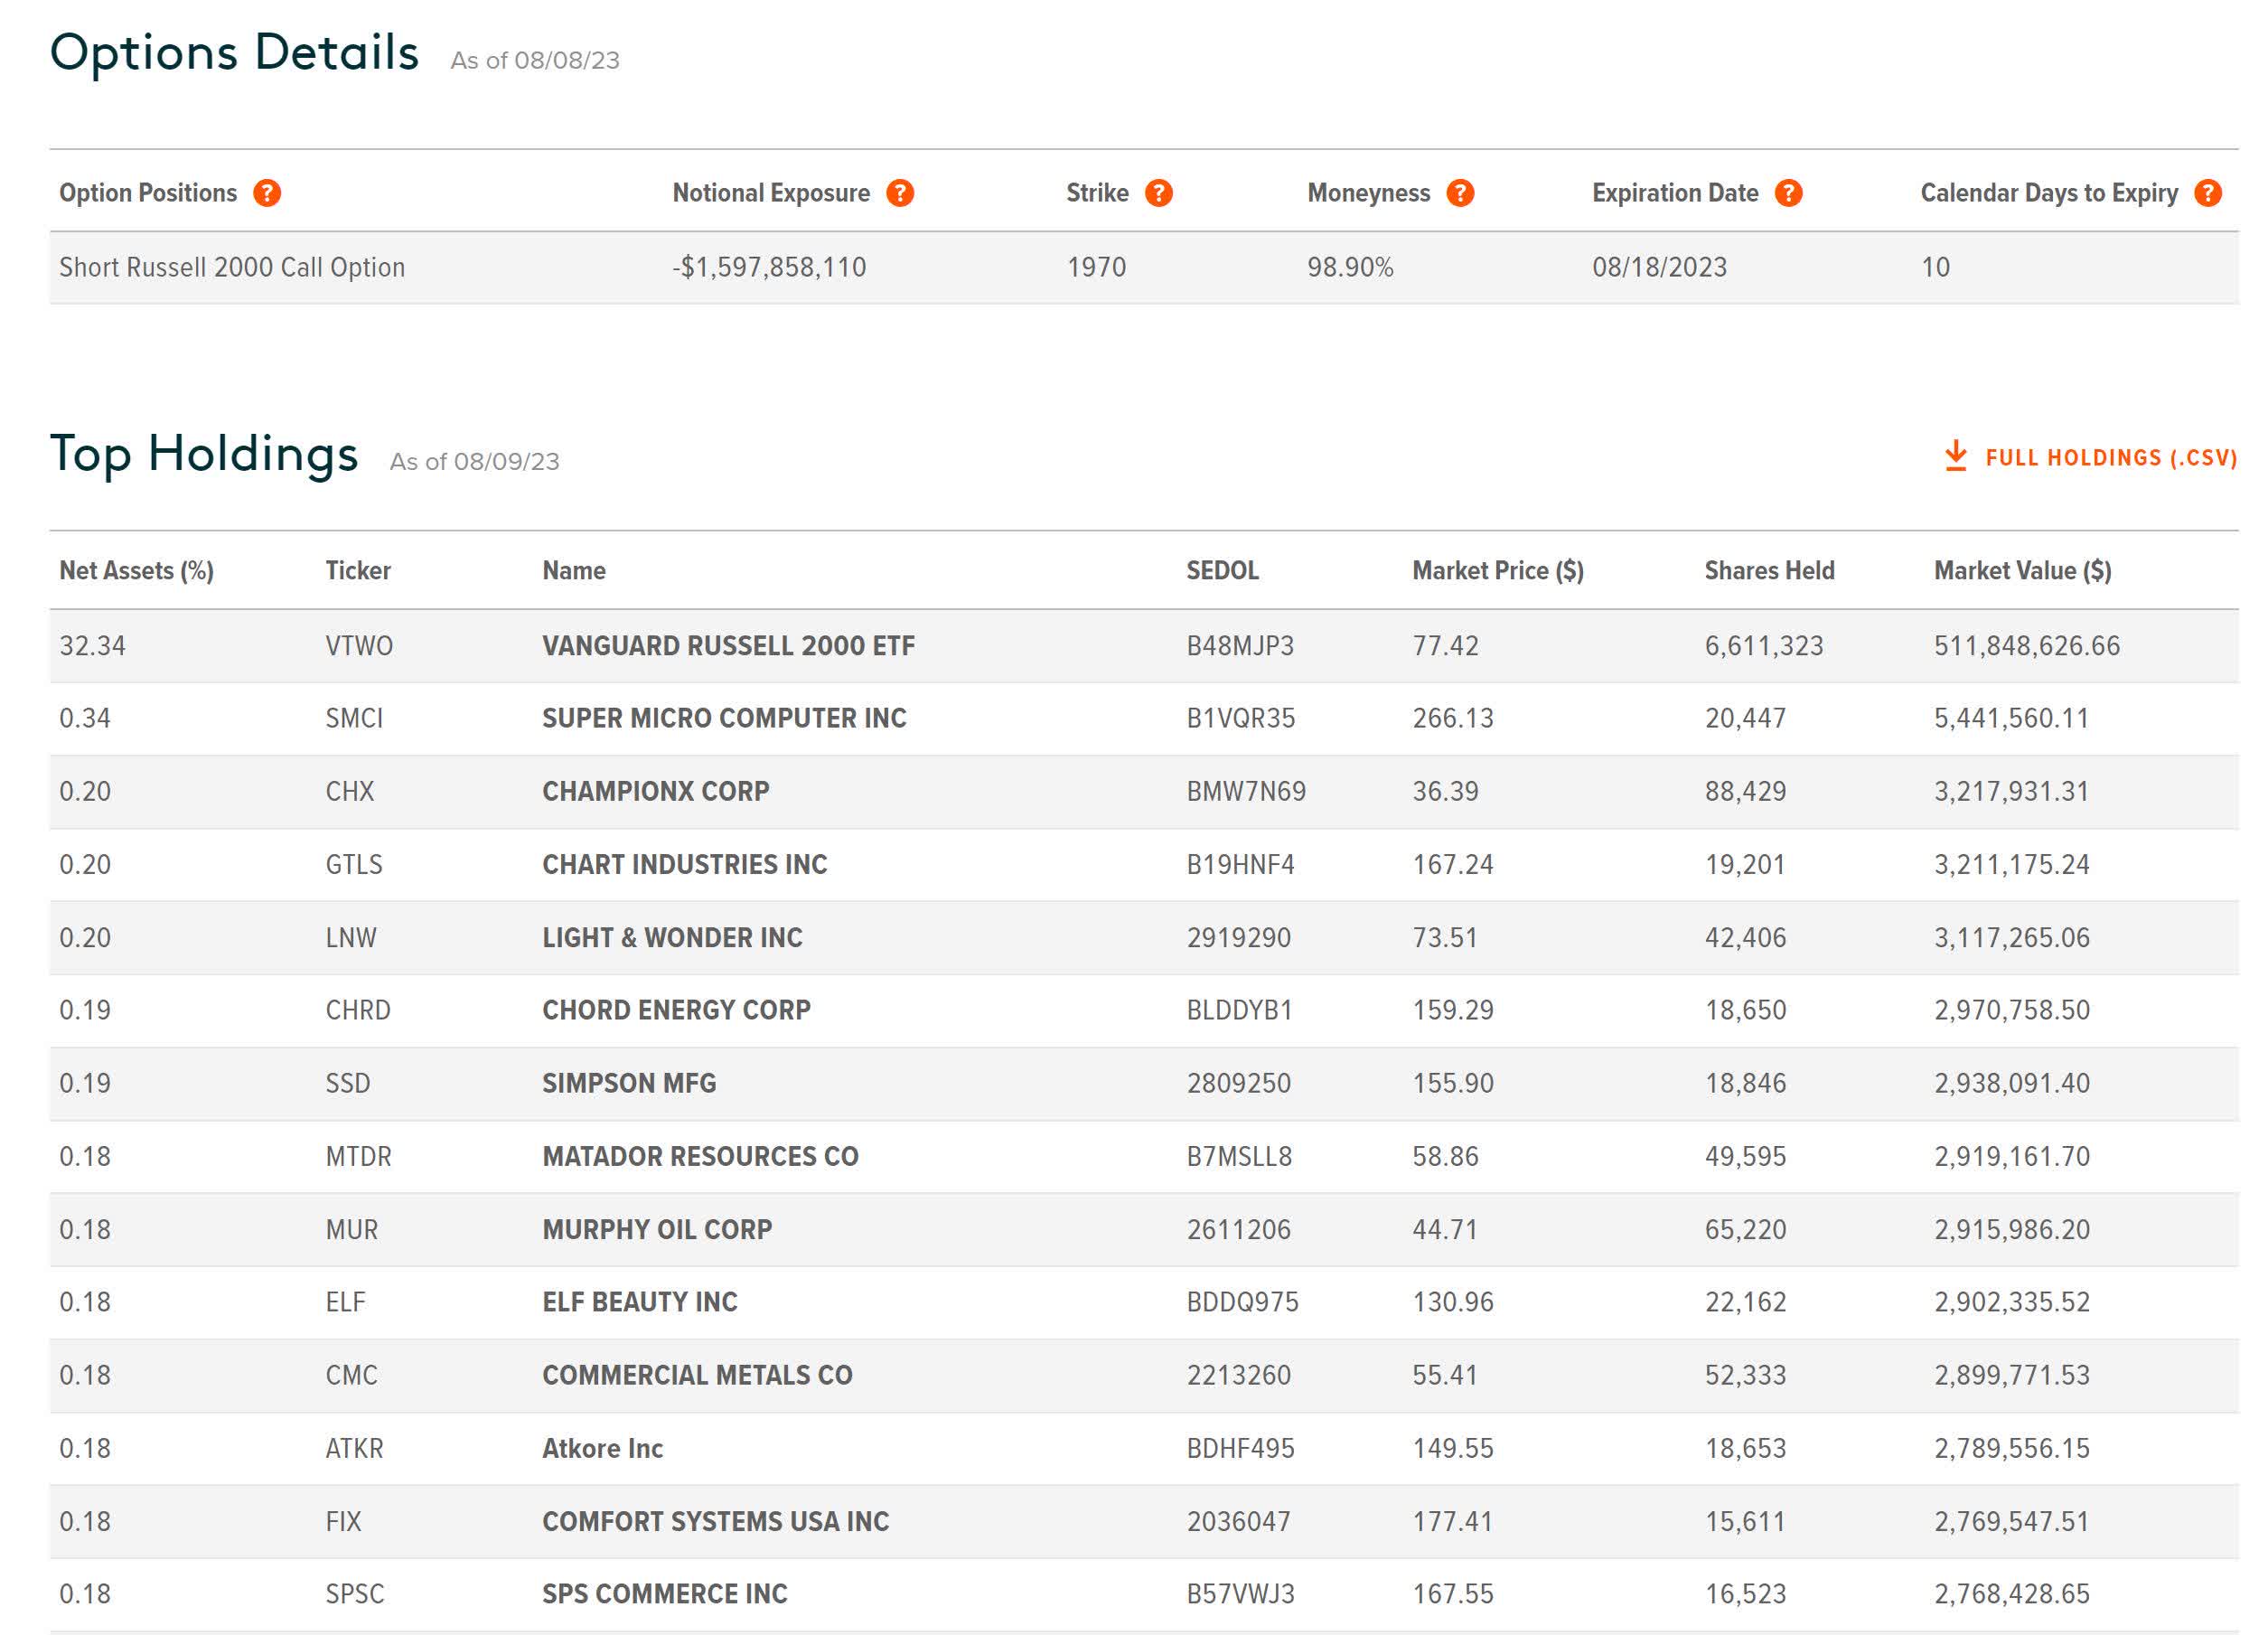
RYLD Holdings (Globalxetfs.com)
Distribution History
RYLD first began trading in April of 2019 and pays a variable distribution. Their trailing yield is currently at 11.36%.
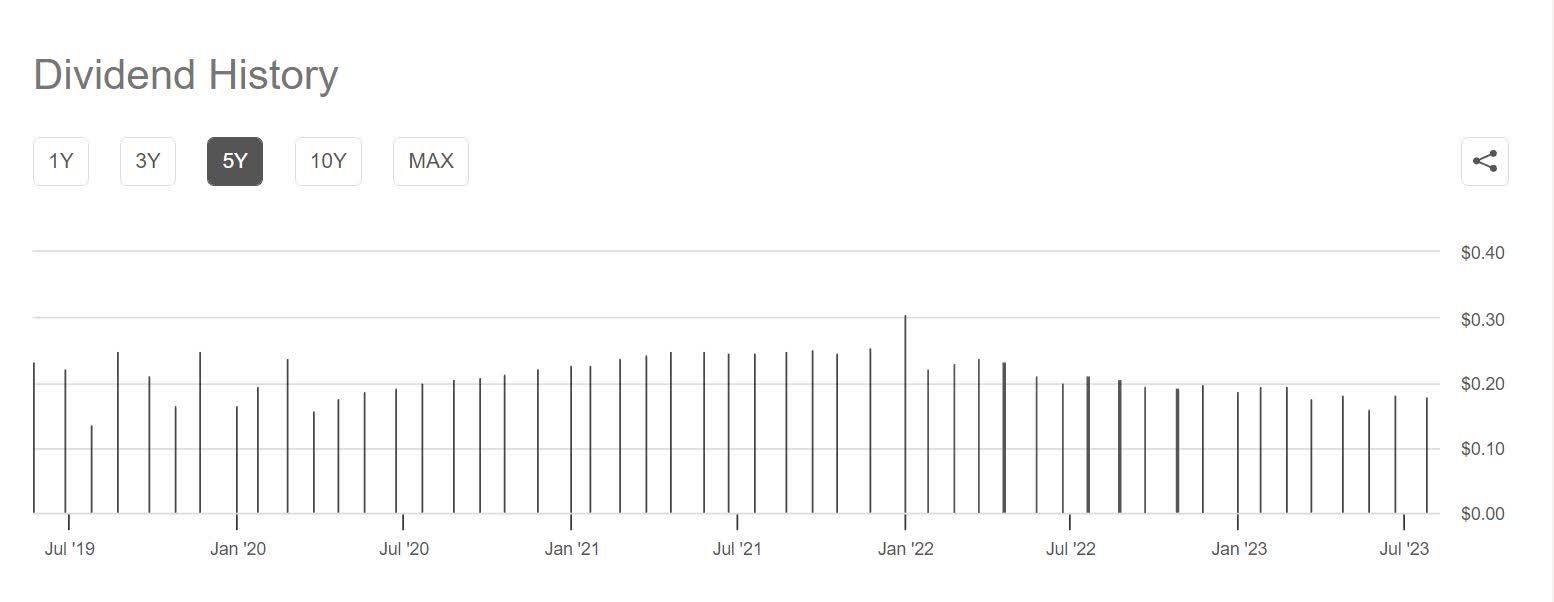
RYLD Distribution History (Seeking Alpha)
NAV Erosion
Covered call strategies are notorious for suffering from an erosion of their Net Asset Value over longer time frames. By watching interviews with the fund manager, I was able to find out that Global X mitigates this somewhat by handing out distributions that are sized so the fund can retain a portion of the premium collected. They either pay out half the value of the premium collected, or 1% of NAV, whichever is lower . This is comparable to a shareholder choosing to only reinvest a portion of their dividends.
I am also including iShares Russell 2000 ETF ( IWM ) here for anyone who is unfamiliar with Vanguard Russell 2000 Index Fund ETF Shares ( VTWO ); they both seek to gain broad exposure to the same index, so it's not surprising that the two ETFs have extremely similar performance. Over the last 3 years, they have only fallen out of correlation by 0.27%. When comparing RYLD to VTWO on a price return basis for the last 3 years, RYLD appears to be lagging its underlying by 8.02%.
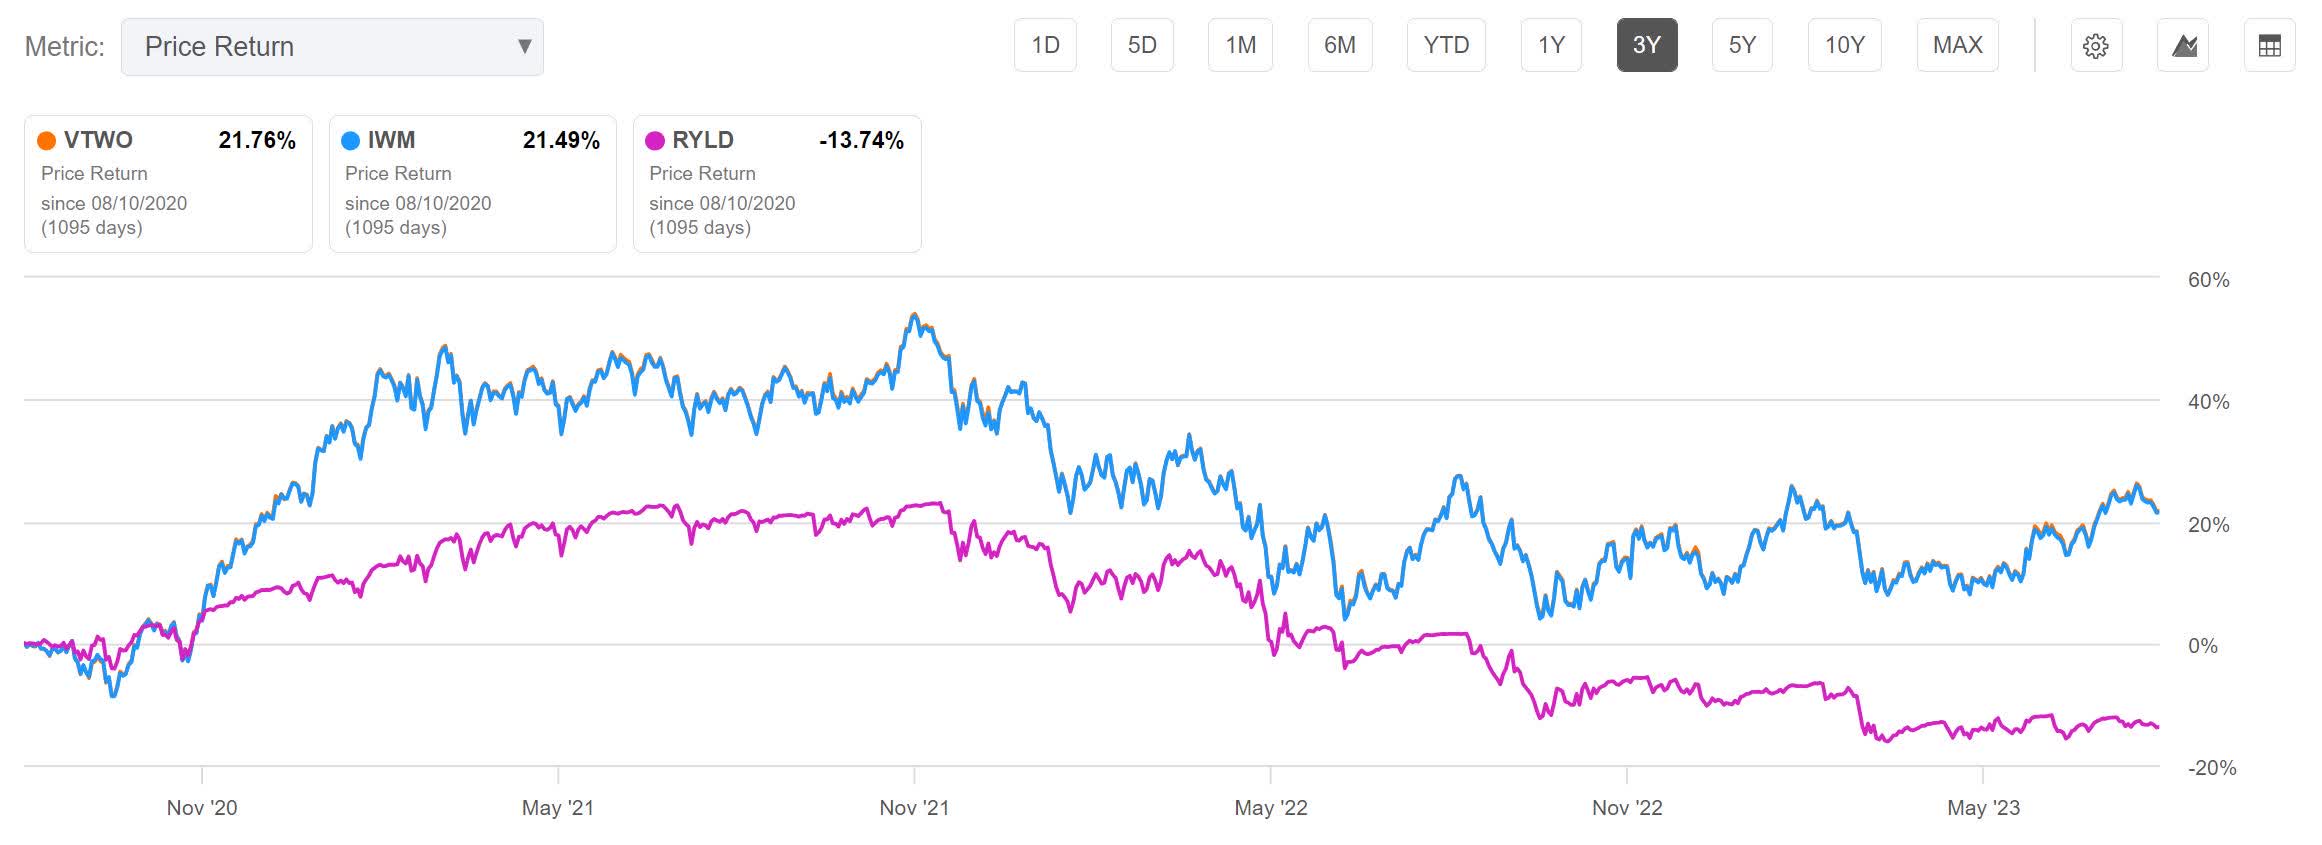
RYLD vs. VTWO vs. IWM 3-Year Price Return (Seeking Alpha)
However, when comparing the two on a total return basis, over the last three years RYLD is only lagging behind VTWO by 2.59%
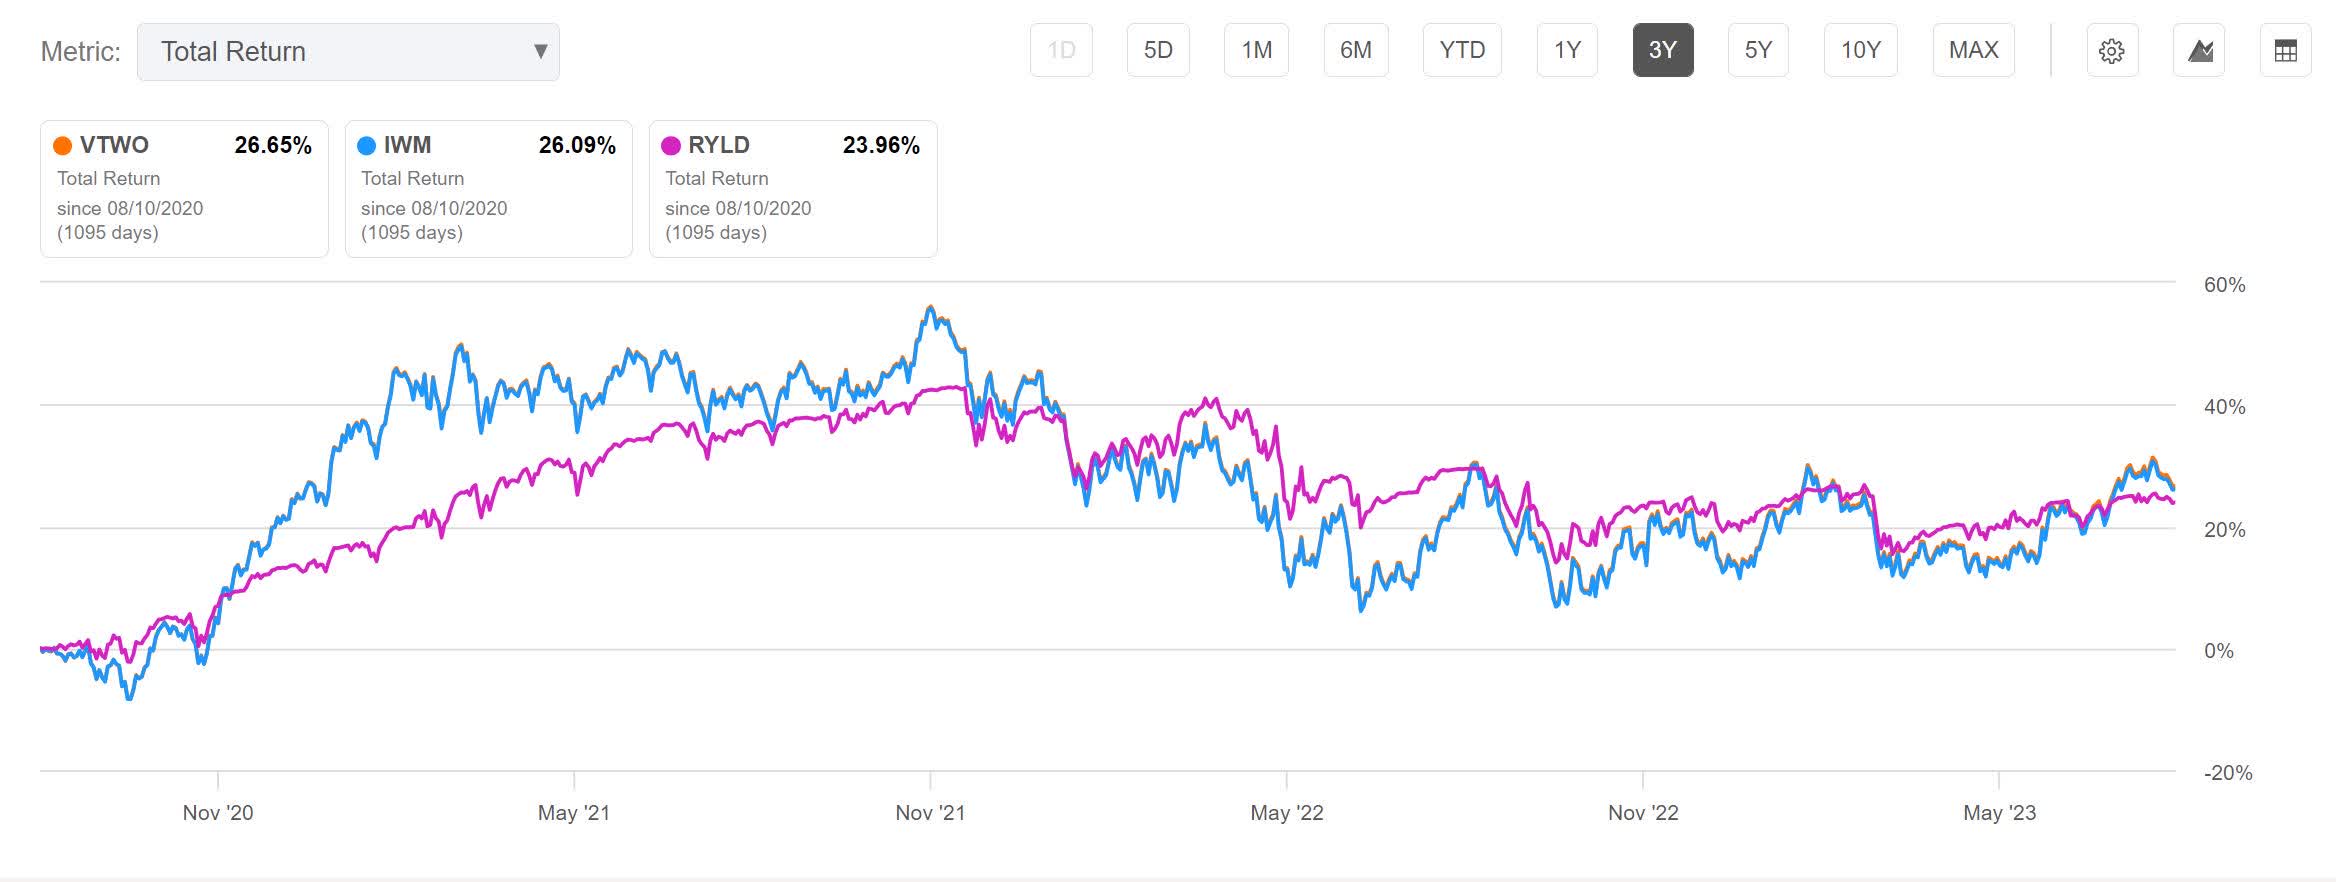
RYLD vs. VTWO vs. IWM 3-Year Total Return (Seeking Alpha)
The difference between price return and total return over 3 years was only 5.43%, yet they typically pay an annual yield in the 9 to 13% range. This would imply that price return should be lagging total return by something closer to 30%.
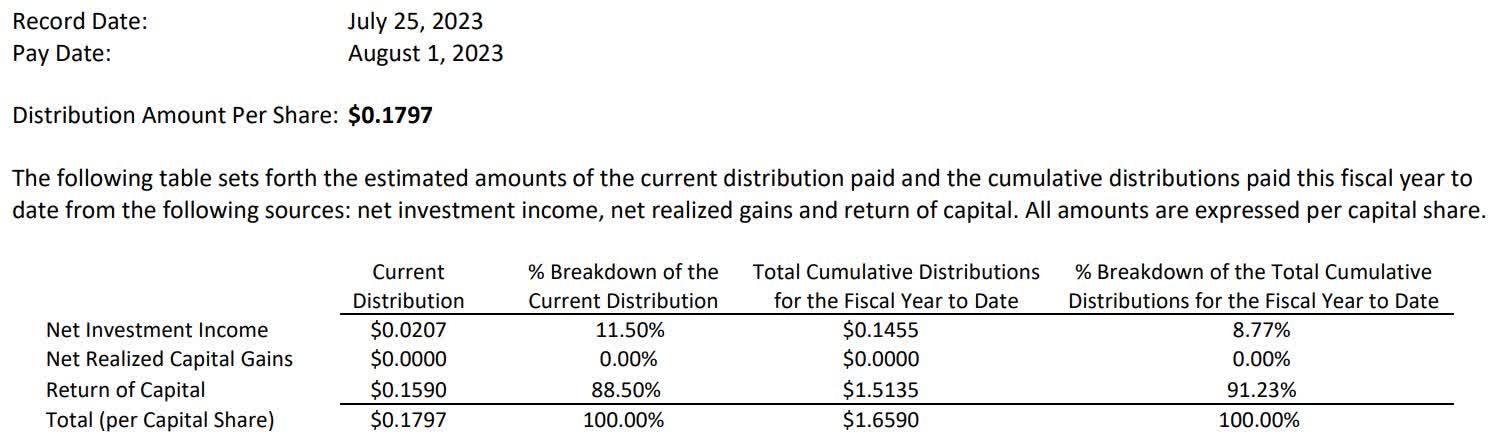
I believe the difference in amounts is because the Return Of Capital portions of the distributions aren't included in total return values. This appears to line up with what is stated in their monthly tax supplements . For just the month of July 88.5% of the distribution was Return Of Capital. Year-to-date, 91.23% of their distributions have been ROC.
RYLD Tax Supplement, July 2023 (Globalxetfs.com)
Mitigation Through Options
Before I cover ways to mitigate the erosion through options, I need to issue a warning about their dangers. While it is true that options can be used to lower risk, their behavior is nonlinear and those who are new to them frequently find themselves taking losses from factors they don't yet understand.
Because they cap maximum gains, covered call ETFs underperform their underlying during violent rallies. Because they are collecting premium, they tend to overperform in neutral and bearish markets. Typically, the rate they fall out of correlation with their underlying is directly related to the frequency of violent rallies. Global X has set up RYLD to pay out only a portion of the premium collected as distributions, this is removing most of their long-term NAV decay.
Because they limit their upside during violent rallies, covered call ETFs have a maximum limit they can grow by over shorter timeframes. This means one can sell covered calls on their RYLD position with a slightly lower chance of being exercised than on most other tickers.
If one is worried about the potential for sudden catastrophic drops in the value of the underlying, RYLD puts can be purchased with strikes at or above the current share price. This removes the positions delta exposure. The puts can be paid for by selling calls at even higher strikes, turning the position into a collar. Typically, the call sold does not cover very much of the cost of the put and the difference must be paid for by taking it out of the monthly distribution.
Instead of trying to hedge all the delta exposure by purchasing a put with a strike above the share price, one can purchase multiple puts at a lower strike for far less premium. If the underlying takes a significant downturn, the delta of the options will grow significantly as they approach their strike price. While small moves aren't likely to overcome theta, larger moves are. This method has the disadvantage of having a nonlinear relationship (because of gamma) with RYLD, but it's possible to effectively achieve a similar level of protection for less total premium. If the drop is severe enough, it can easily become an over-hedge and pay out far more in gains than RYLD loses.
While the fund operates on monthly timeframes, your options hedge doesn't have to. Instead of trying to mitigate violent short-term moves, one can purchase puts with significantly more time on them. I should note that with RYLD having an average annual decay rate of only 2.67%, the theta decay on the put is unlikely to be overcome by it. This will likely only pay out in the event of a significant downturn of the Russell 2000.
Instead of purchasing RYLD puts, one can purchase puts in VTWO, IWM, or anything else that is highly correlated to the Russell 2000. In fact, VTWO and IWM both have far more liquid options markets than RYLD, so one may get better fills. Though this will help against downturns, purchasing options on the underlying or similar ETFs will only help against RYLD's long-term NAV erosion if profits are reinvested back into RYLD every time they are rolled for a gain.
Hedging Volatility
Anyone wanting to mitigate volatility can look into producing a low volatility couple by entering an inversely correlated position on another asset. Before I talk about leveraged ETF's, I need to issue a warning. Although their daily performance is quite predictable, enough retail investors have misunderstood their long-term behavior that the FINRA and the SEC have both issued warnings about them. Leveraged ETFs also suffer from long-term NAV erosion, but for very different reasons. By matching daily performance, they sacrifice the ability to stay correlated over longer timeframes. If they go down by 10% one day, they will have to go up by 11% from that point to reach their prior value. After a 50% drop, they would have to double. The underlying they correlate to has no such erosion and so the two assets will slowly fall out of synch.
To ensure this long-term decay works in our favor instead of against us, we will only look at shorting positions. Depending on if the long-term NAV decay is larger or smaller than the borrow fees, merely holding the hedge may or may not net its own profit over time.
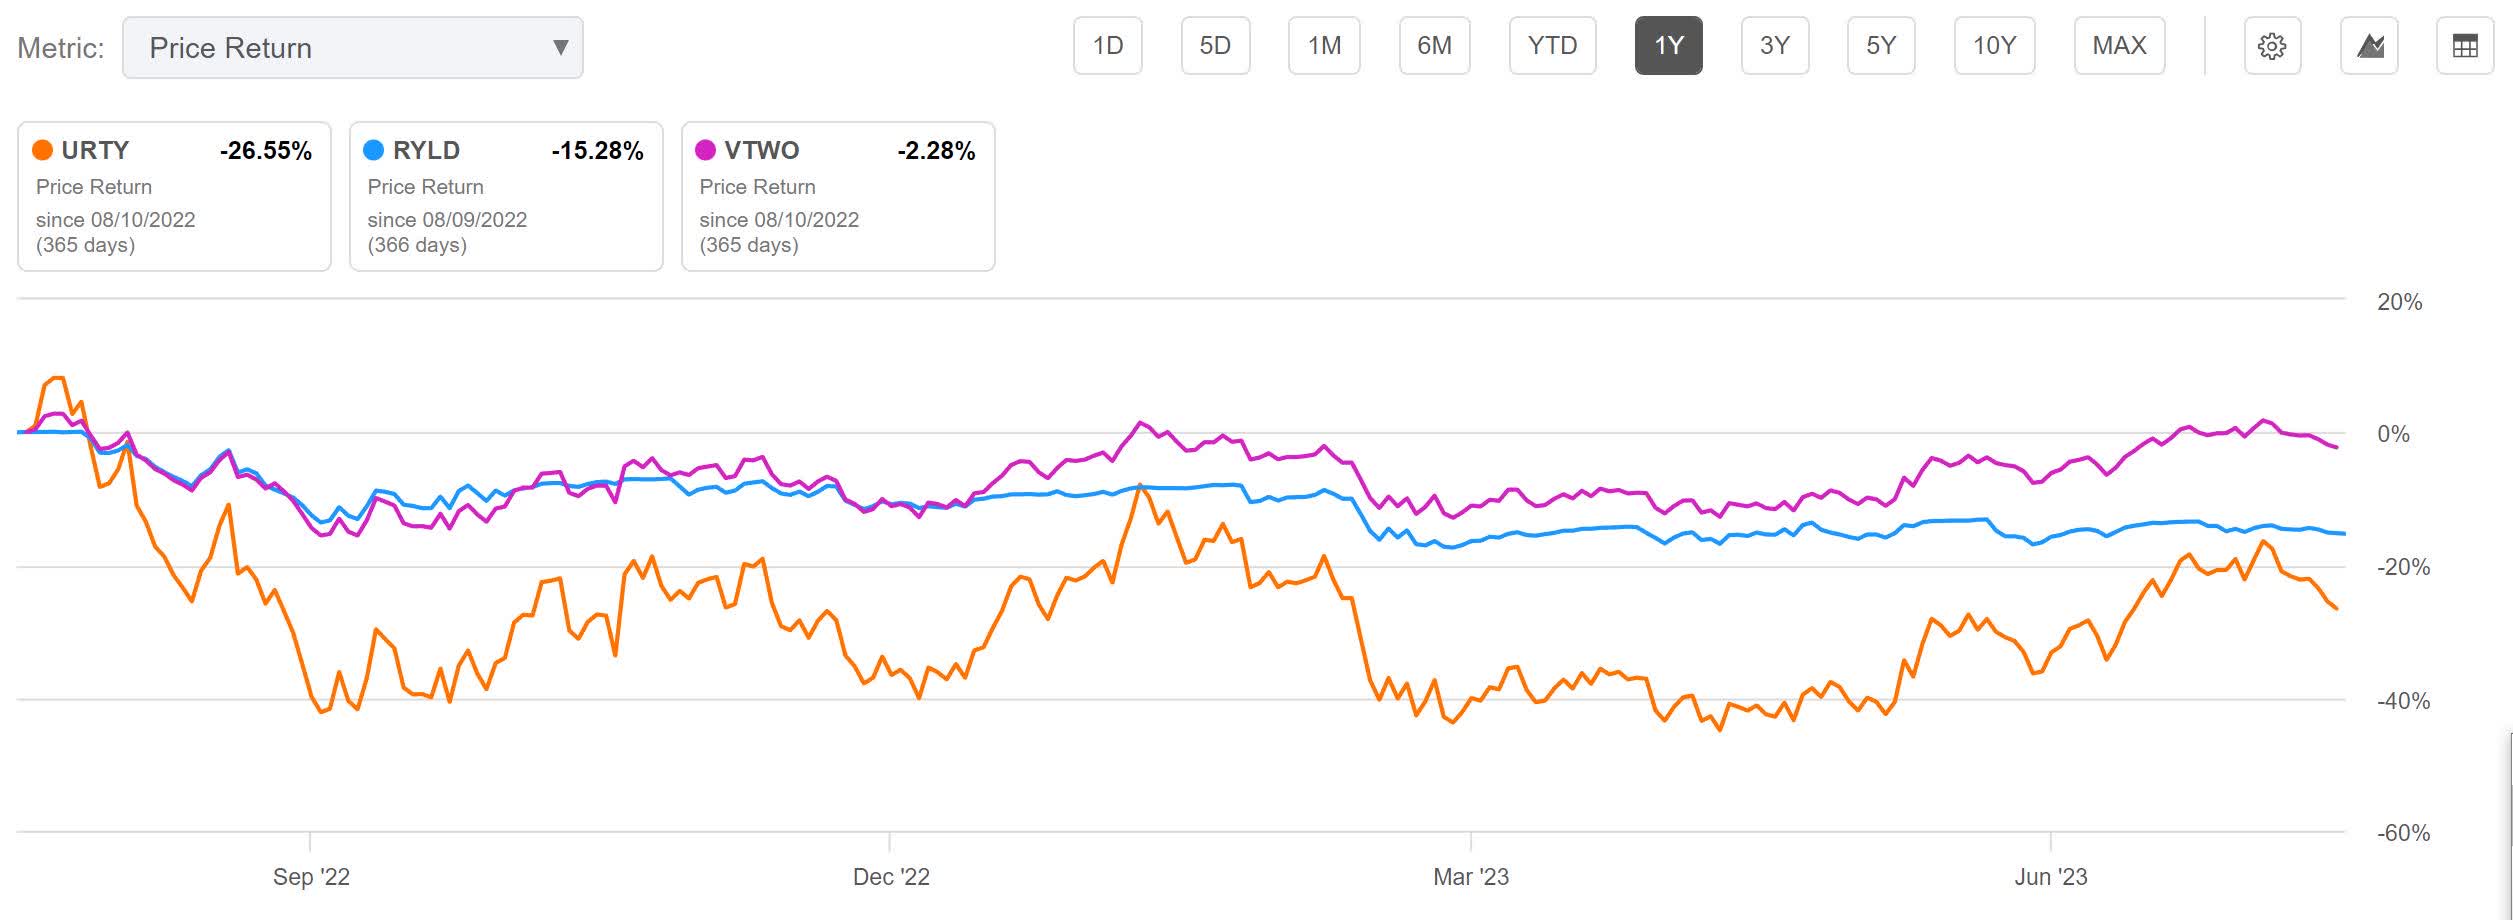
Because it is triple leveraged and correlated to the Russell 2000, I am looking at shorting ProShares UltraPro Russell 2000 ETF ( URTY ) for the hedge. Over the last year, VTWO is down 2.28%, RYLD is down 15.28%, and URTY is down 26.55%. Over the last year, URTY's degradation has it falling out of sync with VTWO by 24.27%. I should note this is price return not total return, so RYLD's yield is left out of it.
RYLD vs. URTY vs. VTWO Price Return (Seeking Alpha)
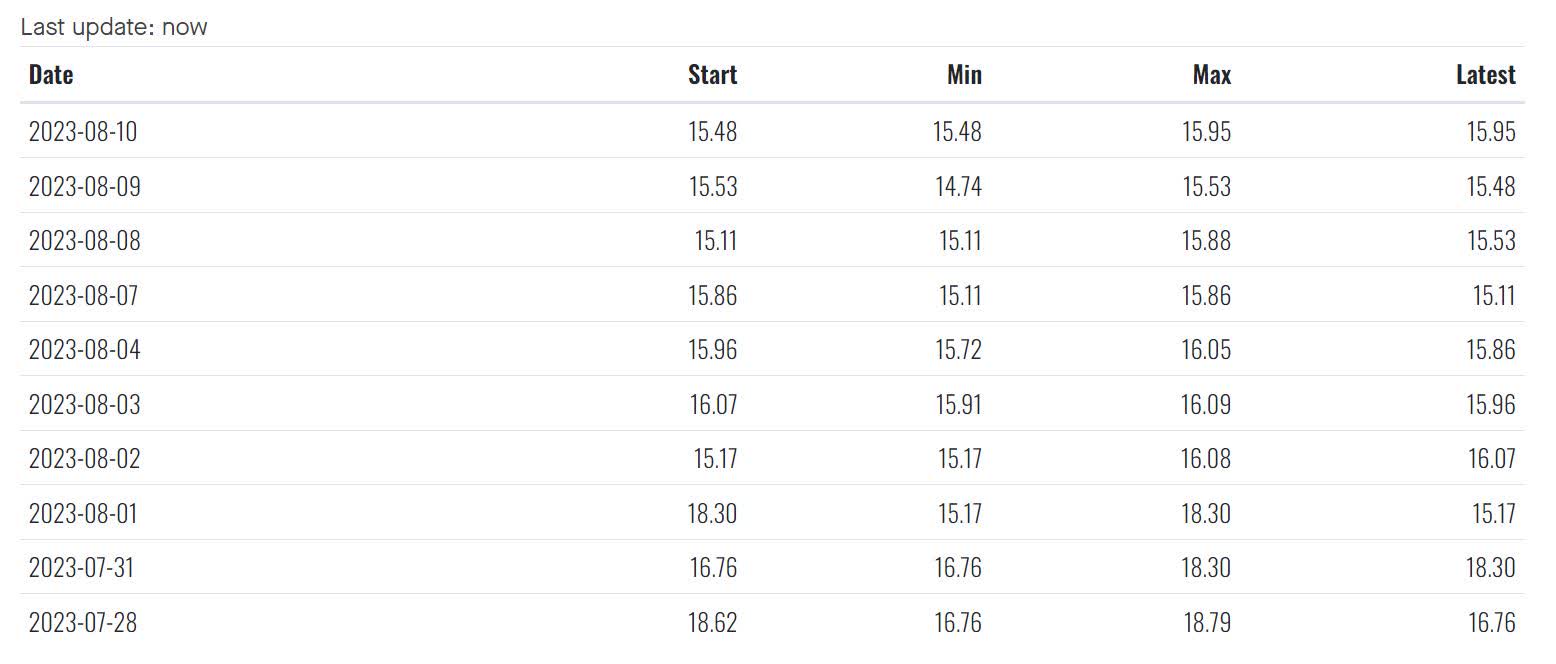
Also, URTY's borrow fees have be taken into account. Fintel is currently listing their recent annual borrow rates in the 15-17% range. When this roughly 16% fee is subtracted from the gain from its annual decay rate of 24.27%, the hedge should net roughly 8% a year. Note, past performance is not always a solid indicator of future results.
URTY Short Borrow Fee Rates (Fintel.io)
The Couple
Leveraged ETFs are particularly attractive when paired with covered call ETFs because their beta is significantly higher. This means that instead of having to take on two equally weighted positions to form a low variance couple, the non-dividend paying side of the couple can be much smaller.
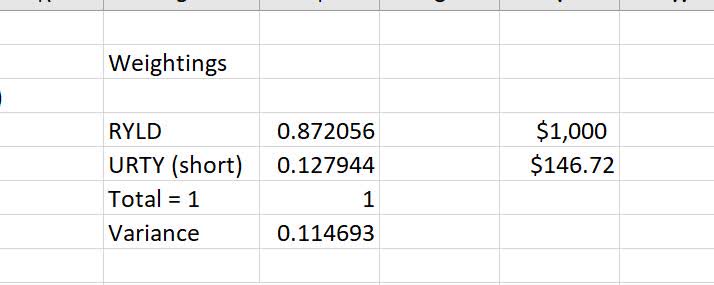
The minimum variance calculator I built in excel is telling me that if RYLD is weighted at 87.21%, and the short URTY position is weighted at 12.79%, the variance is 0.1147. To achieve this, one would need to short URTY for $146.72 for every $1000 they have in RYLD.
RYLD vs. Short URTY Minimum Variance Weightings (By Author)
The weighting will need to be rebalanced regularly, so anyone wanting to try this on their own should build their own minimum variance calculator. There are long-term benefits to regularly rebalancing; each time you do it, you will be selling a portion of the overvalued position and buying more of the undervalued one.
The hedge needs its own hedge. Setting up a hedge like this produces a situation where under most conditions the couple shouldn't lose value. However, if the underlying were to experience an especially violent rally, the short position has the potential to lose more than the long position would gain. This means that the short URTY position should be paired with its own hedge. I would look at purchasing fairly cheap out of the money calls on VTWO or even IWM. I should note that the point of this is to hedge against a catastrophic loss of the short position which is only weighted at 12.79% of the couple, so this hedge-for-the-hedge only needs to be capable of handling a few dozen dollar move in the URTY position for every $1000 held in RYLD. It does not need to be large.
The performance of the paired couple can be roughly estimated. RYLD is currently handing out a 11.36% yield yet has decayed by 8.02% over the last three years. This comes out to an average decay rate of 2.67% per year. When compared to its underlying, RYLD has been netting roughly 8.69% per year. When comparing the borrow fees to the URTY's NAV erosion the short URTY position appears to net roughly 8% annually. With the 8.69% yield from RYLD weighted at 87.2%, and the short position weighted at 12.8% and netting roughly 8%, my rough estimate for the yield of the couple is 8.538%. Since all the numbers that went into it were estimates, I'm going to round this down to a rough annual yield estimate of 8.5%.
This 8.5% doesn't include any income one might make from selling covered calls on RYLD or puts on URTY. If you do decide to sell options against the position, it also comes with the burden of having to immediately rebalance the couple after either side is exercised.
Risks
RYLD is exposed to downside risk from the potential of the Russell 2000 experiencing a significant downturn.
Although taking on appropriate options and inverse positions should lower risk, never underestimate human error's ability to step in and mess up your plans. It is possible to get poor fills on the options, or chose poor strikes and expirations, or misunderstand their nonlinear behavior. It is also possible to miscalculate the weighting for the inverse asset, or for the borrow fees to spike, or for the couple to fall out of correlation more quickly than expected. If the hedge is not hedged, it can lose money. With all new strategies, it is advisable for the inexperienced to get comfortable through paper trading them before trying them out on a small scale with real money.
Regardless of human skill levels, planning on hedging the position through options comes with additional risk from potential losses through poor fills and slippage. This also means a small portion of each distribution must be sacrificed to buy new options as old ones expire.
It is possible the borrow rates on the hedge rise above its decay rate and it becomes a net loser. This risk can become a real problem if it happens when you aren't paying attention, so it's advisable to check on conditions regularly.
Catalysts
Because the fund sells covered calls at-the-money, this strategy should outperform merely holding its underlying under some conditions. Anytime VTWO is trading inside a range or is bearish, the covered call strategy should outperform it because of the premium collected. If the Russell 2000 stays in a range for a protracted time, RYLD should outperform it.
Rebalancing the couple has the potential to net additional income. Each time the couple is rebalanced, a portion of the overvalued position is sold while the undervalued position is added to. Regular rebalancing removes the stress of trying to time tops and bottoms. Experienced traders may prefer to instead rebalance back to neutral at every perceived extreme; this has the potential to significantly increase gains.
Taxes
I have come across many who take one look at the Return Of Capital and tell themselves that it means the fund is merely handing the investors back their own money, yet calling it yield. And while this is one way to look at it, the actual situation is more nuanced.
I am not a tax specialist, so I feel obligated to explain that this is merely my best understanding of how Return Of Capital works for tax purposes. Similar to what humidity does on a hot day, or strong wind on a cold day, in bearish markets RYLD sometimes hands out a lower real-feel yield when portions of it show up as a reduction of cost basis. If you manage to hold RYLD for long enough, it is possible for the cost basis to reach zero and after that point the ROC portions of the distributions will all be taxed as long-term capital gains.
When you go to sell the position, you will be taxed on the difference between your cost basis and the share price. If the shares have been held for long enough, this will also be at the long-term capital gains rate.
With all the talk about ROC, I believe it's a good time to point out that the non-ROC portion of the distributions are considered short-term income. This means that in bullish markets most or all of each distribution is likely to be taxed as short-term capital gains.
Conclusions
RYLD pays a variable yield which typically lands in the 9 to 13% range; unlike many other covered call ETFs, its distribution policy is set up so that most of its long-term decay is mitigated. Under some conditions, portions of its yield are tax advantaged.
When looking at the possibility of coupling the position with a short position in URTY, the investment becomes more attractive. URTY appears to degrade at a rate that is faster than the losses one takes from its borrow fees. I believe the benefits one gets from owning a cheap hedge and rebalancing it make the hassle worth it. I also have to remind readers that anyone wanting to try this will need to build their own minimum variance calculator. There are several examples on Youtube showing how it can be done through Excel.
I have been researching potential targets for use in a high-margin portfolio and am glad I decided to take a harder look at RYLD. While I don't consider the 8.5% yield the couple produces overly attractive, I believe this low variance pairing is viable. I will re-examine it when the time comes for me to leave the research phase and test out the portfolio on a small scale.
For further details see:
RYLD: Low NAV Erosion And Occasional Tax Benefits