REVS - SCHD Performance In Focus: Quartile Rankings Vs. 78 Large Cap Dividend Peers
2023-04-24 05:32:12 ET
Summary
- This article provides an overview of the SCHD's historical performance vs. a peer group of 78, including popular ETFs like VTV, VYM, VIG, DGRO, and SDY.
- A solid long-term track record suggests SCHD's strategy has merit. Although it's not the most consistent performer, it's performed above-average in 8/10 years between 2013-2022.
- The percentile and quartile rankings provided are more relevant to dividend investors than what sites like Morningstar feature. Comparators were specifically selected because they are dividend-focused.
- I'll also compare SCHD's current fundamentals against the five ETFs listed above. Poor YTD returns are not surprising, but SCHD also isn't an ETF you should frequently trade.
- SCHD remains a hold based on relatively weak fundamentals. VIG remains the better choice for those willing to sacrifice yield, at least in the short-term.
Article Purpose
This article aims to clarify whether the Schwab U.S. Dividend Equity ETF ( SCHD ) is a one-trick pony whose 5Y and 10Y lookbacks are favorable only because of a few good years of outperformance or if it's a consistently-strong performer. To answer this question, I developed a comparator group of 78 dividend-focused ETFs and calculated "Morningstar-style" percentile and quartile rankings for each year from 2013-2022. I determined that although SCHD was not the most consistent performer, it performed above average in 8/10 years, which is why it delivered a 261% total return.
This article also provides crucial information to dividend investors interested in trading for the short term or holding for the long run. I determined that SCHD is not an ETF worth trading frequently, as more often than not, it outperforms. However, that's different for the ETFs like the Vanguard Dividend Appreciation ETF ( VIG ), which can deliver first- or fourth-quartile returns depending on the market environment. Understanding what type of investor you are will determine whether SCHD is right for you. If you seek to buy and forget, SCHD is a buy. However, if you're looking for a less consistent but high-potential short-term alternative, I hope the fundamentals provided in this article will guide you in the right direction.
Creating An Appropriate Comparator Group
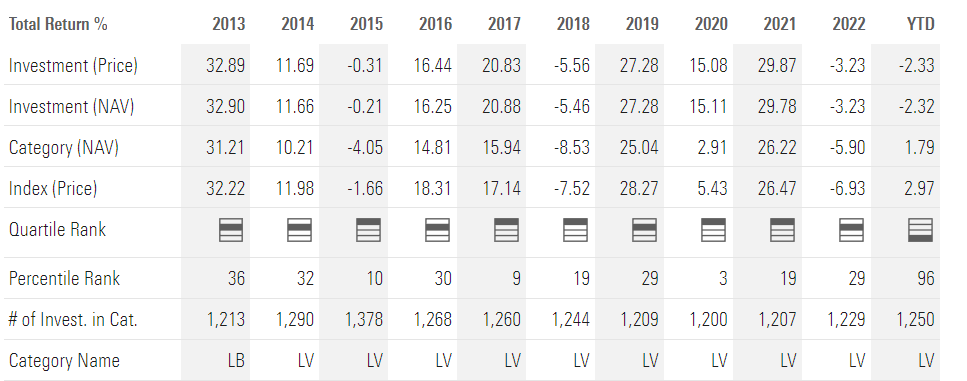
You may be familiar with percentile and quartile rankings. Morningstar ranks each ETF's annual returns against other peers each year, and as shown below, SCHD looks quite strong except for YTD in 2023.
Morningstar
However, Morningstar categories are too broad. There are over 1,200 funds in the Large Value category. The investment objectives of a dividend investor who might own SCHD differ from a value investor who isn't concerned with dividends, either now or in the future. We need to narrow the field.
I can't provide a comparator group that satisfies everyone. However, if we think about what dividend investors want, it's usually some combination of an above-average yield and relatively high dividend growth. I scanned through my ETF Database and identified 79 funds that were either dividend-focused or yielded 1.5x or greater than the S&P 500 Index. The complete list is below, ordered by AUM size from largest to smallest (apologies for the length).
- Vanguard Value ETF ( VTV)
- Vanguard Dividend Appreciation ETF ( VIG )
- Vanguard High Dividend Yield ETF ( VYM )
- Schwab U.S. Dividend Equity ETF ( SCHD )
- iShares Core Dividend Growth ETF ( DGRO )
- SPDR S&P Dividend ETF ( SDY )
- iShares Select Dividend ETF ( DVY )
- First Trust Value Line Dividend ETF ( FVD )
- iShares Core High Dividend ETF ( HDV )
- ProShares S&P 500 Dividend Aristocrats ETF ( NOBL )
- Schwab U.S. Large-Cap Value ETF ( SCHV )
- WisdomTree U.S. Dividend Growth ETF ( DGRW )
- First Trust Rising Dividend Achievers ETF ( RDVY )
- iShares Edge MSCI USA Value Factor ETF ( VLUE )
- SPDR S&P 500 High Dividend ETF ( SPYD )
- Vanguard Mega Cap Value ETF ( MGV )
- First Trust Morningstar Dividend Leaders ETF ( FDL )
- Invesco S&P 500 High Dividend Low Volatility ETF ( SPHD )
- WisdomTree Large Cap Dividend ETF ( DLN )
- Invesco S&P 500 Pure Value ETF ( RPV)
- VictoryShares US EQ Income Enhanced Volatility Weighted ETF ( CDC )
- FlexShares Quality Dividend ETF ( QDF )
- Invesco High Yield Equity Achievers ETF ( PEY )
- Fidelity High Dividend ETF ( FDVV )
- WisdomTree U.S. High Dividend Fund ( DHS )
- ALPS Sector Dividend Dogs ETF ( SDOG )
- Legg Mason Low Volatility High Dividend ETF ( LVHD )
- WisdomTree Total Dividend ETF ( DTD )
- Invesco S&P Ultra Dividend Revenue ETF ( RDIV )
- Invesco Dynamic Large Cap Value ETF ( PWV )
- SPDR Russell 1000 Yield Focus ETF ( ONEY )
- Cambria Shareholder Yield ETF ( SYLD )
- O'Shares FTSE U.S. Quality Dividend ETF ( OUSA )
- Invesco Dividend Achievers ETF ( PFM )
- Global X Super Dividend U.S. ETF ( DIV )
- JPMorgan U.S. Value Factor ETF ( JVAL )
- Vanguard U.S. Value Factor ETF ( VFVA )
- Fidelity Dividend ETF For Rising Rates ETF ( FDRR )
- VictoryShares US Large Cap High Div Volatility Wtd ETF ( CDL )
- FlexShares Quality Dividend Defensive ETF ( QDEF )
- VictoryShares Dividend Accelerator ETF ( VSDA )
- Invesco Dow Jones Industrial Average Dividend ETF ( DJD )
- iShares Core Dividend ETF ( DIVB )
- VictoryShares USAA MSCI USA Value Momentum ETF ( ULVM )
- American Century Focused Large Cap Value ETF ( FLV )
- American Century STOXX U.S. Quality Value ETF ( VALQ )
- Timothy Plan High Dividend Stock ETF ( TPHD )
- Global X Adaptive U.S. Factor ETF ( AUSF )
- Overlay Shares Large Cap Equity ETF ( OVL )
- Invesco S&P 500 Enhanced Value ETF ( SPVU )
- VanEck Morningstar Durable Dividend ETF ( DURA )
- WBI Power Factor High Dividend ETF ( WBIY )
- RiverFront Dynamic U.S. Dividend Advantage ETF ( RFDA )
- AAM S&P 500 High Dividend Value ETF ( SPDV )
- Timothy Plan High Dividend Stock Enhanced ETF ( TPHE )
- Global X S&P 500 Quality Dividend ETF ( QDIV )
- TrueShares Low Volatility Equity Income ETF ( DIVZ )
- Freedom Day Dividend ETF ( MBOX )
- First Trust Dorsey Wright Momentum & Dividend ETF ( DDIV )
- Federated Hermes U.S. Strategic Dividend ETF ( FDV )
- ProShares Equities For Rising Rates ETF ( EQRR )
- Columbia Sustainable U.S. Equity Income ETF ( ESGS )
- Invesco Russell Top 200 Pure Value ETF ( SPVM )
- Siren DIVCON Leaders Dividend ETF ( LEAD )
- Principal Value ETF ( PY )
- KFA Value Line Dynamic Core Equity ETF ( KVLE )
- First Trust U.S. Equity Dividend Select ETF ( RNDV )
- Armor U.S. Equity ETF ( ARMR )
- Natixis Vaughan Nelson Select ETF ( VNSE )
- Franklin U.S. Core Dividend Tilt ETF ( UDIV )
- iShares Focused Value Factor ETF ( FOVL )
- Columbia Research Enhanced Value ETF ( REVS )
- FlexShares Quality Dividend Dynamic Fund ( QDYN )
- ProShares Russell U.S. Dividend Growers ETF ( TMDV )
- Nuveen ESG Dividend ETF ( NUDV )
- Principal U.S. Large Cap Adaptive Multi-Factor ETF ( PLRG )
- iShares Factors U.S. Value Style ( STLV )
- Clearbridge Focus Value ETF ( CFCV )
- Sound Equity Income ETF ( DIVY )
Calculating Percentile Rankings
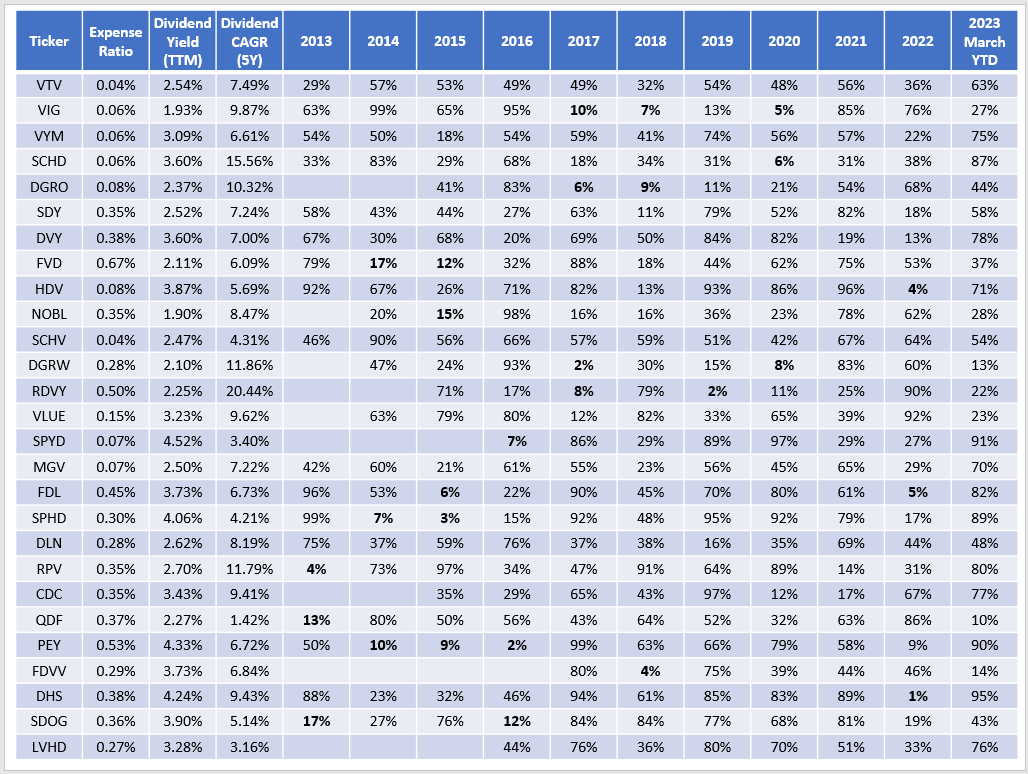
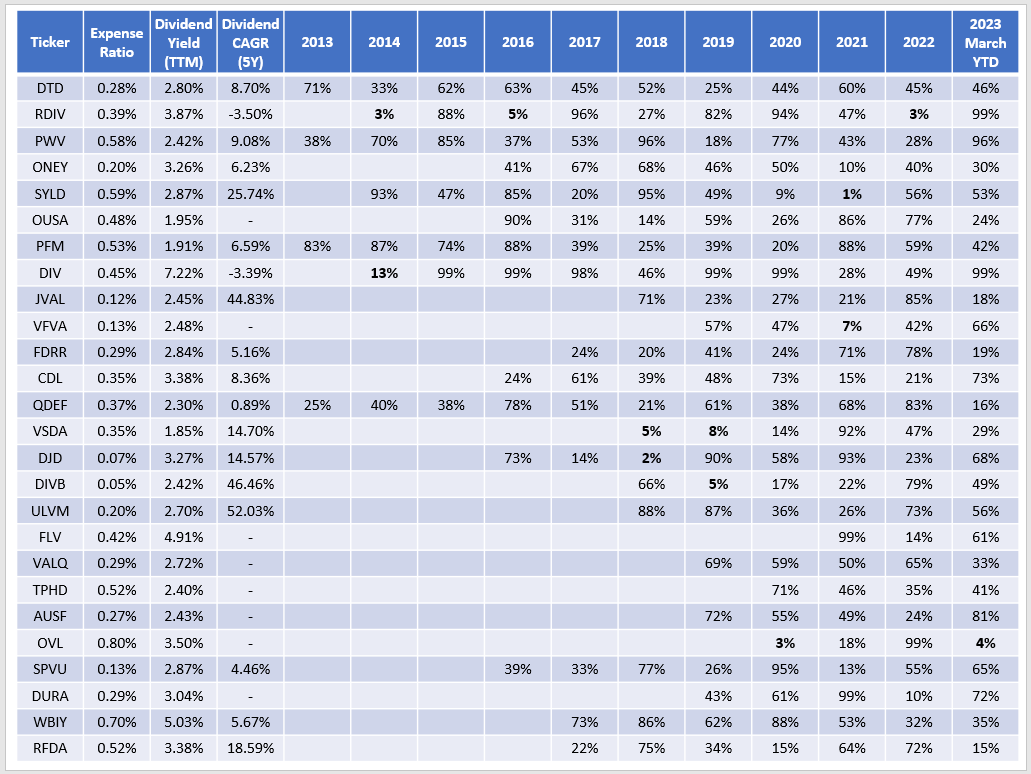
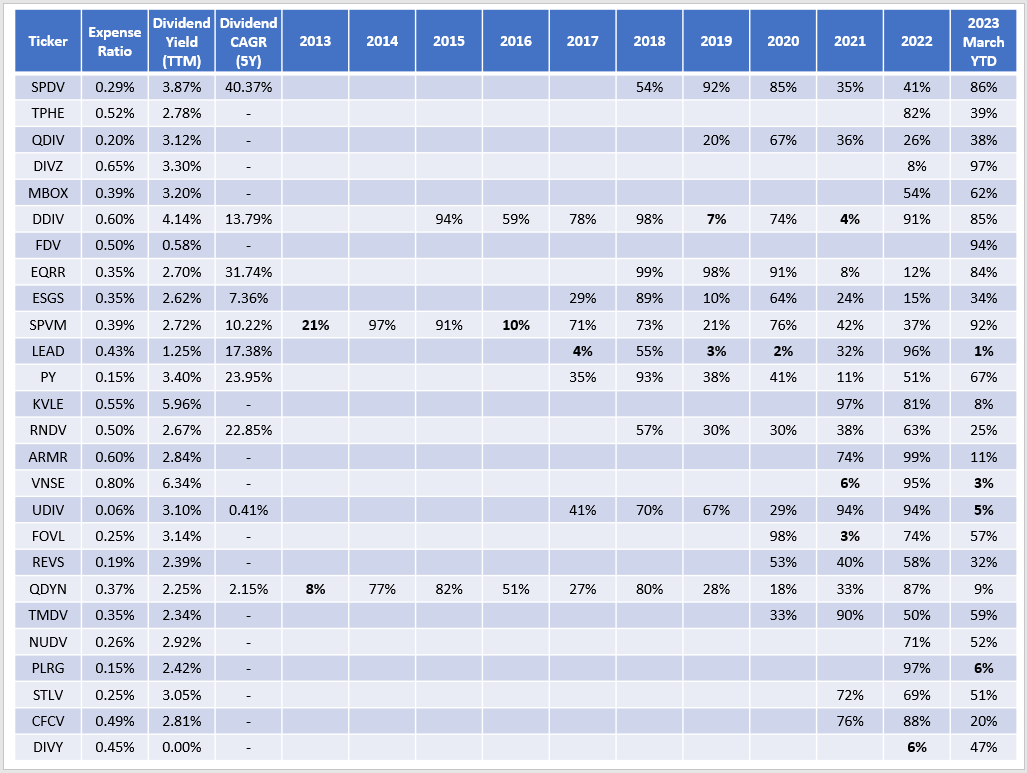
Based on this comparator group, we can calculate more meaningful performance rankings. I've divided this list into three tables but kept them in the same order by AUM. The reason is that I want to quickly identify if more established funds are doing better or if some of the newer offerings have strategies worth exploring. As a reminder, the better-performing funds have lower percentile rankings - we may want to avoid the ones that consistently score above 50%.
The Sunday Investor
The Sunday Investor
The Sunday Investor
The top five performers each year are bolded. From 2013-2018, the largest ETFs by AUM did the best, and a lot is attributable to survivorship bias and lesser competition. However, from 2019 onwards, they've had mixed results. In 2019, the tech-heavy RDVY was the only well-established top performer; in 2021, the front-page ETFs didn't do that well. Higher-fee ETFs like LEAD, SYLD, and DHS emerged as the winners from 2020-2022. Through March 2023, LEAD is again leading with a 9.14% total return.
What Constitutes Acceptable Performance?
Each reader will view these results differently. To some, massive swings in percentile rankings represent opportunity. As I did with my articles on DHS and HDV , identifying these opportunities ahead of time is exciting and just part of regular portfolio analysis. Others readers prefer a smoother ride. They want to buy and forget and are interested in something other than ETFs that might do well one year but perform terribly the next. There's no right or wrong answer, and we should keep this in mind during our conversations, which I hope will extend in the comments section. Articulating your investment objectives is vital when trying to convince others that your position is correct.
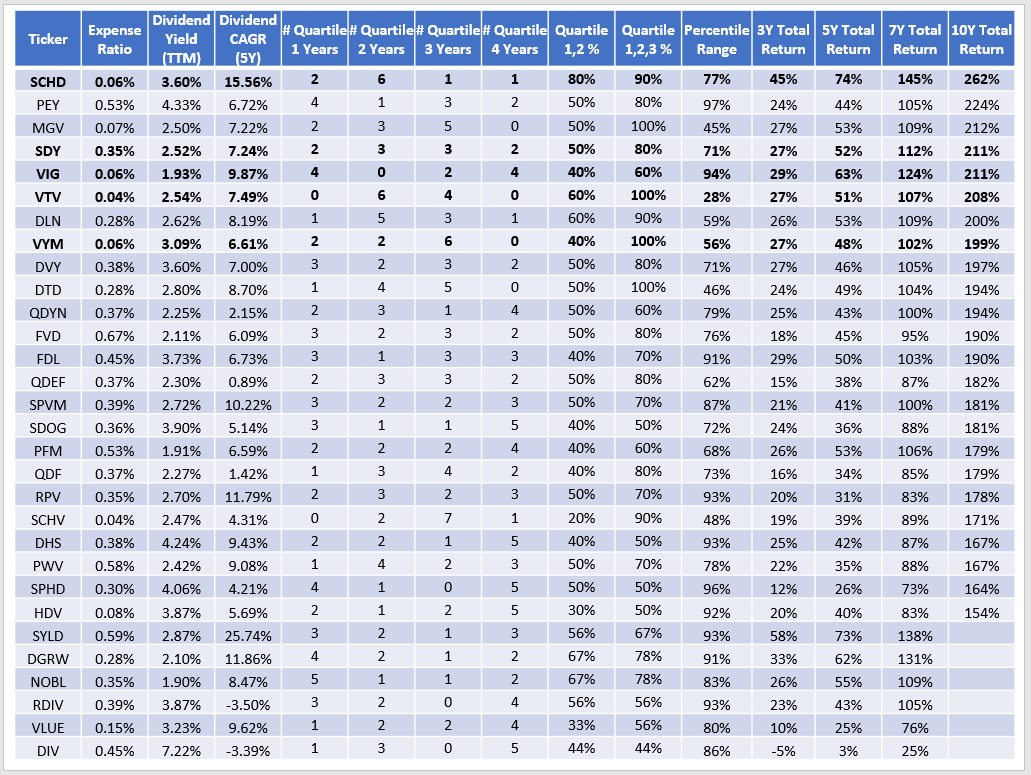
The following table is designed for both investment types. I narrowed the list down to a more manageable 30 (based on longevity) and provided the following statistics:
- fund basics (expense ratio, dividend yield, dividend growth)
- quartile performance frequency (1,2,3,4)
- range of percentile performance (highest vs. lowest)
- periodic returns (3Y, 5Y, 7Y, 10Y) through 2022
The opportunistic investor will be okay with a large range in percentile performance, while a buy-and-forget investor seeks a more steady rank. I also want you to evaluate each fund's quartile performance frequency statistic carefully. Fourth-quartile performance is unacceptable for me, while you might have stricter standards and seek above-average performance each year.
The Sunday Investor
I've bolded the largest five by assets under management: VTV, VIG, VYM, SCHD, and SDY. All have 200%+ gains over the last ten years, yet SCHD stands out for several reasons:
1. Its 262% total ten-year return is unrivaled. Anyone basing an investment choice on long-term historical returns will surely place SCHD on their watchlist. The bonuses are its 0.06% expense ratio, 3.60% trailing dividend yield, and 15.56% annualized five-year dividend growth rate.
2. SCHD ranked in the first or second quartile 80% of the time, which is why its long-term returns are excellent. However, if we lower the "acceptable performance" standard to the third quartile or better, there are more consistent choices. MGV, VTV, and VYM have ranked in the third quartile or better every year from 2013-2022. VTV's 28% percentile range is particularly impressive. VTV had its best year in 2013, ranking in the top 29%. Its worst year was in 2014, when 57% of peers outperformed. YTD in 2023, it's down, but that should eventually reverse. I discussed this in last week's article, identifying five key reasons for its relatively poor YTD returns.
In previous articles, some commenters stated that SCHD "got lucky" a few years and is a poor-performing ETF otherwise. This analysis proves that claim false. Above-average performance 80% of the time is not luck. Unless one disagrees with the comparator group, taking the claim seriously is difficult. While true that SCHD performed relatively poorly in 2014, 2016, and 2023 YTD, we shouldn't be so quick to dismiss all the outperforming years.
Besides, that's why fundamental analysis is so imperative. I've discussed SCHD's growth limitations several times, most recently in my guide to its March 2023 Index reconstitution . Underperformance this year is not surprising for me, but it's also not a fund I want to frequently trade because it's been a consistent performer. Less consistent ETFs like VIG are more appropriate trading vehicles. To illustrate, after souring on the fund in November 2021, I upgraded VIG based on its latest reconstitution described here . Those fundamentals-based calls look correct so far. Approximately 76% of peers outperformed VIG in 2022 compared to just 27% through March 2023 YTD.
Fundamentals vs. VTV, VIG, VYM, DGRO, SDY
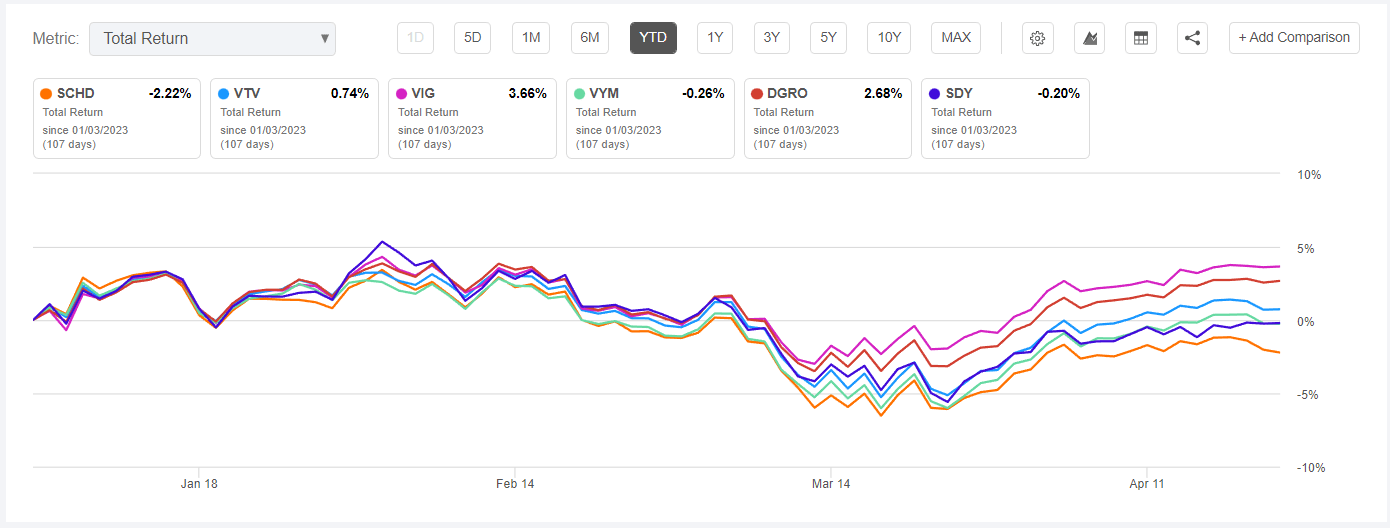
YTD through April 21, SCHD is down 2.22% compared to a 3.66% gain for VIG. Total returns for VTV, VYM, DGRO, and SDY are also included in the performance chart below.
Seeking Alpha
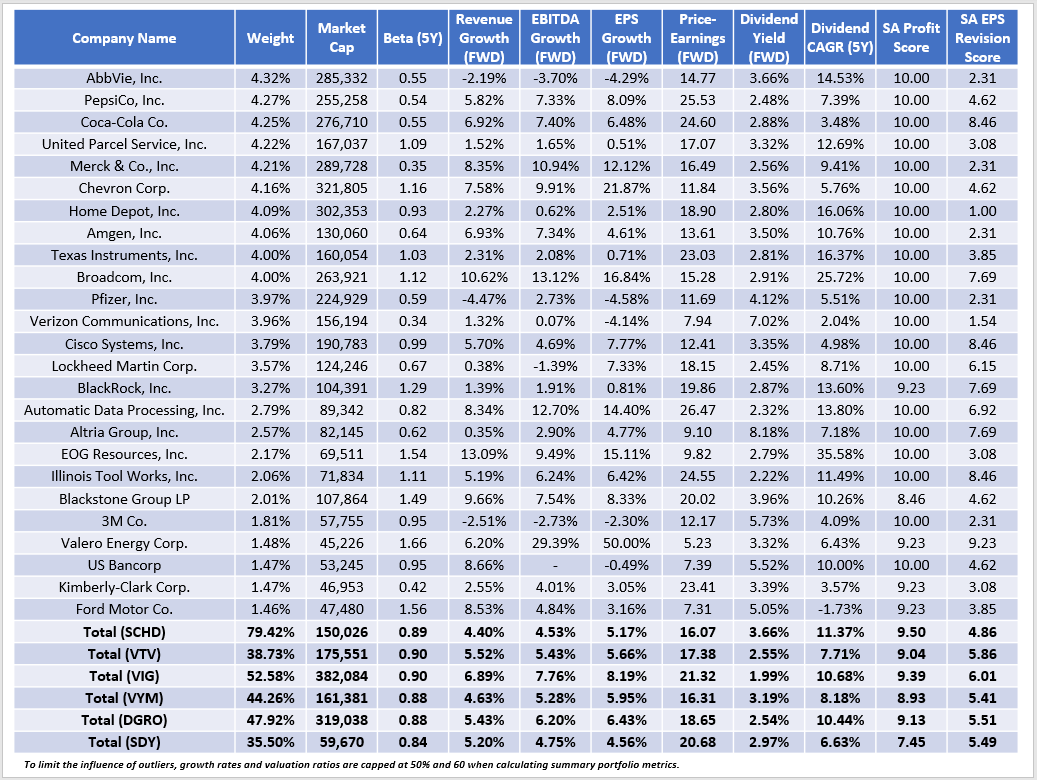
SCHD is typically more concentrated than other dividend ETFs. That might explain why its year-to-year performance rankings are more volatile than others. Then again, VIG is also float-market-cap-weighted with a 4% individual weight limit at each rebalancing, so there's more to it than that. Valuation plays a key role. SCHD trades at a lower P/E, is more defensive, and often outperforms in declining markets. VIG is more suitable for bullish markets when investors focus less on valuation and more on growth. These are some of the factors evaluated in the industry-level analysis below, including summary metrics for VTV, VYM, DGRO, and SDY.
The Sunday Investor
SCHD trades at 16.07x forward earnings, the lowest of the six comparators. Its 9.50/10 Profitability Score, 3.66% gross forward dividend yield, and constituents' 11.37% five-year dividend growth rate are also leading metrics. These are your reasons to own SCHD, and they remained similar after the latest reconstitution. However, that's where the good news ends. SCHD has a 4.40%, 4.53%, and 5.17% estimated revenue, EBITDA, and EPS growth rate, the worst of the six comparators. Finally, its 4.86/10 EPS Revision Score is a crucial reason I'm not rushing to add. For the consistency reasons listed earlier, it's not worth selling.
Still, there are better options, and VIG is one of them. Its 6.01/10 EPS Revision Score is impressive for any diversified ETF. Its 9.39/10 Profitability Score is second-best in the sample, as are its growth rates. The yield is too low for an income investor, but since I'm focused more on total returns, I'm willing to pay the extra premium for these features. So far, the market agrees.
Investment Recommendation
SCHD features a low 0.06% expense ratio, a 3.60% trailing dividend yield, a 15.56% five-year dividend growth rate, and a 9.39/10 Profitability Score. My performance analysis over the last ten years revealed how SCHD ranked in the top two quartiles 80% of the time and the top three quartiles 90% of the time. The chances SCHD got lucky over these ten years are slim, and suggestions otherwise are without merit because they don't correctly consider suitable alternatives in the dividend ETF space. I carefully selected a comparator group of 78 that dividend investors would likely consider because it was yield or strategy-driven. If there are ETFs I missed, I'm happy to add them to the list if their investment objectives are reasonably similar.
Despite its strengths, SCHD has at least two weaknesses. First, it's a low-growth fund with poor earnings momentum, and that's not what the market favors right now. In the short term, investors are better off sacrificing yield and aiming for higher-growth stocks. VIG does that well, but its 1.93% trailing dividend yield may be too much of a sacrifice. Second, MGV, VTV, and VYM ranked in the top three quartiles every year in the last ten years, so you may consider them superior because they are more consistent. Your view on that will depend on what you consider acceptable performance, but I hope the information in the article will help you make the best decision for your portfolio. As always, I look forward to the discussion in the comments section, and I appreciate you taking the time to read through this lengthy analysis.
For further details see:
SCHD Performance In Focus: Quartile Rankings Vs. 78 Large Cap Dividend Peers