QQQ - SDS Is A Good Hedging Tool But Beware Of Whipsaw
2023-08-02 04:00:18 ET
Summary
- A drift watchlist with SDS and 21 other leveraged ETFs.
- A semiconductors leveraged ETF shows the worst decay.
- The average decay of SDS is close to zero, but it may be negative during long periods.
The ProShares UltraShort S&P500 ETF ( SDS ) is one of the most popular instruments to short the broad market for trading or hedging purposes. However, its daily -2X leverage factor is a source of drift. It must be closely monitored to detect changes in the drift regime. This article explains what "drift" means, quantifies it in 22 leveraged ETFs, shows historical data, and finally concludes about the current market conditions.
Why do leveraged ETFs drift?
Leveraged ETFs often underperform their underlying index leveraged by the same factor. The decay has essentially four reasons: beta-slippage, roll yield, tracking errors, management costs. Beta-slippage is the main reason in equity leveraged ETFs. To understand what is beta-slippage, imagine a very volatile asset that goes up 25% one day and down 20% the day after. A perfect double-leveraged ETF goes up 50% the first day and down 40% the second day. On the close of the second day, the underlying asset is back to its initial price:
(1 + 0.25) x (1 - 0.2) = 1
And the perfect leveraged ETF?
(1 + 0.5) x (1 - 0.4) = 0.9
Nothing has changed for the underlying asset, and the ETF price is down 10%. It is not a scam, just the normal behavior of a leveraged and rebalanced portfolio. In a trending market, beta-slippage can be positive. If the underlying index goes up 10% two days in a row, on the second day, it is up 21%:
(1 + 0.1) * (1 + 0.1) = 1.21
The perfect 2x leveraged ETF is up 44%:
(1 + 0.2) * (1 + 0.2) = 1.44
Beta-slippage is path-dependent. If the underlying index gains 50% on day 1 and loses 33.33% on day 2, it is back to its initial value, like in the first example. However, the 2x ETF loses one-third of its value, instead of 10% in the first case:
(1 + 1) x (1 - 0.6667) = 0.6667
Without a demonstration, it shows that the higher the volatility, the higher the decay. Hence, its name: "beta" is a statistical measure of volatility. However, it is a bit misleading because the decay cannot be calculated from beta.
Monthly and yearly drift watchlist
There is no standard or universally recognized definition for the drift of a leveraged ETF. Some are quite complicated. Mine is simple and based on the difference between the leveraged ETF performance and Ñ times the performance of the underlying index on a given time interval, if Ñ is the leveraging factor. Most of the time, this factor defines a daily objective relative to an underlying index. However, some dividend-oriented leveraged products have been defined with a monthly objective (mostly defunct ETNs sponsored by Credit Suisse and UBS: CEFL, BDCL, SDYL, MLPQ, MORL…).
First, let’s start by defining “Return”: it is the return of a leveraged ETF in a given time interval, including dividends. “IndexReturn” is the return of a non-leveraged ETF on the same underlying asset in the same time interval, including dividends. “Abs” is the absolute value operator. My “Drift” is the drift of a leveraged ETF normalized to the underlying index exposure in a time interval. It is calculated as follows:
Drift = (Return - (IndexReturn x Ñ))/ Abs(Ñ)
“Decay” means negative drift. “Month” stands for 21 trading days, “year” for 252 trading days. A drift is a difference between 2 returns, so it may go below -100%.
| Index |
| Ñ |
| Ticker |
| 1-month Return |
| 1-month Drift |
| 1-year Return |
| 1-year Drift |
| S&P 500 |
| 1 |
| 4.49% |
| 0.00% |
| 14.58% |
| 0.00% |
| 2 |
| 8.55% |
| -0.22% |
| 19.66% |
| -4.75% |
| -2 |
| -7.53% |
| 0.73% |
| -23.29% |
| 2.94% |
| 3 |
| 12.73% |
| -0.25% |
| 21.36% |
| -7.46% |
| -3 |
| -11.34% |
| 0.71% |
| -37.40% |
| 2.11% |
| ICE US20+ Tbond |
| 1 |
| -1.40% |
| 0.00% |
| -12.53% |
| 0.00% |
| 3 |
| -6.07% |
| -0.62% |
| -45.95% |
| -2.79% |
| -3 |
| 4.97% |
| 0.26% |
| 38.42% |
| 0.28% |
| NASDAQ 100 |
| 1 |
| 5.46% |
| 0.00% |
| 24.73% |
| 0.00% |
| 3 |
| 15.50% |
| -0.29% |
| 45.33% |
| -9.62% |
| -3 |
| -14.60% |
| 0.59% |
| -58.93% |
| 5.09% |
| DJ 30 |
| 1 |
| 4.30% |
| 0.00% |
| 11.57% |
| 0.00% |
| 3 |
| 12.12% |
| -0.26% |
| 15.62% |
| -6.36% |
| -3 |
| -10.84% |
| 0.69% |
| -28.40% |
| 2.10% |
| Russell 2000 |
| 1 |
| 6.62% |
| 0.00% |
| 8.62% |
| 0.00% |
| 3 |
| 18.89% |
| -0.32% |
| -1.12% |
| -8.99% |
| -3 |
| -17.01% |
| 0.95% |
| -34.82% |
| -2.99% |
| MSCI Emerging |
| 1 |
| 6.88% |
| 0.00% |
| 6.91% |
| 0.00% |
| 3 |
| 19.57% |
| -0.36% |
| -1.29% |
| -7.34% |
| -3 |
| -17.96% |
| 0.89% |
| -23.38% |
| -0.88% |
| Gold spot |
| 1 |
| 2.97% |
| 0.00% |
| 11.43% |
| 0.00% |
| 2 |
| 5.27% |
| -0.34% |
| 14.24% |
| -4.31% |
| -2 |
| -4.83% |
| 0.56% |
| -16.57% |
| 3.15% |
| Silver spot |
| 1 |
| 9.51% |
| 0.00% |
| 23.11% |
| 0.00% |
| 2 |
| 18.75% |
| -0.14% |
| 33.45% |
| -6.39% |
| -2 |
| -17.30% |
| 0.86% |
| -45.82% |
| 0.20% |
| S&P Biotech Select |
| 1 |
| 2.02% |
| 0.00% |
| 2.17% |
| 0.00% |
| 3 |
| 4.14% |
| -0.64% |
| -31.28% |
| -12.60% |
| -3 |
| -6.27% |
| -0.07% |
| -45.64% |
| -13.04% |
| PHLX Semicond. |
| 1 |
| 7.16% |
| 0.00% |
| 34.04% |
| 0.00% |
| 3 |
| 19.32% |
| -0.72% |
| 48.12% |
| -18.00% |
| -3 |
| -19.98% |
| 0.50% |
| -78.90% |
| 7.74% |
The best and worst drifts
- The leveraged bull semiconductors ETF ( SOXL ) has the worst monthly decay of this list with a drift of -0.72%, closely followed by the leveraged bull biotechnology ETF ([[LABU]], -0.64%).
- SOXL also has the worst 1-year decay at -18%.
- The leveraged bear Russell 2000 ETF ( TZA ) shows the highest positive drift in one month: +0.95%.
- In 12 months, the largest positive drift is for the leveraged bear semiconductors ETF ( SOXS ) with +7.74%.
Positive drift follows a steady trend in the underlying asset, whatever the trend direction and the ETF direction. It means positive drift may come with a gain or a loss for the ETF. Negative drift comes with daily return volatility (“whipsaw”).
S D S drift history
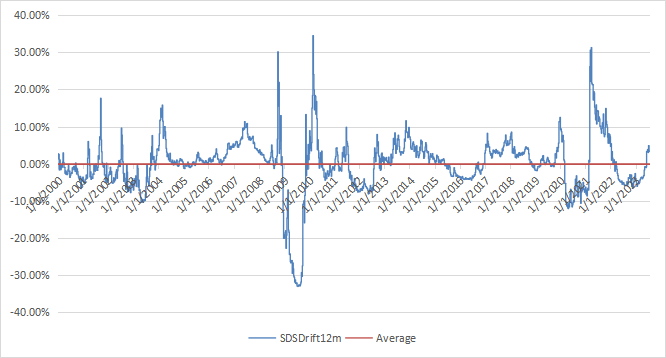
SDS has lost 99.3% of its value since inception on 7/11/2006, through a number of reverse splits. However, hedging with SDS has worked quite well in many cases. For example, in the first week of the 2020 market meltdown (2/21 to 2/28/2020), it has gained over 25%, significantly more than SPY's return (-11%) multiplied by the leveraging ratio (-2). Then, I have issued a warning on 3/10/2020 against leveraged equity ETFs. In the following weeks, SDS suffered a steep decay. Later, the monthly drift has oscillated between positive and negative values, and the 12-month drift was negative until February 2021. It jumped back in positive territory, spiked in April 2021, and fell below zero in March 2022. It has been positive again since the second half of June this year. The next chart plots the 12-month drift since January 2000, using real prices from July 2006, and synthetic prices based on the underlying index before that. The historical average is close to zero (precisely -0.15%), which is much better than -3.12% for the -3x ETFs SPXS and SPXU.
12 month drift of SDS, with synthetic prices before July 2006 (chart: author; data: Portfolio123)
12 month drift of SPXS, with synthetic prices before November 2008 (chart: author; data: Portfolio123)
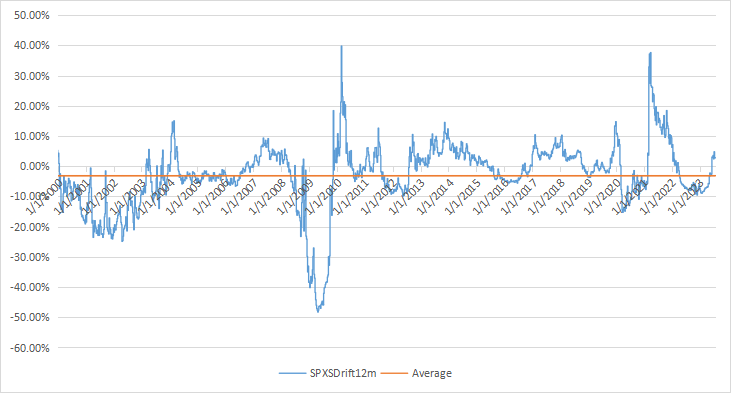
SDS is an efficient hedging instrument against sharp corrections in a bull market. The cost of hedging is quite cheap compared with other derivatives, and the drift history is less harmful than for -3x ETFs. However, it suffers a significant decay when the S&P 500 has alternatively positive and negative daily returns. The VIX index (implied volatility) is not directly related to decay, but it may be a warning. Moreover, keep in mind that shorting an asset or buying an inverse ETF implies an additional decay due to inflation and magnified by the leveraging factor. Inflation was not a concern until 2020, but now it is a serious one.
Even if SDS is safer than SPXU or SPXS regarding both volatility and decay, it is a product for experienced investors who understand its behavior.
For further details see:
SDS Is A Good Hedging Tool, But Beware Of Whipsaw