SPCX - Searching For Momentum In The IPO Drought
2023-04-17 11:45:00 ET
Summary
- Poor market conditions effectively shut down the U.S. IPO (initial public offering) market in 2022. We analyzed previous IPO droughts (2003 and 2008) to assess when the market may rebound.
- Despite strong performance on the day of issuance, companies that went public in 2021 have disappointed significantly - many are down more than 50% relative to broad market performance (e.g., S&P 500), and a number of these companies are concentrated in the risky, early-stage pharmaceuticals space.
- Investing in IPOs remains a profitable strategy for investors who can garner allocations; however, when the market becomes hot, investors should avoid poor-quality deals and companies with unrealistic valuations.
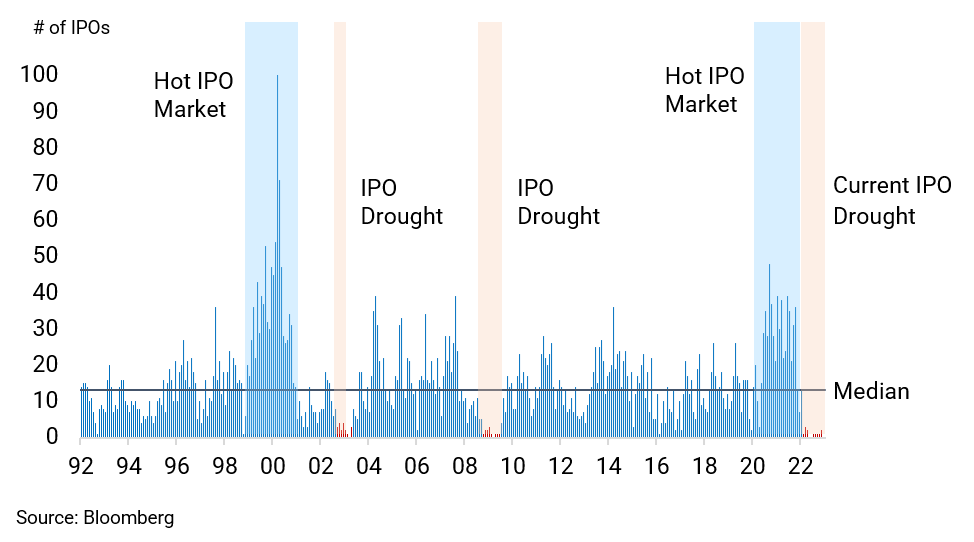
The U.S. stock market saw a dramatic decline in the numbers of IPOs in 2022, when new issuances collapsed dramatically after 2021 and the S&P 500 fell almost 20% for the year. Exhibit 1 highlights two periods over the past thirty years when comparable IPO droughts (i.e., when the average monthly number of IPOs was less than 10) were observed: July 2002 to July 2003 in the aftermath of the Tech Bubble, and August 2008 to July 2009 during the wake of the Global Financial Crisis. In the graph, we also emphasize two notable “Hot IPO Market” periods (i.e., when the average monthly number of IPOs was greater than 25): the tech-led bull market from the late 1990s into 2000 and the recent market recovery following the pandemic drawdown.
Exhibit 1: Monthly IPO Volumes (1992 to 2023)
In this paper, we explore past IPO droughts and examine historical trends that may provide insight on when the market could return to more normal conditions. First, we take a deep dive into the IPOs of 2021, analyzing issuance by sector and the performance of this basket of stocks relative to the market (defined as the S&P 500). Then, we analyze historical IPO performance, comparing the results of two strategies - the first assumes an investor receives an allocation to each IPO and sells it at the closing price on the initial offering date of the issue, while the second assumes a holding period of one year.
A Look Back at 2021 IPO Issuance and Performance
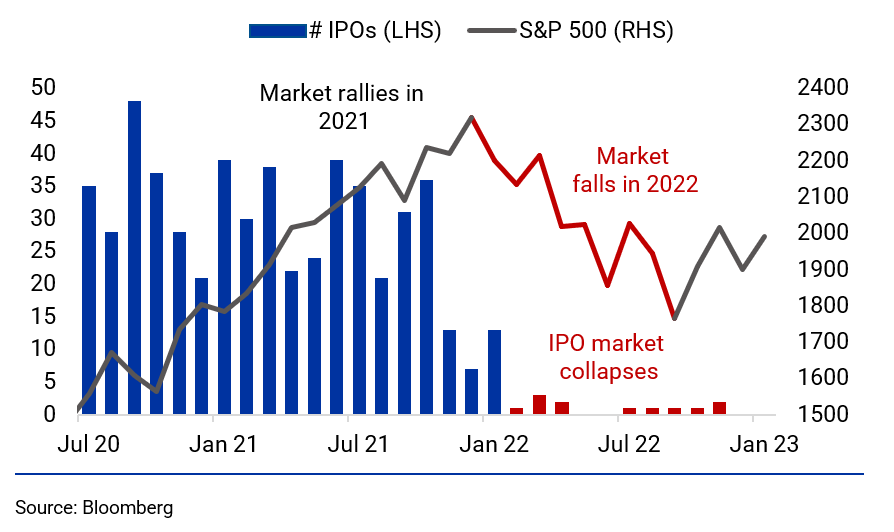
The stock market performed well in 2021, and private companies took advantage of attractive market conditions, racking up 264 IPOs. 1 Healthcare companies comprised the largest segment of the IPO market at 38%, followed by Information Tools at 21%. The 2021 IPO market was riding a trend which had been in place since 2020 that continued into part of January 2022. However, the market reversed and declined in January and February 2022, with the S&P 500 down 5.17% and 2.99%, respectively. In February, the IPO spigot effectively closed with merely 12 IPOs coming to market over the next 10 months through December, as the market continued to fall and posted a loss of 18.11% for the year.
Exhibit 2: IPO Volume and S&P 500 Performance (Jul 2020 to Jan 2023)
Examining Past IPO Droughts and Market Rebounds
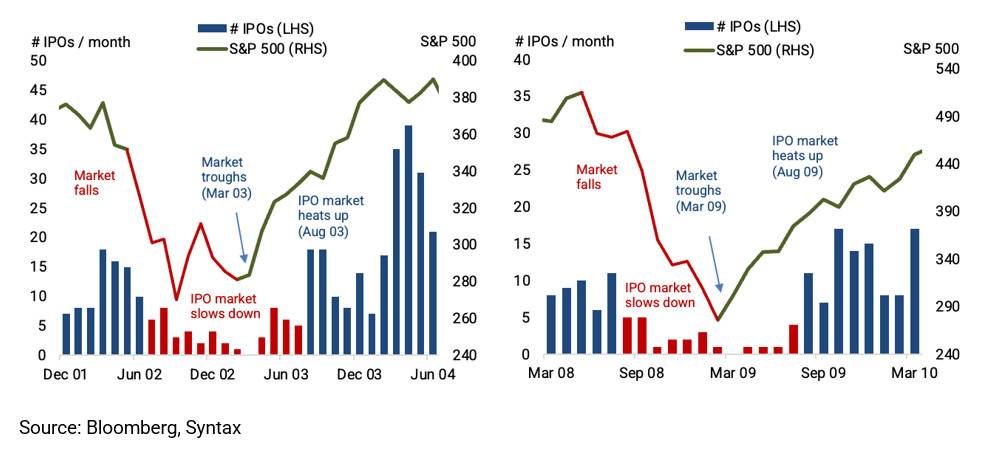
Looking back at the Tech Bubble, the S&P 500 peaked in March of 2000 and, by the end of the year, was down 12.19%. The downturn continued in 2001, with the S&P 500 falling another 11.19%. The bear market accelerated further in 2002, with the Index declining 22.10% for the year. Exhibit 3 shows moderate IPO activity in 2001, but in July 2002, activity slowed meaningfully over the next 13 months. IPO activity eventually recovered in August, approximately five to six months after the market lows in March 2003. The S&P 500 rallied a meaningful 20.9% from the end of February 2003 to the end of August 2003.
The story was similar leading into, during and following the Global Financial Crisis. The U.S. equity market was performing well during the first quarter of 2008 before a downturn in the second quarter and the subsequent rapid decline in the third quarter that was triggered by the collapse of Lehman Brothers. Starting in August 2008, IPO issuance hovered at low levels for roughly 11 months before picking up. The S&P 500 rallied 40.5% from the end of February 2009 to the end of August 2009, prompting the reopening of the IPO market.
Exhibit 3: IPO Volumes and S&P 500 Performance Before, During and after the Tech Bubble and Global Financial Crisis
Based on these prior episodes, the market rallied significantly off its lows, and the IPO market, in each case, reopened five months later. While the market started trending upward in January this year, it reversed course in February and March. Given historical data and trends, we do not expect a rebound in the current IPO market until there are approximately five months of strong market performance, which, at the earliest, would be at the end of the third quarter of this year.
Analyzing Long-Term IPO Strategy and Performance
Investing in IPOs may be an attractive opportunity for institutional investors. An IPO is typically marketed at a discount to a company’s intrinsic value and often outperform significantly on the day of the listing. To highlight this, we analyzed the performance of IPOs under two scenarios:
- The first assumes that investors allocate capital to multiple IPOs, receive an allocation to each IPO and then sell the stock at market close on the day that each IPO is issued.
- The second assumes that investors receive an allocation and hold the IPO for one year.
In both scenarios, we compared performance relative to the S&P 500 and equally weighted each IPO. The two investment strategies are quite different: the first scenario requires substantial trading, moving in and out of cash and the IPO positions, while the second leverages a simpler, buy-and-hold approach. The analysis does not account for transaction costs, the impact of any tax consequences on non-qualified investors or assumptions about whether investors can participate in all IPOs. Exhibit 4 details the year-by-year performance of both strategies.
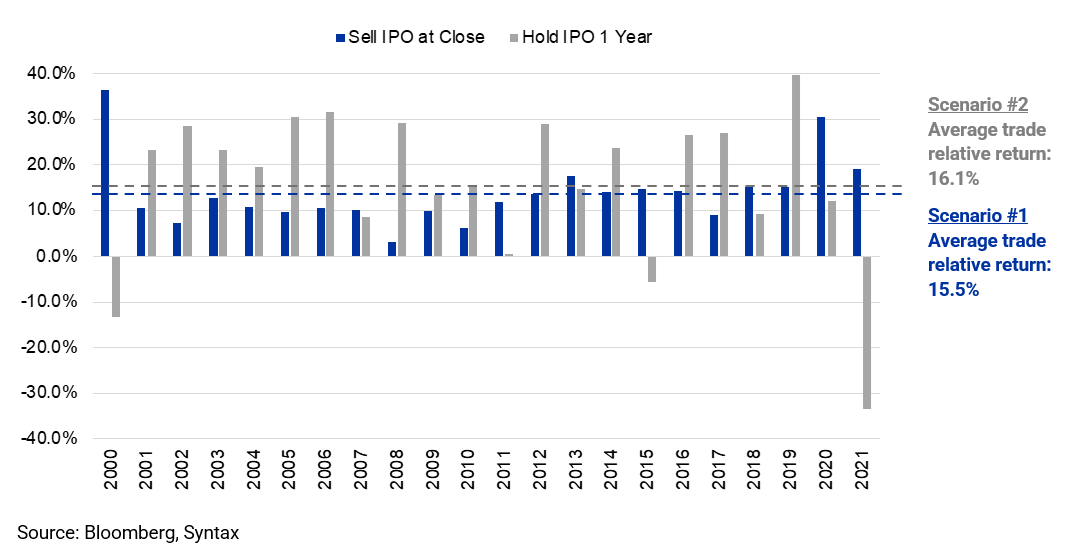
Exhibit 4: IPO Vintage Year Performance Relative to S&P 500: Sell IPO at Close vs. Hold IPO for One Year
First Scenario - Sell IPOs at Close: If investors can receive an allocation to IPOs at the offering price, then selling the IPO at the close of the initial day of trading has been a consistently profitable strategy from 2000 to 2021. While there have been some years when the average IPO returns were above 20%, 18 out of the 22 years show that IPOs have returned between 5.0% and 15.2% above market performance. Although the analysis here does not account for the impact of taxes or brokerage fees, the average premium realized across a vintage year is 15.5%. This intuitively makes sense if an investor believes that the issuer has to offer the buyer a discount as an incentive to purchase the IPO.
Second Scenario - Hold IPOs for One Year: Overall, this scenario produces similarly strong results - the average trade outperforms the market by 16.1% over the following year, albeit with greater volatility. Between 2000 and 2021, there have been two meaningfully negative vintage years relative to the S&P 500. The 182 IPOs from the 2000 vintage year lost on average 13.2%, driven by two tech-related sectors: Information Tools (78 IPOs down 38.5%) and Information (25 IPOs down 17.5%). The other sectors produced positive returns relative to the S&P 500. In 2021, the 264 IPOs were down 33.3%. While the poor showing was led by Healthcare stocks that underperformed by 45%, Consumer, Information Tools and Information stocks also underperformed by 35% to 40% relative to the S&P 500.
Although the investment strategy in Scenario 2 is highly profitable, new issues have recently (since 2021) struggled in the secondary markets.
A Deeper Dive into 2021 IPO Issuance and Performance
Exhibit 5: 2021 IPO Issuance by Sector
The Healthcare sector accounted for 102 new issues 39% of the 2021 IPO issuance. This is not unusual; since 2000, Healthcare IPOs have accounted for 27% of the total. The above-average amount in 2021 is likely related to favorable valuations and the outlook for breakthrough drugs tied to the pandemic - 65 companies were pharmaceuticals, including 60 whose lead drugs were still in clinical testing. In addition, there were 28 initial offerings tied to hospital equipment and medical devices; the remaining nine were healthcare providers and insurers. Information Tools was the next-largest segment, with 55 companies representing 21% of issuance, 50 of these companies classified as software firms. Finally, consumer and Information IPOs each accounted for 11% of issuance; the remaining sectors dropped off, as shown in Exhibit 5.
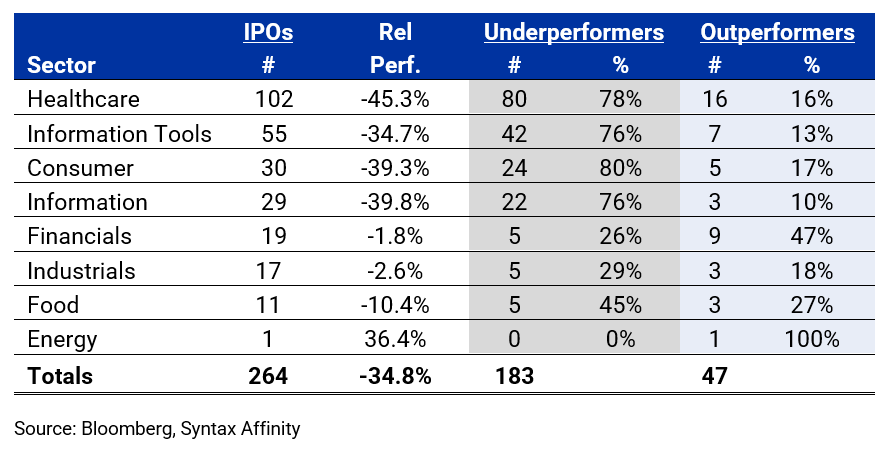
To assess performance, we treated 2021 as a vintage year where we measured the performance of every IPO from its 2021 issue date through January 31, 2023, relative to the market. We define “underperformers” as those stocks that trailed the market by 10% or more and “outperformers” as those stocks that exceeded the market by 10% or more. Exhibit 6 highlights that underperformers exceeded outperformers by a ratio of almost 4:1. Healthcare, Information Tools, Consumer, and the Information sectors broadly trailed the market, as between 76% to 80% of total issuers fell short of the S&P 500. In terms of sheer volume, 80 of the 102 Healthcare IPOs trailed. The best sector relative to the market was Financials, where 9 of the 19 new listings outperformed the market by more than 10%, compared to only five issuers (26%) underperforming by more than 10%.
Exhibit 6: 2021 IPOs - Under- and Outperformance by Sector
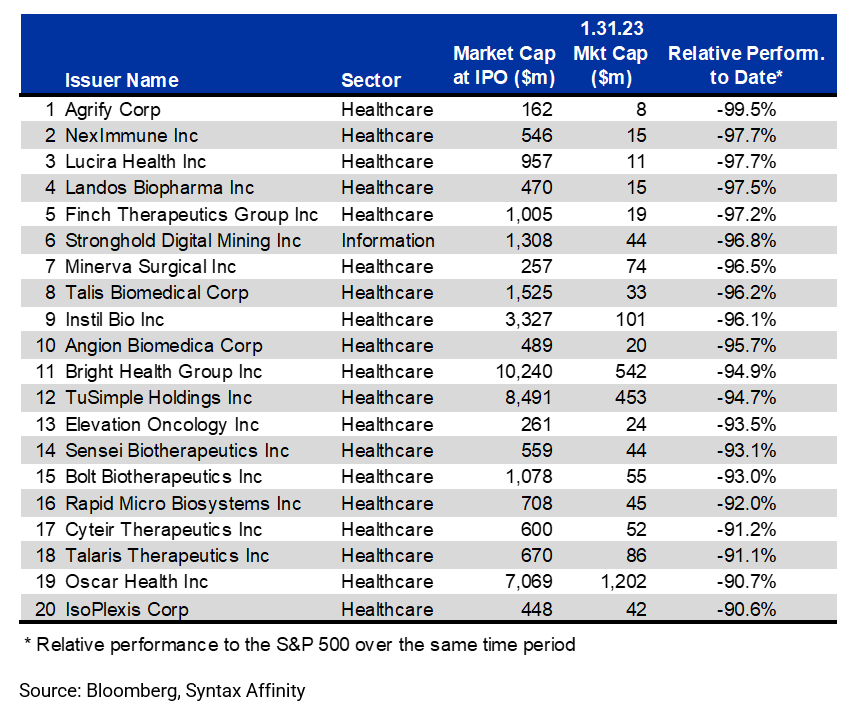
As shown in Exhibit 7, the results of the 20 worst-performing IPOs in 2021 were dominated by companies from the Healthcare sector.
Exhibit 7: Worst-Performing IPOs in 2021 Relative to S&P 500 - IPO Date to Jan 31, 2023
Looking Ahead
The market downturn in 2022 created unfavorable conditions for public offerings, resulting in a dramatic fall in recent IPO volumes. Based on the decline in new issues observed after the Tech Bubble and the Global Financial Crisis, we expect IPO issuance to pick up around the end of the third quarter of this year if the market can regain its footing over the next quarter.
According to our analysis, investors who received initial allocations to IPOs and sold their allocated shares at the close of the first day of trading have earned, on average, a 15-percentage point return over the S&P 500 over the last 22 IPO vintage years. The premium would have been similar for an IPO investor who held onto their allocation, although the variance is more significant. While the buy and hold for one year strategy only produced three negative years relative to the S&P 500 over the last 22 years, the vintage year results for 2000 (down 13%) and 2021 (down 33%) show this strategy can produce negative returns. The key takeaway is to be wary of feverish IPO markets and carefully consider valuations. We highlighted that the 20 worst IPOs of 2021 had returns of -90% or more relative to the S&P 500, turning some once-promising pharmaceutical companies into penny stocks in a short period of time, highlighting the need to size IPO investments appropriately, as new listings generally surge again following a market recovery.
_________
1 Includes all IPOs of at least US$ 50 million.
Original Source: Author
For further details see:
Searching For Momentum In The IPO Drought