CRON - September Breakout Report Week 37 - 2023: Topping Signs Bear Bounces Record Dollar Highs
2023-09-11 12:39:32 ET
Summary
- Ongoing MDA stock breakout picks, zombie stocks, ETF trading, Dow picks, and long-term value selections are reviewed ahead of Week 37.
- Cannabis segment is showing strong breakout conditions from August on potential federal policy changes in the coming weeks.
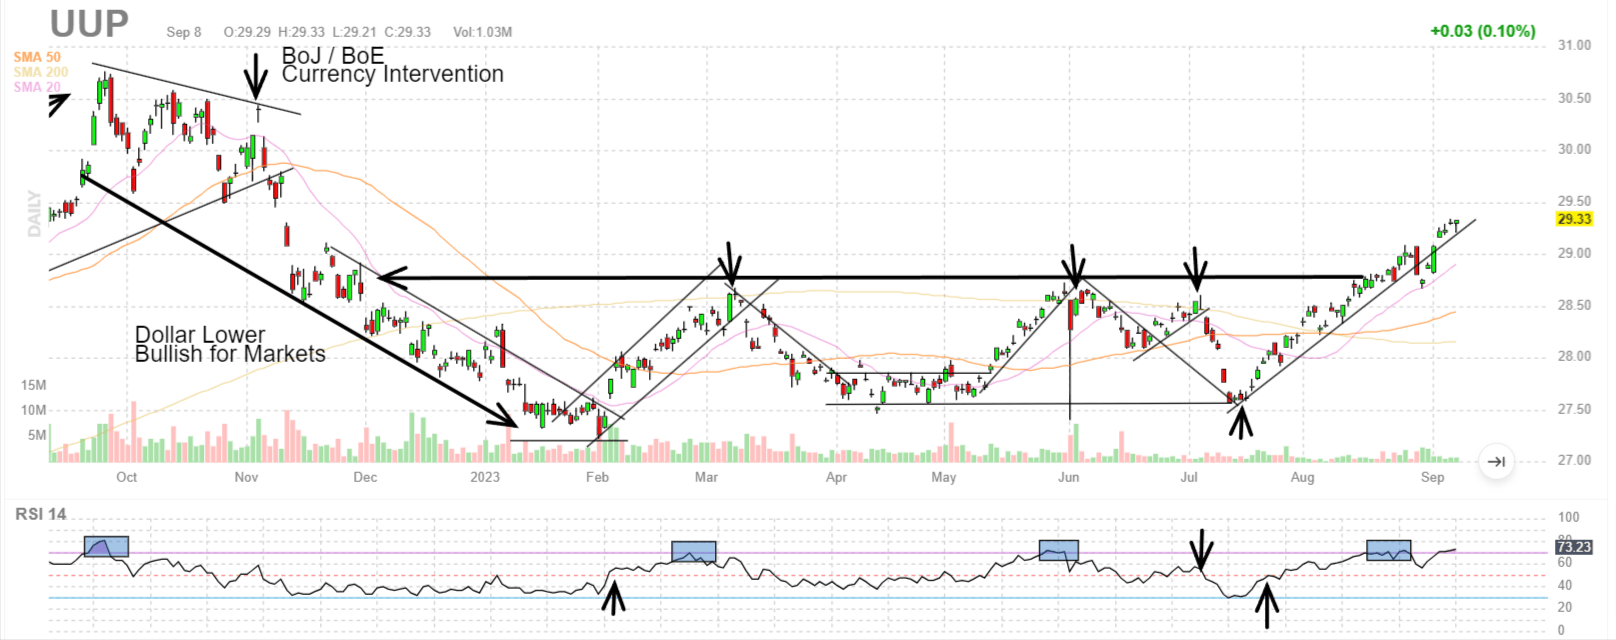
- Invesco DB US Dollar Index Bullish Fund is reaching peak 2023 highs, further validating bearish market directions.
- As interest rates are rising to the highest levels in 22 years, "zombie" stocks with higher than average credit risk levels may be an important focus.
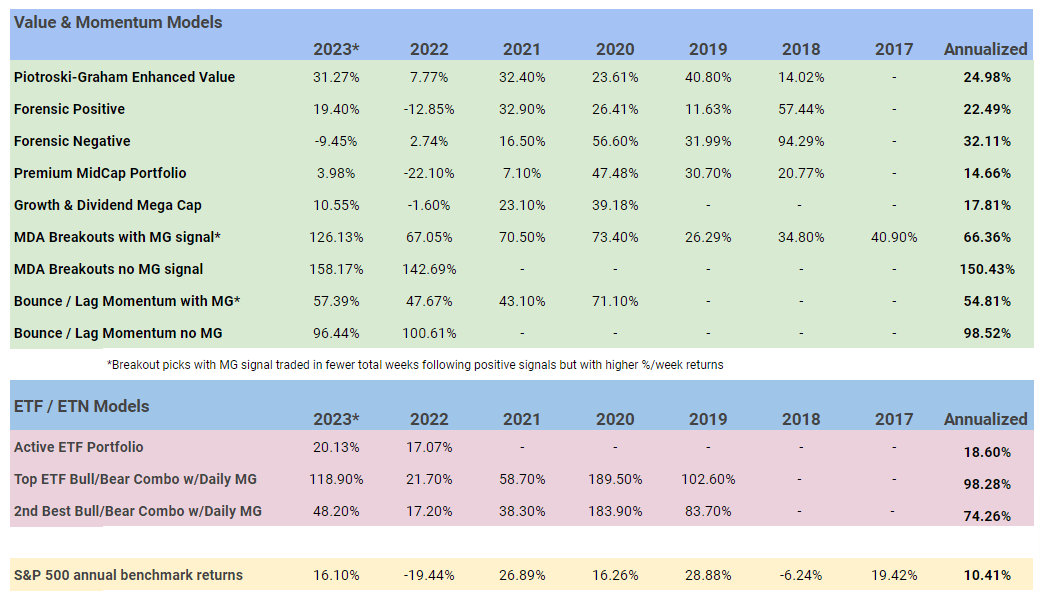
- Long Term January portfolios: Piotroski +31.3%, Positive Forensic +19.4%, Mid-year Growth & Dividend +10.55% and Active ETF up +20.1% YTD.
Introduction
More changes are coming to my Weekly Breakout Forecast reporting on the doctoral research analysis of MDA breakout stock selections over more than 8 years. This high frequency breakout portfolio subset I regularly release has now reached 327 weeks of public selections on Seeking Alpha as part of this ongoing live forward-testing research. My regular articles will now follow this schedule while IG articles will continue unchanged.
| Weekly MDA Breakout picks (from JD) |
| Once a month |
| Weekly Dow 30 stock picks |
| Once a month |
| Weekly ETF / ETN picks from MDA model |
| IG only |
| Weekly Bounce/Lag Momentum picks (bonus from Grant) |
| IG only |
| Daily Market and Momentum Gauge Signals |
| IG only |
| Monthly Growth & Dividend mega cap picks |
| IG only |
| Long-Term Value Portfolios |
| Semi-Annually |
This new summary article format will highlight some ongoing MDA stock breakout picks, zombie stocks, ETF trading, Dow picks, and long-term value selections throughout the year.
Topping Signals
Prominent head/should topping patterns are one of the key features we are watching closely as we enter September, the worst month of the year on average since 1927.
Twitter.com
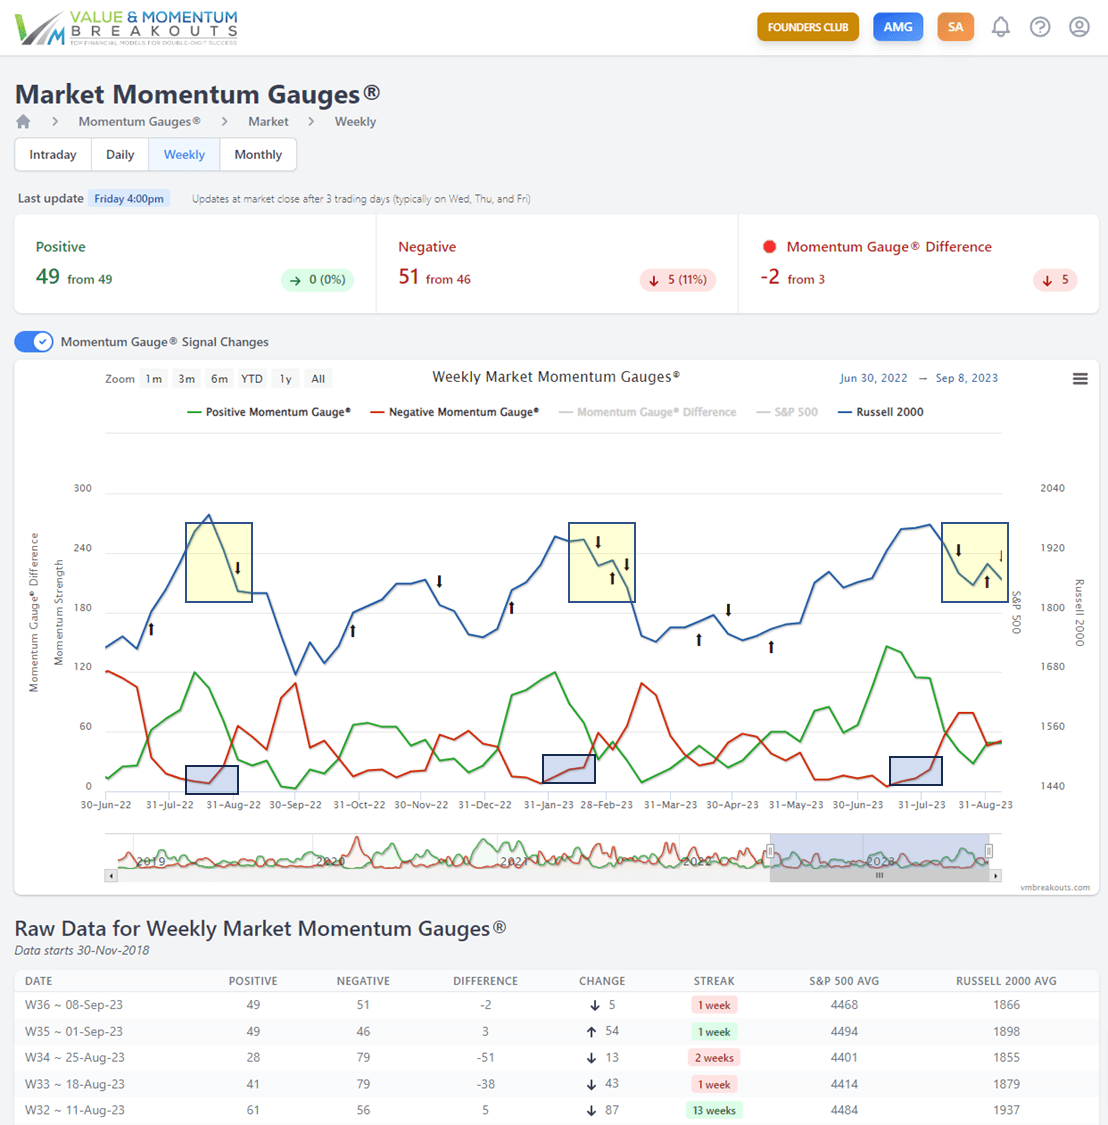
Related to these bearish patterns into September, we are tracking the daily and weekly Momentum Gauge signals that closely resemble prior market tops in both February and last September.
Using the daily and weekly momentum gauges further allows timing enhancements for long-term portfolios and trading decisions. So far the January Piotroski-Graham value portfolio continues to lead all our long-term buy/hold stock portfolios this year with SkyWest ( SKYW ) +157.5% YTD.
Bear Bounces
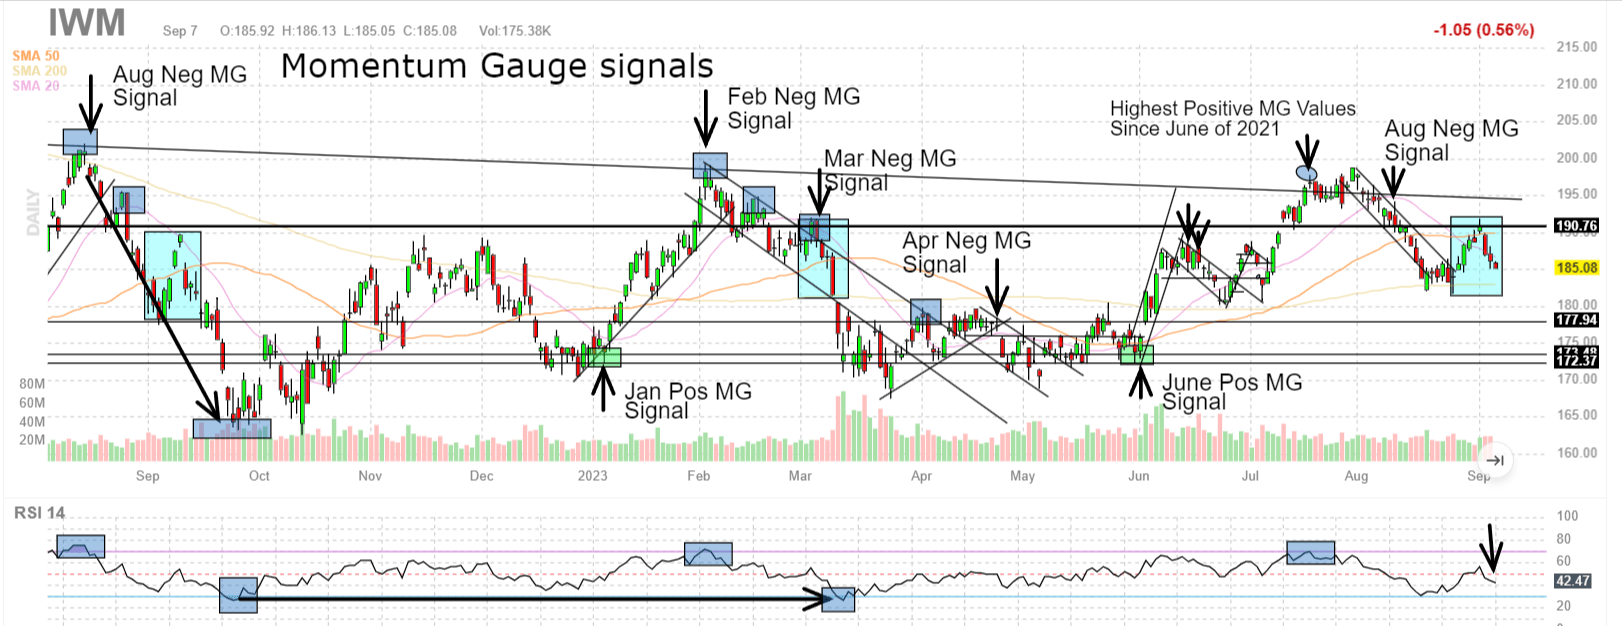
You can see on the Weekly Momentum Gauge chart above how short-lived bear bounces characterized major prior selloffs from last September. This is particularly evident on the daily gauges and on the Russell 2000 index fund ( IWM ) I update daily for comparison to prior market corrections.
You can see the prior patterns from market tops in September and February how a series of bear bounces created lower highs and lower lows in the negative channels. The highlighted blue boxes show how strong the 190/share resistance level continues to be even as we start September with broad negative signals. Support around 178/share is likely to be tested again as it has been numerous times over the past year with potential to reach prior January and June lows as illustrated.
The Nasdaq 100 ( QQQ ) index fund is also showing bearish stair steps or bear bounces in the negative channel from August highs. You can see the pattern of lower highs and lower lows as institutional traders are reducing their market exposure, but allowing intraday rallies to generate more favorable exit price levels into September.
Twitter.com
This is a bearish pattern, and we will see how long it continues to validate the right shoulder of the classic head/shoulder topping pattern on the daily chart shown above.
Record Dollar Highs
Invesco DB US Dollar Index Bullish Fund ( UUP ) is continuing to reach new highs into 2023 in a bearish direction for markets. Since 2017 the dollar has gained every year in September the most frequent month for dollar gains. This also coincides with September averaging the worst month for the S&P 500 ( SPX , SPY ) since 1927.
Cannabis
Last week two of the Week 36 MDA breakout picks were cannabis stocks GrowGeneration ( GRWG ) and Cronos Group ( CRON ) that delivered strong gains despite the Russell 2000 small cap index declining -3.61% in the same period. These gains could continue as momentum builds for federal legalization this year.
The Department of Health and Human Services is formally recommending that the Drug Enforcement Administration ease government restrictions on marijuana, which remains illegal at the federal level even though 40 states allow its use in some form.
The move comes 11 months after President Joe Biden ordered the top health agency to conduct a review of the drug. The recommendation is to move marijuana from what's known as a Schedule I drug to Schedule III, under the Controlled Substances Act. - NBC news.
You can see on the intraday chart of ETFMG Alternative Harvest ETF ( MJ ) the highest trading volumes in over a year as breakout conditions have begun on news of potential policy changes.
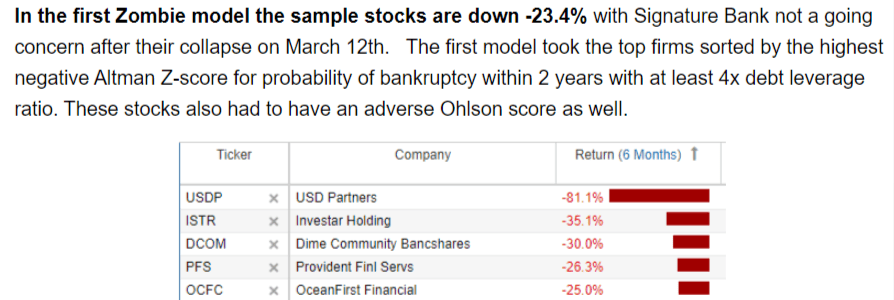
Zombies
This week I published a six-month follow-up study of the performance of the top "zombie" firm portfolio selections released in March . As a reminder, this zombie label was used by the Federal Reserve researchers to assess market risks during the Covid-19 pandemic to determine the level of high risk "firms that haven't produced enough profit to service their debts." As interest rates rise to the highest levels in 22 years and even the U.S. sovereign credit rating has been downgraded for the first time in more than a decade, there may be strong value in continuing to identify the most at-risk stocks for your trading decisions.
Regional banks like ( ISTR ) ( DCOM ) ( PFS ) ( OCFC ) continue to show above average risk levels. Using a combination of the Federal Reserve parameters and the forensic algorithms for bankruptcy risk, the current zombie selections include some well-known names like WeWork ( WE ) and Beyond Meat ( BYND ).
Conclusion
You can find my long-term outlook articles here for 2023 that may carry on well into next year as the Fed has stated that inflation could remain above their 2% target into 2025:
- US Debt Downgrade And Apple Breakdown, Major Catalysts For A Cyclical Pullback .
- Forecasting The S&P 500 For 2023: Year Of The Fed-Pivot And More Record Volatility .
I trust this research, ETF, and stock selections will give you added value to your investment goals and returns in 2023!
JD Henning, PhD, MBA, CFE, CAMS.
For further details see:
September Breakout Report Week 37 - 2023: Topping Signs, Bear Bounces, Record Dollar Highs