SLV - Silver Is Now A Strong Buy - Highest Lease Rates Since 2008
2024-01-03 18:13:58 ET
Summary
- Short-term silver lease rates just reached their highest level since 2008, indicating a physical shortage situation in trading between banks and institutions.
- Short-term premiums for silver futures contracts have consistently been higher than long-term ones since 2022, indicating immediate demand volumes remain robust.
- Previous lease rate spikes have been highly correlated with price bottoms and rising silver quotes over the next 6 to 12 months.
I have been talking about rising implied lease rates (based on futures market pricing and premiums over spot) for both gold and silver as super-bullish developments over the past year. Well, silver in recent days has witnessed another spike to the highest lease rate level since its important 2008 price bottom.
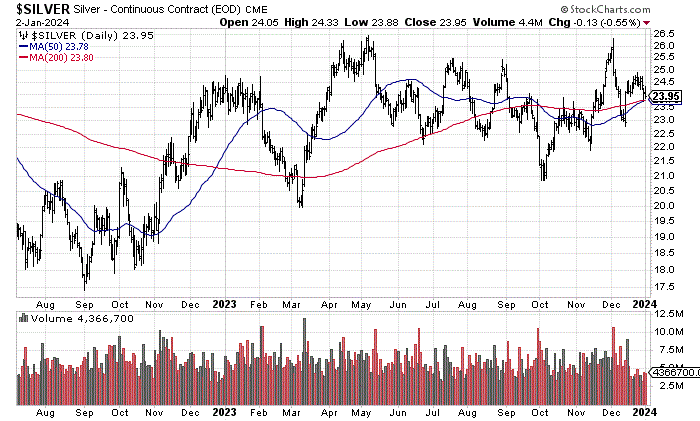
StockCharts.com - Nearby Silver Futures, 18 Months of Daily Price & Volume Changes
The fact shorter-term lease rates are above longer-term ones (an inverted yield curve if you will) is also indicative of a physical shortage situation in trading between banks, institutions, and brokerage houses.
Remember, above-ground easily accessible silver stocks globally are estimated to be worth far less than US$100 billion at today's $24 per ounce quote. Food for thought: the Magnificent 7 , Big Tech names account for nearly $12 trillion in wealth/value in early January. So, even a minor amount of capital movement from the U.S. equity market (valued at $48 trillion in total currently by the Wilshire 5000 index) into poor man's gold could potentially double or triple silver prices overnight in my view.
Bullish Lease Rates
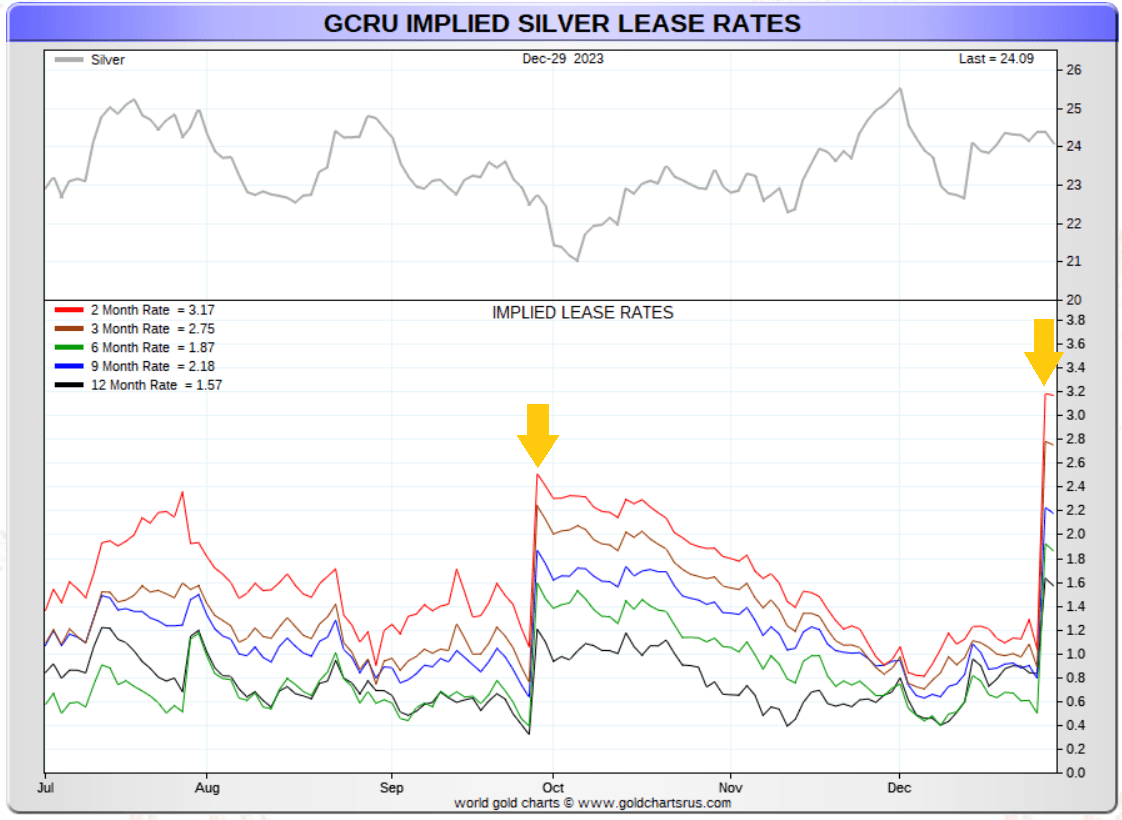
The spike in 2-month lease rates to 3% annualized over the last few trading sessions marks the highest nominal number since the end of 2008. Plus, the rest of the duration curve, 1-year and under, has risen dramatically over just a couple of days. The situation is very similar to the lease rate pattern outlined months ago in September, marked with gold arrows below. While silver continued a downtrend in price for two more weeks into early October, silver did rally +20% from the ultimate quote bottom (and +13% from the initial lease rate spike) into the beginning of December 2023.
GoldChartsRUS.com - Silver, Implied Lease Rates, 6 Months, Author Reference Points
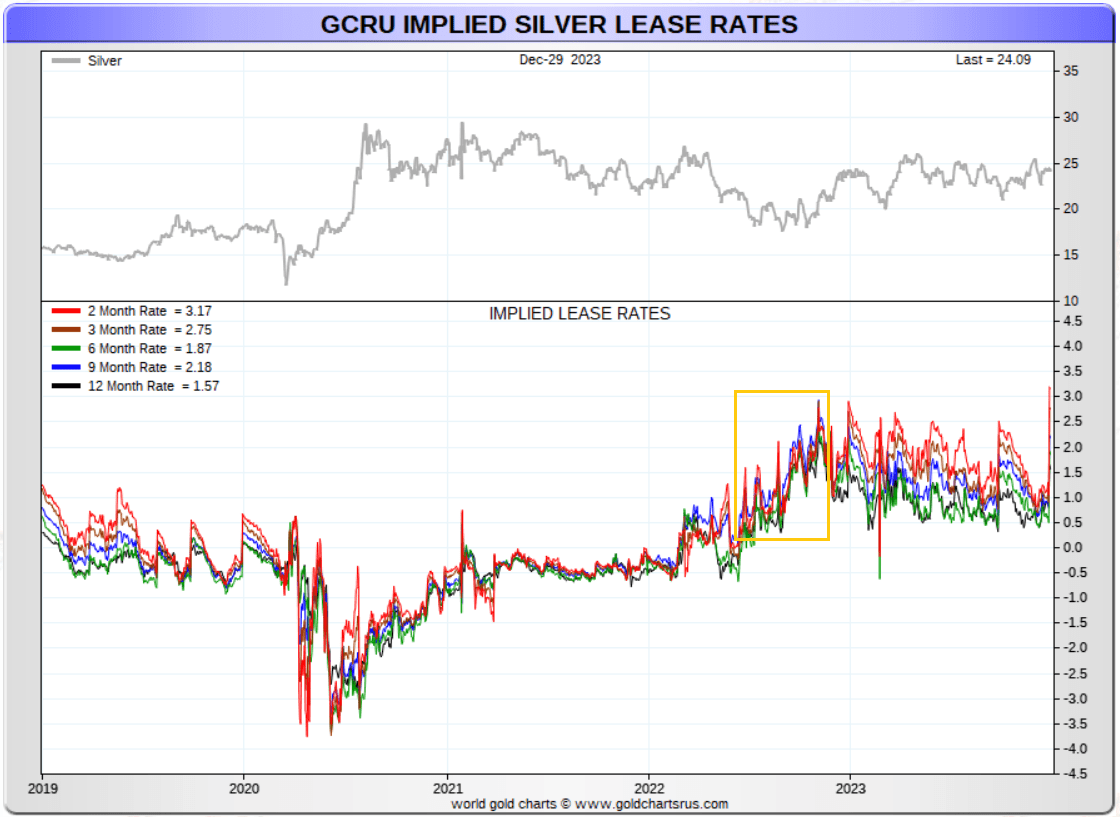
Consistently since late 2022, shorter-term premiums have also been greater in percentage terms than futures contracts further out in time. This setup smacks of a serious shortage situation developing in the physical silver market. The last instance of a prolonged inversion happened during 2018 and early 2019. Afterward, spot silver prices doubled over less than 24 months, measured from the first inversion. The concerted spike in lease rates to multi-year highs during the second half of 2022 is boxed in gold below. This lease-rate buy signal led to a bottom in silver around $17.50 an ounce, leading to the May 2023 high of $26.50.
GoldChartsRUS.com - Silver, Implied Lease Rates, 5 Years, Author Reference Point
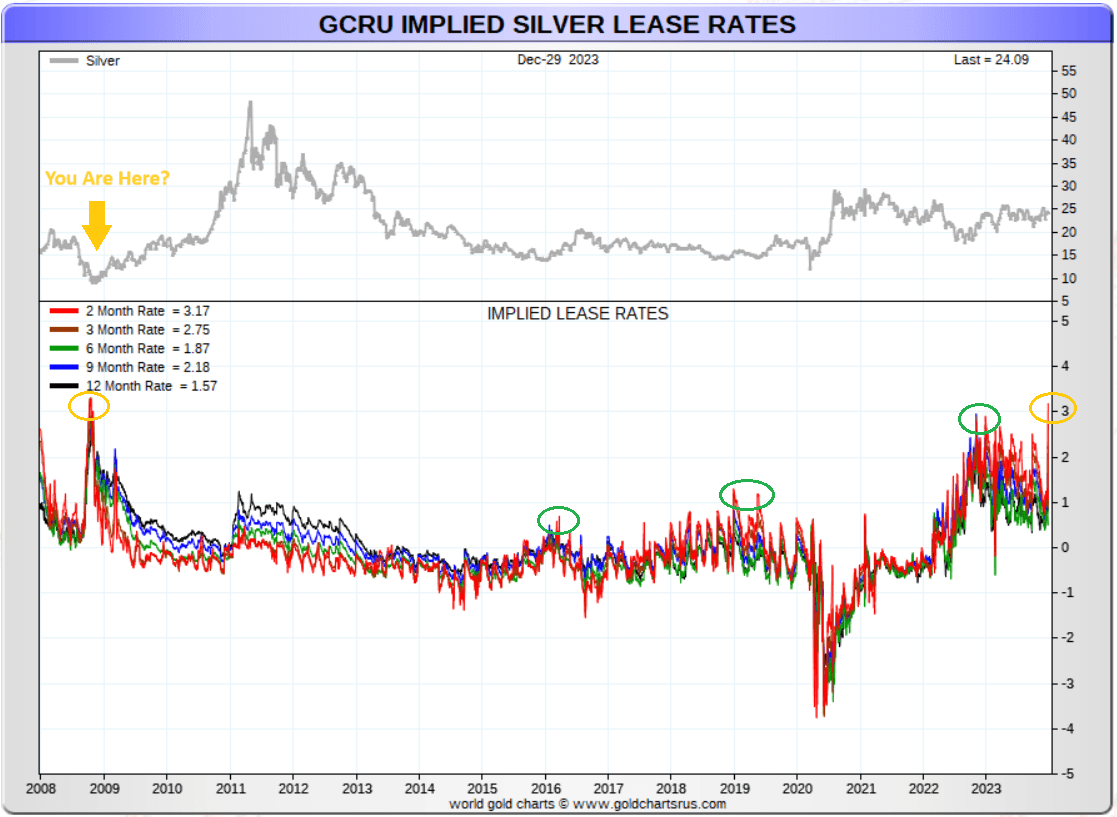
Before late December 2023, "multi-year" highs in lease rates alongside an inverted yield position have taken place four times since 2008. Each was highly correlated with bottoming silver prices. The 2016, 2019, and 2022 setups proved to be very opportunistic trading signals (circled in green below). Perhaps the most relevant situation to compare with today's 3% annual rate for 2-month premiums was the late 2008 buy signal (circled in gold). This period also witnessed an oversized rise to rates above 3%. Within weeks, silver quotes started to climb. Over the next two and a half years, spot silver rose from under $10 an ounce to nearly $50.
GoldChartsRUS.com - Silver, Implied Lease Rates, 16 Years, Author Reference Points
Silver ETFs
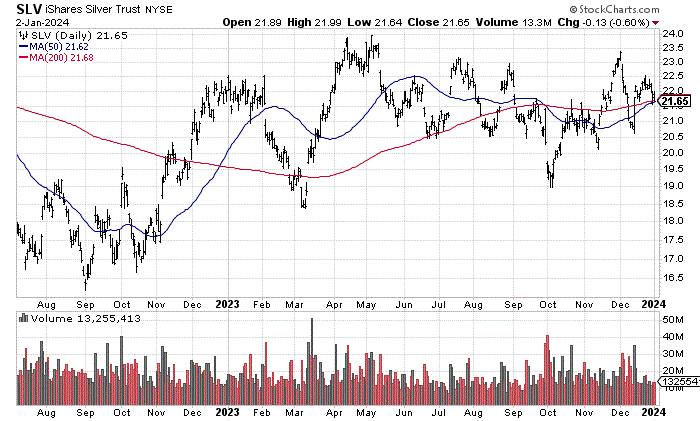
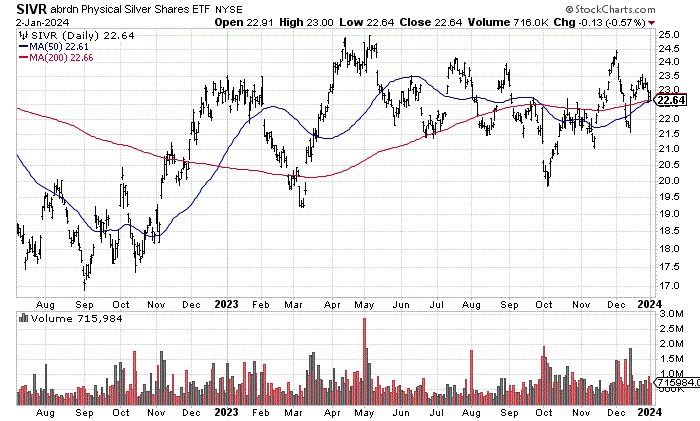
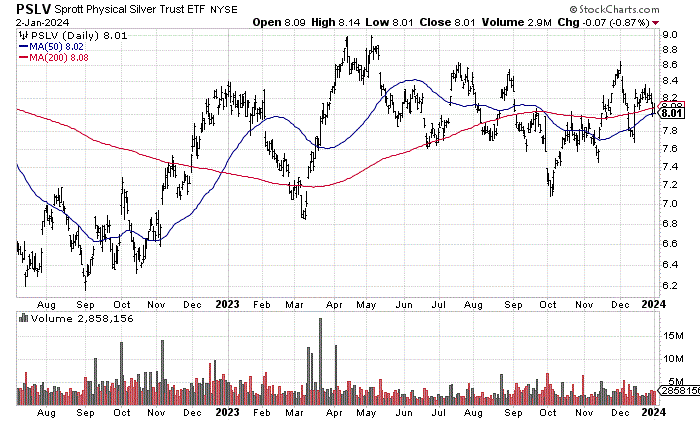
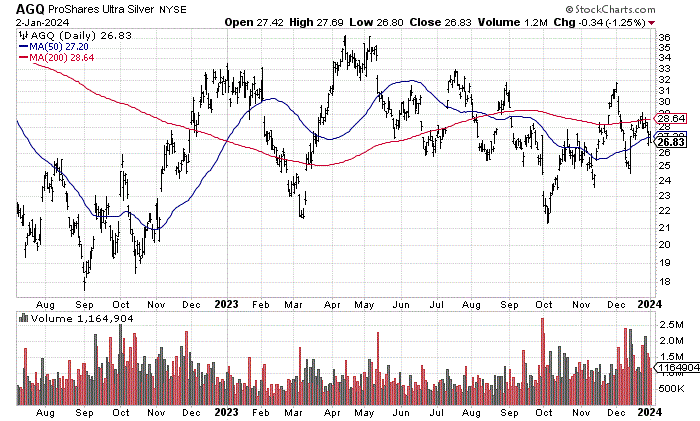
A variety of silver bullion ETFs are worth consideration and ownership today in your brokerage account, in my view. I hold and trade many of them on the long side each month. My favorites include iShares Silver Trust ETF ( SLV ), abrdn Physical Silver Shares ETF ( SIVR ), Sprott Physical Silver Trust ( PSLV ), and for 2x leverage - ProShares Ultra Silver ETF ( AGQ ). Each has a sizable trading volume daily (ample liquidity), large assets under management, and a relatively low annual management expense of under 1%. AGQ carries expanded potential downside risk if silver quotes decline instead of climbing during 2024. However, upside returns can achieve better than the 2x performance goal with its daily rebalance design (which acts to compound money during an extended upswing).
Disclosure: Please consider AGQ is a leveraged ETF, holding not only extra leverage, but forward contracts and swaps with extra rolling costs. AGQ is not a buy-and-hold ETF idea. Historically, AGQ underperforms the silver price over most periods beyond 1 to 2 years. The ProShares website states,
This ProShares ETF seeks daily investment results that correspond, before fees and expenses, to 2x the daily performance of its underlying benchmark (the "Daily Target").
While the Fund has a daily investment objective, you may hold Fund shares for longer than one day if you believe it is consistent with your goals and risk tolerance.
For any holding period other than a day, your return may be higher or lower than the Daily Target. These differences may be significant. Smaller index gains/losses and higher index volatility contribute to returns worse than the Daily Target. Larger index gains/losses and lower index volatility contribute to returns better than the Daily Target.
The more extreme these factors are, the more they occur together, and the longer your holding period while these factors apply, the more your return will tend to deviate. Investors should consider periodically monitoring their geared fund investments in light of their goals and risk tolerance.
StockCharts.com - iShares Silver ETF, 18 Months of Daily Price & Volume Changes StockCharts.com - abrdn Physical Silver ETF, 18 Months of Daily Price & Volume Changes StockCharts.com - Sprott Physical Silver ETF, 18 Months of Daily Price & Volume Changes
StockCharts.com - ProShares Ultra Silver ETF, 18 Months of Daily Price & Volume Changes
Final Thoughts
I am assuming heightened demand for green energy inventions (particularly from solar panel usage) is now supporting the market. Projections of silver demand for industrial products are expected to jump markedly each year over the next decade. Estimates of yearly shortages in mind and recycled supply vs. industrial, jewelry, and investor demand have been running in the 100 to 200 million an ounce range since 2020. Looking at solar industry purchasing trends alone, according to a recent Reuters article in September by Ashitha Shivaprasad ,
Demand for silver from photovoltaic cells [PV], which make up a solar panel, has shown a three-fold growth since 2014 and is expected to reach 161 million ounces in 2023, according to the Silver Institute .
The sector will be responsible for 14% of the total demand for silver this year compared with 5% in 2014.
Demand from the sector could reach 170-180 million ounces if new PV installation exceeds 400 gigawatts [GW] by 2025, said Philip Newman at consultants Metals Focus .
I explained the positive supply/demand dynamics for silver and its incredibly cheap valuation vs. other assets in my last silver article posted in November here . My top valuation-focused silver buy argument is that M2 money supply and Treasury debt growth in America have outstripped the price gains in this critical monetary metal since the 1960s. Using relative valuation averages since 1965, I can argue silver's underlying long-term worth is closer to $40-50 an ounce today. To reach the all-time adjusted highs of early 1980 vs. our money supply trackers, silver would have to trade to $300 or even $400+ per ounce (depending on which data point you are referencing).
YCharts - Silver Price vs. M2 & Treasury Debt Growth, Since 1965
The renewed escalation in lease rates should mean another price advance will begin between now and 8-10 weeks from today, using past patterns and cycles as a guide. My personal view is silver could eclipse $30 an ounce before summertime. Prices closer to $40 are possible if either the Federal Reserve is forced to ease banking policy aggressively to combat a recession or China becomes more belligerent toward Taiwan's political independence.
For sure, a list of geopolitical hot spots could explode into the headlines and cause investors to reevaluate exposure to gold/silver assets in a favorable manner. Other circumstances like spreading war in the Middle East between Israel and its neighbors, a political crisis in the U.S. over the 2024 presidential election, or the appearance of other outlier black swan events would only increase the buying interest in silver.
I rate silver bullion and related ETFs as Strong Buy ideas for long-term holders. In terms of downside risk, even a recession or contraction in money aggregates might prove only short-lived speed bumps. Without a doubt, the Fed would respond to such developments with far greater money printing by the end of the year, eventually supporting a big rise in silver (a pattern similar to the 2020 pandemic-generated recession).
Thanks for reading. Please consider this article a first step in your due diligence process. Consulting with a registered and experienced investment advisor is recommended before making any trade.
For further details see:
Silver Is Now A Strong Buy - Highest Lease Rates Since 2008