JHSC - Small-Cap ETFs: Performance Fundamentals And Rankings For 102 Funds
2024-01-12 10:14:43 ET
Summary
- The following article is my most comprehensive review yet of 102 small-cap ETFs with weighted average market caps up to $8 billion.
- Below, you'll find detailed performance histories and in-depth fundamental analysis covering the profitability, valuation, growth, momentum, and earnings revisions factors.
- You'll be able to quickly see what's worked in the past, what didn't, and how you can leverage Seeking Alpha Factor Grades to identify the best small-cap ETFs.
- I'm hoping readers will enjoy my customizable Small-Cap ETF Rankings workbook, which you'll find a link for below. Simply assign a weight to ten factors, and see which ETFs best match your investment style.
Introduction
In a recent article on the Schwab U.S. Dividend Equity ETF ( SCHD ), I was asked to provide an overview of the small-cap ETF universe. It's a terrific topic, as small-cap stocks offer diversification benefits and often growth potential you might not get without paying a fortune in the large-cap segment. However, there are about 100 ETFs to choose from, and the strategies, track records, and fundamentals widely vary. As with all my ETF reviews, I'll state my opinion on which ones look best, but I will provide you with all the latest performance and fundamental metrics to make an informed decision. In the end, I hope you'll let me know which small-cap ETF you prefer and download my customizable Excel-based rankings system for small-cap funds.
As an introductory note, this analysis is lengthy, covering six key areas: performance, profitability, valuation, growth, momentum, and earnings revisions. Feel free to skip to the section that interests you most (organized by headers and sub-headers) and return to the other sections when you have more time. With that said, let's get started.
Background
Defining A Small-Cap Stock
The definition of small-cap stocks varies, so I've taken a relaxed approach when selecting the ETFs analyzed for this article. For example, S&P Dow Jones Indices considers small-cap stocks to have market capitalizations between $850 million and $5.2 billion. The table below shows the evolution over the last 16-17 years. Note how the maximum figure has more than doubled over the previous four years, reflecting the steep rise in equity values.
S&P Dow Jones Indices
Other Index providers have different rules. For example, the breakpoint between the Russell 1000 Index and the Russell 2000 Index is $2 billion, according to the latest methodology document . The CRSP Indexes tracked by many Vanguard products use dynamic breakpoints with buffer rules to limit turnover, with small-cap stocks falling in the 85-98 percentile by size, according to page 12 of its methodology document .
Then, there are differences between ETF providers. Some providers use ranges between $100 million and $5 billion to define a small-cap stock. Others have $10 billion maximums. The point is there are no hard and fast rules providers, analysts, or investors need to abide by. Instead, it helps to have a comprehensive understanding of the entire U.S. Equity ETF universe, which is why I've built my database that way and make all calculations myself. For ETFs with a small-cap focus per FactSet, the weighted average market capitalizations range from $800 million to $8.09 billion. The range for mid-cap ETFs is $6.24 billion to $32.64 billion, including 17 with market caps below $8.09 billion. I've added these to the analysis to be on the safe side.
Identifying The Small-Cap ETF Universe
With 85 small-cap ETFs and 17 mid-cap ETFs with a market cap below $8.09 billion, I will analyze 102 funds today. They are listed and ordered by ticker below, so feel free to have a quick scan and make a note of any I missed.
- First Trust Active Factor Small Cap ETF ( AFSM )
- Avantis U.S. Small Cap Equity ETF ( AVSC )
- Avantis U.S. Small Cap Value Fund ( AVUV )
- JPMorgan BetaBuilders US Mid Cap Equity ETF ( BBMC )
- JPMorgan BetaBuilders US Small Cap Equity ETF ( BBSC )
- BNY Mellon US Small Cap Core Equity ETF ( BKSE )
- EA Bridgeway Omni Small Cap Value ETF ( BSVO )
- Pacer US Small Cap Cash Cows Growth Leaders ETF ( CAFG )
- Pacer US Small Cap Cash Cows 100 ETF ( CALF )
- VictoryShares US Small Cap Vol. Wtd. ETF ( CSA )
- VictoryShares US Small Cap High Dividend Vol. Wtd. ETF ( CSB )
- VictoryShares US Discovery Enhanced Vol. Wtd. ETF ( CSF )
- IQ Chaikin U.S. Small Cap ETF ( CSML )
- WisdomTree SmallCap Dividend ETF ( DES )
- Dimensional U.S. Small Cap ETF ( DFAS )
- Dimensional U.S. Small Cap Value ETF ( DFSV )
- WisdomTree U.S. SmallCap Quality Dividend Growth Fund ( DGRS )
- Invesco Dorsey Wright SmallCap Momentum ETF ( DWAS )
- WisdomTree U.S. SmallCap Fund ( EES )
- SPDR S&P SmallCap 600 ESG ETF ( ESIX )
- iShares ESG MSCI USA Small-Cap ETF ( ESML )
- WisdomTree MidCap Earnings ETF ( EZM )
- Franklin LibertyQ U.S. Small Cap Equity ETF ( FLQS )
- Schwab Fundamental U.S. Small Company Index ETF ( FNDA )
- First Trust Mid Cap Value AlphaDEX ETF ( FNK )
- First Trust Mid Cap Core AlphaDEX ETF ( FNX )
- First Trust Mid Cap Growth AlphaDEX Fund ( FNY )
- First Trust Small Cap Growth AlphaDEX Fund ( FYC )
- First Trust Small Cap Value AlphaDEX Fund ( FYT )
- First Trust Small Cap Core AlphaDEX Fund ( FYX )
- Inspire Faithway Mid Cap Momentum ESG ETF ( GLRY )
- Goldman Sachs ActiveBeta U.S. Small Cap Equity ETF ( GSSC )
- Harbor Human Capital Factor US Small Cap ETF ( HAPS )
- iShares S&P Mid-Cap 400 Value ETF ( IJJ )
- iShares Core S&P Small-Cap ETF ( IJR )
- iShares S&P Small-Cap 600 Value ETF ( IJS )
- iShares S&P Small-Cap 600 Growth ETF ( IJT )
- iShares Morningstar Small-Cap ETF ( ISCB )
- iShares Morningstar Small-Cap Growth ETF ( ISCG )
- iShares Morningstar Small-Cap Value ETF ( ISCV )
- Vanguard S&P Mid-Cap 400 Value ETF ( IVOV )
- iShares Russell 2000 ETF ( IWM )
- iShares Russell 2000 Value ETF ( IWN )
- iShares Russell 2000 Growth ETF ( IWO )
- John Hancock Multifactor Small Cap ETF ( JHSC )
- JPMorgan Diversified Return U.S. Small Cap Equity ETF ( JPSE )
- JPMorgan Active Small Cap Value ETF ( JPSV )
- Janus Henderson Small Cap Growth Alpha ETF ( JSML )
- SPDR S&P 400 Mid Cap Value ETF ( MDYV )
- Xtrackers S&P MidCap 400 ESG ETF ( MIDE )
- First Trust Multi-Manager Small Cap Opportunities ETF ( MMSC )
- Nuveen ESG Small-Cap ETF ( NUSC )
- Invesco Russell 2000 Dynamic Multifactor ETF ( OMFS )
- Opus Small Cap Value Plus ETF ( OSCV )
- O'Shares US Small-Cap Quality Dividend ETF ( OUSM )
- Principal U.S. Small-Cap Multi-Factor ETF ( PSC )
- Invesco S&P SmallCap 600 QVM Multi-Factor ETF ( QVMS )
- ProShares S&P MidCap 400 Dividend Aristocrats ETF ( REGL )
- Invesco S&P MidCap 400 Pure Value ETF ( RFV )
- First Trust Mid Cap US Equity Select ETF ( RNMC )
- First Trust Small Cap US Equity Select ETF ( RNSC )
- Hartford Multifactor Small Cap ETF ( ROSC )
- Invesco S&P SmallCap 600 Revenue ETF ( RWJ )
- Invesco S&P MidCap 400 Revenue ETF ( RWK )
- Invesco S&P SmallCap 600 Pure Growth ETF ( RZG )
- Invesco S&P SmallCap 600 Pure Value ETF ( RZV )
- Schwab U.S. Small-Cap ETF ( SCHA )
- ETC 6 Meridian Small Cap Equity ETF ( SIXS )
- SPDR S&P 600 Small Cap Growth ETF ( SLYG )
- SPDR S&P 600 Small Cap Value ETF ( SLYV )
- AlphaMark Actively Managed Small Cap ETF ( SMCP )
- ProShares Russell 2000 Dividend Growers ETF ( SMDV )
- Syntax Stratified MidCap ETF ( SMDY )
- Xtrackers S&P SmallCap 600 ESG ETF ( SMLE )
- iShares MSCI Multifactor USA Small-Cap ETF ( SMLF )
- SPDR SSGA US Small Cap Low Volatility ETF ( SMLV )
- iShares MSCI Min. Vol. USA Small-Cap ETF ( SMMV )
- SPDR S&P 600 Small Cap ETF ( SPSM )
- Legg Mason Small-Cap Quality Value ETF ( SQLV )
- Syntax Stratified SmallCap ETF ( SSLY )
- Strive Small-Cap ETF ( STXK )
- iShares US Small Cap Value Factor ETF ( SVAL )
- Motley Fool Small-Cap Growth ETF ( TMFS )
- Timothy Plan US Small Cap Core ETF ( TPSC )
- VictoryShares US Small Mid Cap Value Momentum ETF ( USVM )
- Vanguard Small Cap ETF ( VB )
- Vanguard Small Cap Growth ETF ( VBK )
- Vanguard Small Cap Value ETF ( VBR )
- Vanguard S&P Small-Cap 600 Growth ETF ( VIOG )
- Vanguard S&P Small-Cap 600 ETF ( VIOO )
- Vanguard S&P Small-Cap 600 Value ETF ( VIOV )
- Vanguard Russell 2000 Growth ETF ( VTWG )
- Vanguard Russell 2000 ETF ( VTWO )
- Vanguard Russell 2000 Value ETF ( VTWV )
- iShares ESG Screened S&P Small-Cap ETF ( XJR )
- Invesco S&P MidCap Low Volatility ETF ( XMLV )
- Invesco Russell MidCap Pure Value ETF ( XMVM )
- Invesco S&P SmallCap High Dividend Low Volatility ETF ( XSHD )
- Invesco S&P SmallCap Quality ETF ( XSHQ )
- Invesco S&P SmallCap Low Volatility ETF ( XSLV)
- Invesco S&P SmallCap Momentum ETF ( XSMO )
- Invesco S&P SmallCap Value With Momentum ETF ( XSVM )
You may find this list intimidating, but I will sort it out appropriately as we progress. To begin, it's helpful to know these statistics:
- 77/102 (75%) have a five-year track record
- 49/102 (48%) have a ten-year track record
- 30/102 (29%) have assets above $1 billion
- 23/102 (23%) have a ten-year track record and assets above $1 billion
Furthermore, many of these 23 ETFs track the same Index. For instance, IWM and VTWO track the Russell 2000 Index. IJR tracks the S&P SmallCap 600 Index, as does SPSM and VIOO. IJJ and MDYV are "duplicates," as are IJT/SLYG and IJS/SLYV/VIOV. We've quickly narrowed the list to 16 ETFs for those valuing size and longevity. Let's see if we can do the same for those preferring strong historical performance next.
Small-Cap ETF Historical Returns
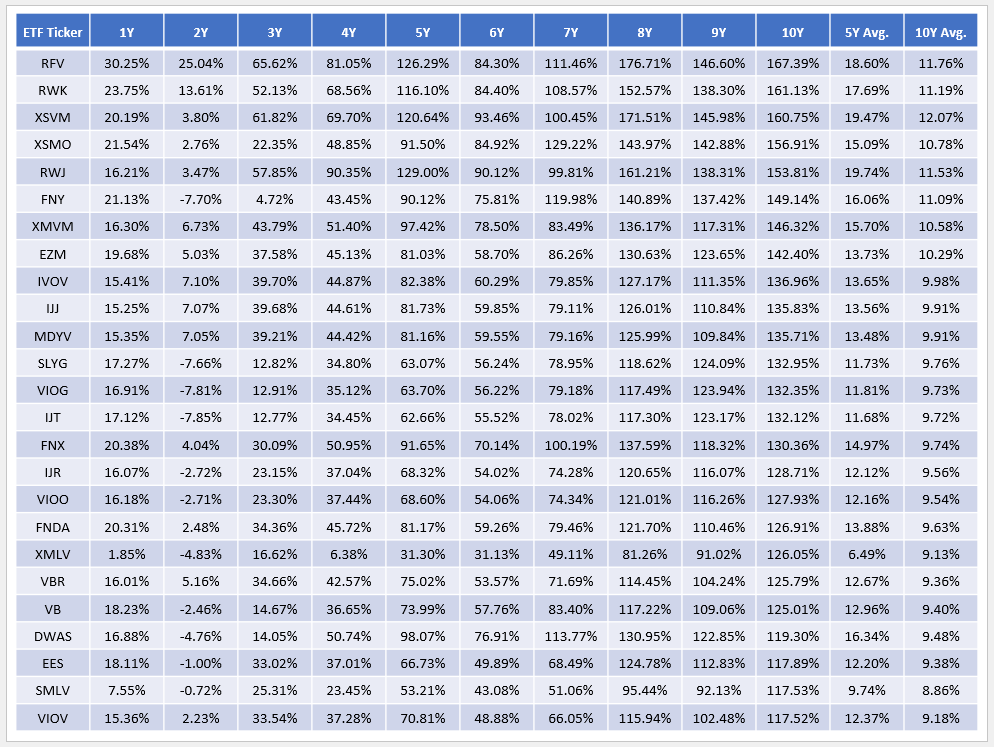
For this section, I included annualized 1-10Y returns and average five- and ten-year returns to help you assess if there is skewness in the performance chart. Let's start with the top performers.
As shown, the Invesco S&P MidCap 400 Pure Value ETF ( RFV ) was the top performer with a 167.39% total return between 2014-2023, sourced here from Portfolio Visualizer. RFV also performed well, but these are high on the market cap scale, with sizes of $6.24 billion and $7.88 billion. Among the "true" small-cap funds, Invesco's XSVM and XSMO gained 160.75% and 156.91%, respectively. Momentum is the common theme here, and for those wondering about the factor's predictive qualities, you'll enjoy this excellent piece by Zachary Marx of Seeking Alpha's Quant Team. Remember this factor because my ETF database leverages Seeking Alpha's Quant Ratings for individual stocks and expands on its rating system for ETFs that cover expenses, dividends, risk, and liquidity.
The above table includes each ETF's average five- and ten-year return. This differs from the compounded total returns figures and may be more valuable. The reason is that some ETFs have one good year, attract new investors who rely heavily on historical performance, and then underperform. A perfect example is the Invesco S&P MidCap Low Volatility ETF ( XMLV ), which was the #1 ranked fund in this sample in 2014 (18.34%) and 2015 (5.39%). Heading into 2023, its ten-year annualized return matched the SPDR S&P MidCap 400 ETF ( MDY ), and it experienced less volatility, so it seemed like a no-brainer.
But in 2023, it lagged MDY by 13.87% and ranked #96/98 ETFs (four were launched mid-year). As a result, I recommend you use both sets of statistics. Look for a good record, but also consider consistency.
This first chart covered ETFs ranked 1-25 on ten-year returns and included some of the most popular funds like the iShares Core S&P Small-Cap ETF ( IJR ), the Vanguard Small Cap ETF ( VB ), and the Vanguard Small Cap Value ETF ( VBR ). One reason for their popularity is their low expense ratios (0.06%, 0.05%, 0.07%), and while keeping costs down is important, other characteristics like momentum appear more valuable.
Next, let's look at ETFs ranked 26-50 on ten-year returns. You'll find some more obscure ETFs here, but the ones I want to highlight select stocks from the Russell 2000. They include VTVO, IWO, VTWG, IWM, VTWV, and IWN.
These six ETFs rank #37, #38, #39, #40, #43, and #46 out of 49 with a ten-year history. Evidently, the Russell 2000 Index is a pretty easy benchmark to beat, and it's no coincidence that many ETF providers use it in their marketing materials. I will discuss the reasons for this Index's poor performance later, and without giving too much away, I can hint that it's quality-related.
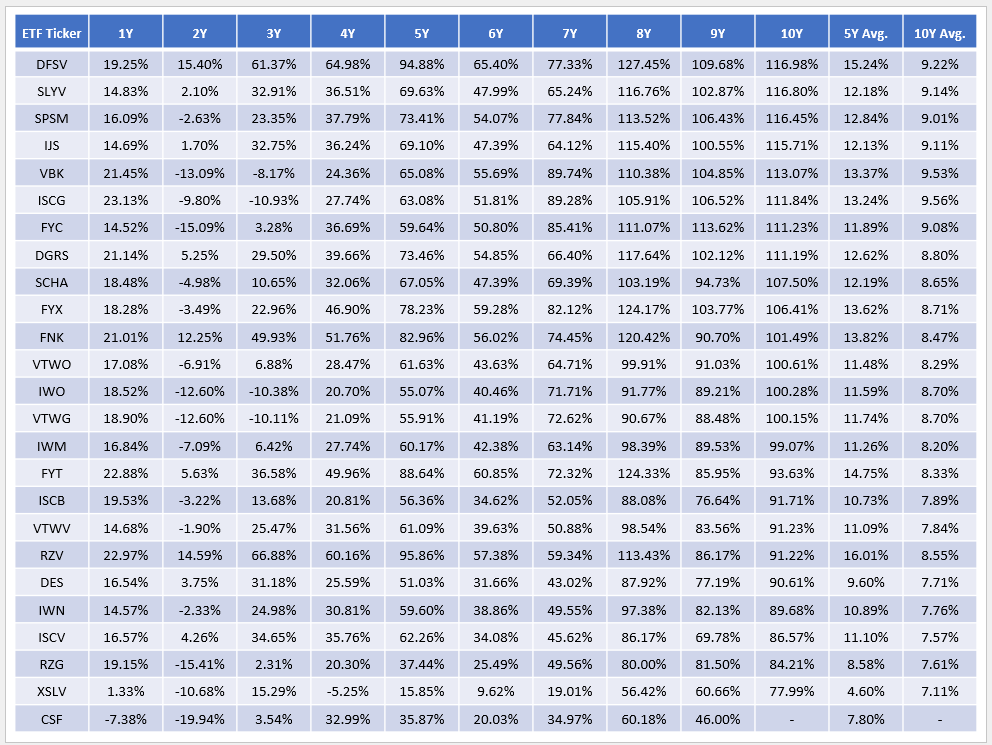
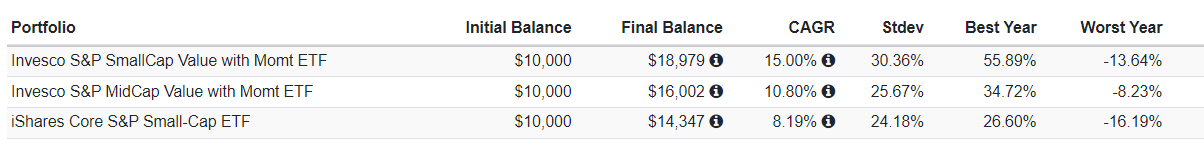
The following table includes ETFs that do not have a ten-year history. I've ordered them based on their total returns for the longest period available, but I think you'll get the most value by analyzing the five-year average return column. The average for all ETFs is 12.58%, and 12/25 ETFs on this list performed better. The standout is the Pacer US Small Cap Cash Cows 100 ETF ( CALF ), with an 18.49% average annual return between 2019-2023, including 35.44% last year. The Motley Fool Small Cap Growth ETF ( TMFS ) also has impressive results, but it's also quite volatile, ranking #1, #1, and #4 in 2019, 2020, and 2023, but #89 and #95 in 2021 and 2022.
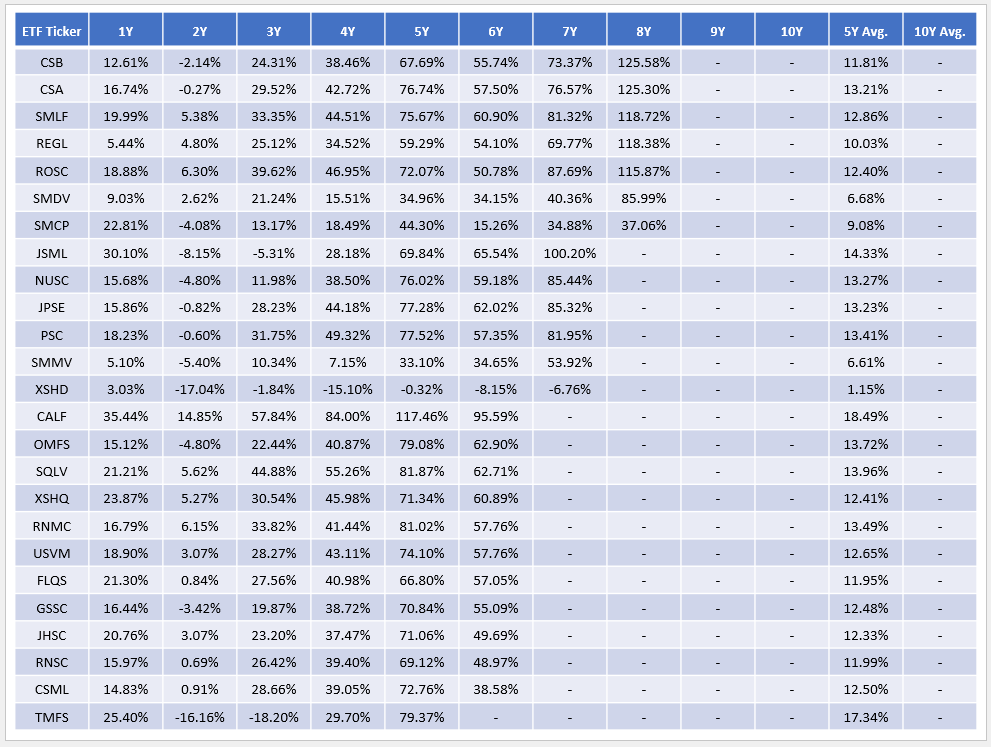
Finally, the last table includes ETFs 76-98. The four ETFs excluded, which launched in 2023, were the Harbor Human Capital Factor US Small Cap ETF ( HAPS ), the JPMorgan Active Small Cap Value ETF ( JPSV ), the Pacer US Small Cap Cash Cows Growth Leaders ETF ( CAFG ), and the EA Bridgeway Omni Small-Cap Value ETF ( BSVO ).
Although its track record is limited, the Avantis US Small Cap Value ETF ( AVUV ) averaged a 20.05% return between 2021 and 2023 and gained 76.75% between 2020 and 2023. That ranks #4/80 for those with a four-year track record, and I think the strategy is sound for what it's worth. You can read my latest review here .
Small Cap ETF Fundamentals
The purpose of fundamental analysis is to remove all emotion from your investment decisions. While that sounds good in theory, it's almost impossible to do in practice. Everyone has their fair share of emotional and cognitive biases that can negatively influence their investment decisions, and I'm no exception. Investors must also consider their objectives and risk tolerances. For example, if you're saving for a down payment to purchase a home in the next five years, it's not responsible to buy a highly volatile ETF, even if its fundamentals look great.
In this section, I won't try to persuade you that a particular style (growth or value) is superior because that depends on factors beyond my control. However, I will try to convince you that quality matters, no matter your style.
Profitability
Many of you are familiar with Seeking Alpha Factor Grades, which assess a company's valuation, growth, profitability, momentum, and earnings revisions. The grades for Apple ( AAPL ) are below, indicating that it's a highly profitable stock with valuation problems.
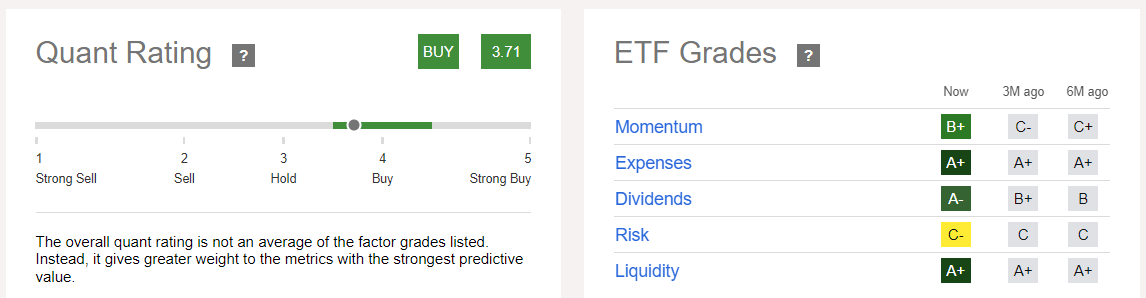
A different system is used for ETFs, grading them by momentum, expenses, dividends, risk, and liquidity. As shown below, IJR is rated a buy due to its low expense ratio and high liquidity compared to other small-cap ETFs.
Still, it would be great to know how "profitable" an ETF is. After all, an ETF is just a basket of securities, so the calculation is possible as long as we have each security's profitability grade and their weighting in the ETF. I've done that for nearly 1,000 U.S. Equity ETFs and normalized the grades on a ten-point scale. With this data, I've drawn some interesting conclusions.
Let's start with the 49 ETFs with a ten-year history. I've slotted them into five buckets by performance and calculated the average profit score per group:
- ETFs 1-10: 6.44/10
- ETFs 11-20: 6.53/10
- ETFs 21-30: 6.04/10
- ETFs 31-40: 5.99/10
- ETFs 41-49: 6.05/10
Generally, if you're looking for above-average performance over the long run, it's best to choose small-cap ETFs that are more profitable. Of course, there are exceptions, like the 7.22/10 profit score for the #47/49 ranked Invesco S&P SmallCap 600 Pure Growth ETF ( RZG ), but this only highlights how other factors matter too. I don't mean to pick on RZG, but its 1.39 five-year beta likely explains why it lost 29% in 2022 and 35% in Q1 2020.
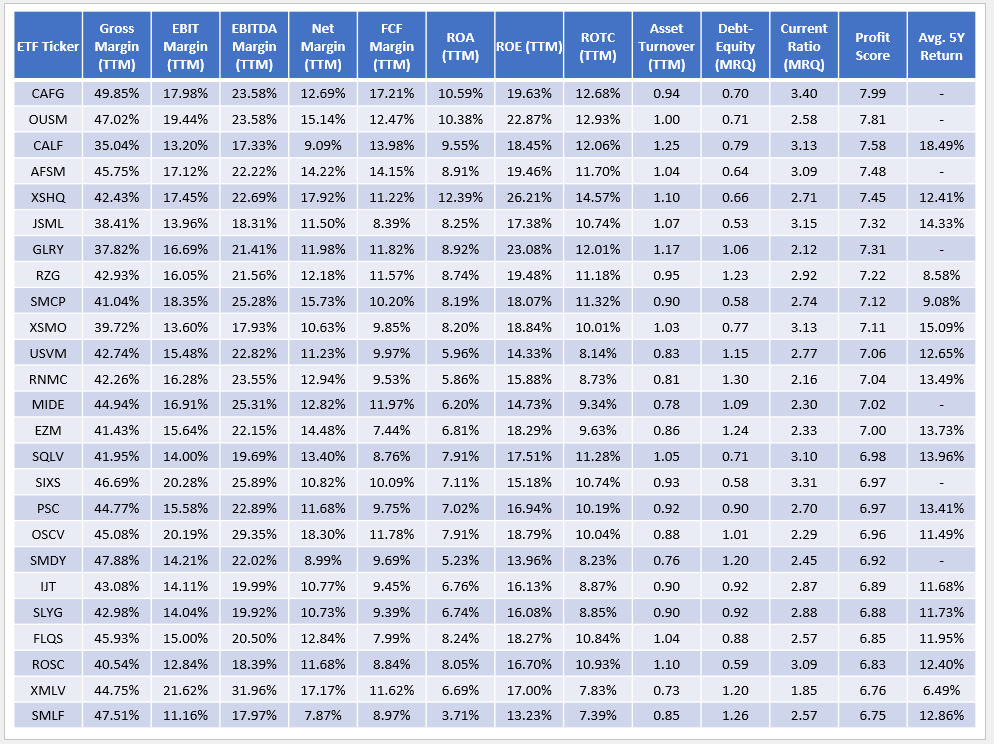
The following table highlights the 25 small-cap ETFs with the best profit scores. Included are supplementary metrics like gross profit margins, free cash flow margins, return on total capital, and asset turnover, which give you some background on the underlying statistics that drive these scores. My calculation method is a weighted average one that controls for outliers.
As shown, two Pacer ETFs (CAFG and CALF) are two of the most profitable small-cap ETFs. The firm's products typically hold securities with high free flow yields, which combine quality and value into a single metric. COWZ, BUL, and COWG follow a similar strategy and have 9.19/10, 9.19/10, and 9.31/10 profit scores. This analysis doesn't include them because they cover the large- and total-market segments. Still, Pacer has carved itself a nice niche in the ETF space, and providers like VictoryShares, Global X, and Amplify have launched competing products ( VFLO , FLOW , COWS ) recently to try to piggyback off Pacer's success. While free cash flow yield isn't in the table above, you can see that CAFG and CALF offer high free cash flow margins of 17.21% and 13.98% compared to the sample's 7.43% average. Return on total capital figures are equally impressive - 12.68% and 12.06% vs. the sample's 7.18% average.
Besides CALF, the only other ETFs with assets under management above $1 billion on this list are the iShares S&P Small-Cap 600 Growth ETF ( IJT ) and the SPDR S&P 600 Small Cap Growth ETF ( SLYG ). Since they track the same Index, their metrics are virtually identical. After that, we'd have to turn to the next page to find the S&P SmallCap 600 Index offerings for small-cap value, blend, and growth. For example, VBR, VB, and VBK have similar profit scores of 6.55/10, 6.61/10, and 6.69/10, starkly contrasting how the S&P 500 Index is segmented by style. Last month's reconstitution resulted in a profit score of 8.99/10 for the SPDR S&P 500 Value ETF ( SPYV ) and 9.77/10 for the SPDR S&P 500 Growth ETF ( SPYG ). Therefore, one key takeaway is to treat small-cap value and growth stocks as equals, whereas, for large-cap stocks, the growth segment has a clear edge on profitability.
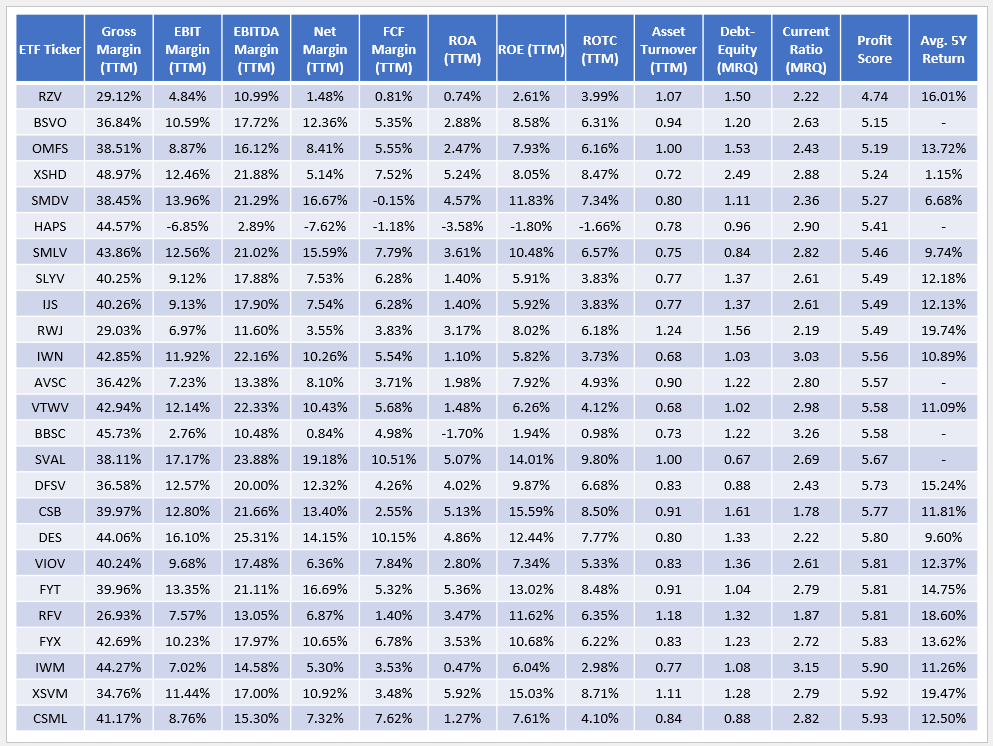
Equally interesting is a list of the 25 least profitable small-cap ETFs. I'm not suggesting you downright avoid these funds because there's more to investing than simply buying the most profitable companies. Instead, I ask that you try to get something in return for the quality sacrifice, such as low volatility, cheap valuation, or strong growth and momentum characteristics.
The Invesco S&P SmallCap 600 Pure Value ETF ( RZV ) looks weak on profitability. Its holdings' gross margin is only 29.12%, which doesn't provide much wiggle room to earn a profit. Return on total capital is just 3.99%, and free cash flow margins barely break even. However, it delivered an average 16.01% annual return over the last five years, including a 45.63% gain in 2021, so there's clearly more to it. Without jumping too far ahead, I want to provide this high-level comparison with SPSM, SLYV, and SLYG, which are S&P Small600 Value, Blend, and Growth ETFs.
The Sunday Investor
The standout metric is RZV's 7.79/10 value score, and, notably, RZV looks terrible on virtually every other metric. However, other deeply-discounted ETFs like Invesco S&P SmallCap High Dividend Low Volatility ETF ( XSHD ) didn't fare so well over the last five years. I haven't studied why, but through analysis of large-cap ETFs like SPHD and LVHD , I've determined that the dividend and low volatility factors don't mesh. I recommend you approach these funds with a healthy dose of skepticism and look for red flags like XSHD's 7.82% dividend yield. Small-cap stocks that can pay that much should probably have more than 5% net margins, so it seems like a classic yield trap.
Valuation
Seeking Alpha Value Grades assess metrics like a company's price ratios and dividend yield. It's pretty comprehensive, and although the metrics aren't equal-weighted, I believe the system places a cap on the value grade if a particular metric ranks poorly. That appears to be the case with Apple ( AAPL ), as even though the metrics seem to average around a "D," it still receives an overall "F," presumably due to its grades on TTM PEG GAAP, TTM Price/Book, and FWD Price/Book.
When adjusting grades on a ten-point scale, Apple receives a "1", and the score increases in 0.75-point increments so that stocks with an "A+" grade receive a score of 10. It's a simple scale, allowing me to quickly identify the top value ETFs. I've listed the top 25 below.
I've already touched on RZV, XSHD, and CALF, but seeing the Avantis U.S. Small Cap Value ( AVUV ) on the list at #13 is nice. Recall how it was the #4 ranked ETF among those with a four-year history, and metrics like a 13.20x forward earnings ratio are why. Its 6.16/10 profit score could be better (#67/102), but it's also only a bit below average, and I like funds that score well on numerous factors. This approach acknowledges that I am unsure which factors the markets will favor next, but I can increase my odds of success by considering multiple factors.
Speaking of ETFs that combine the profitability and value factors well, there's CALF again, ranking #7 on the list with a 6.53/10 profit score. Not far behind is XMVM, a mid-cap value fund with a $7.02 billion weighted average market cap. XMVM has done almost as well as its small-cap counterpart over the last five years, so unlike the dividend/volatility factors, the value/momentum factors work well together. I will caution that the underlying Index for these ETFs changed on June 21, 2019, but performance after that was still solid.
Next, I want to present the 25 lowest-ranked small-cap ETFs by value. While seeing many small-cap growth names makes sense, you might be surprised to find OUSM and REGL, two dividend-focused ETFs, on this list. Their gross dividend yields are 2.00% and 2.71%, but after expenses, they are more like 1.52% and 2.31%.
The valuations on these ETFs are incredibly high, and they sound even worse when you realize that only the profitable ones are included in the calculation. Morningstar uses a harmonic weighted-average method (compared to my simple weighted-average method), and here's how they handle non-profitable stocks and outliers.
The 60 cap for P/E is reasonable and is what I use too, considering only 7% of profitable U.S. securities exceed that ratio. However, the 50% threshold is low, which makes evaluating valuation alongside profitability crucial. In other words, ETFs with only 50% of holdings included in the calculation have the potential to deceive investors, but if you knew the overall profitability of the fund, you'd know to take it with a grain of salt. That's why I included the profit and value scores above.
Let's use the iShares Russell 2000 Growth ETF ( IWO ) as an example, as it has a relatively weak 6.25/10 profit score and is also popular, with $10.61 billion in assets under management. It trades at 26.46x forward earnings, or 18.77x, using the harmonic weighted-average method (similar to Morningstar's 18.83x figure below).
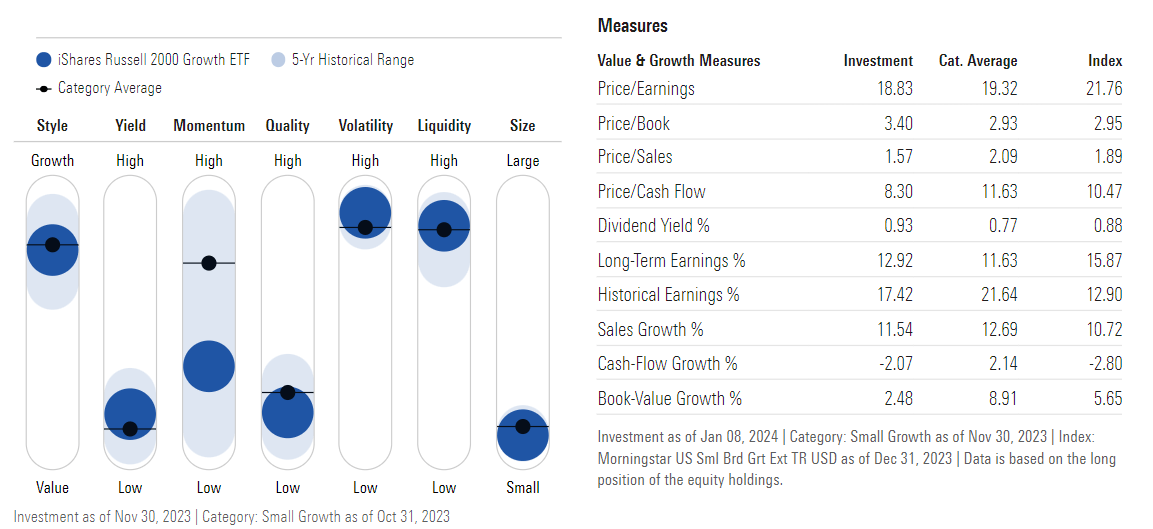
However, this valuation is deceptively low without knowing the following:
- There are approximately 1,060 equities in the ETF
- 473 (31.60% by weight) didn't turn a profit last year (i.e., have no P/E)
- 95 (11.73% by weight) have TTM P/E's above 60
- 448 (24.91% by weight) aren't expected to turn a profit this year
- 56 (9.07% by weight) have FWD P/E's above 60
So, on a forward basis, 25% of the portfolio isn't included in the calculation, and an additional 9% had their ratio capped. There are a couple of ways to deal with this, but I suggest "punishing" the 25% non-profitable stocks by applying the cap and including them in the calculation. When I do this, the weighted average and harmonic forward P/E increase to 35.02x and 22.66x. Suddenly, IWO doesn't seem so cheap.
That's the mathematical way, but recognizing that most readers won't make these calculations, I suggest referring to the "Quality" scale in the image above. IWO is listed as low-quality, and that's your first clue that the ETF's valuation ratios may be deceiving.
Growth
While ETFs like IWO score poorly on value, they do much better on growth. That's the most common tradeoff, but occasionally, you will find funds that do well on both. Among small-cap ETFs, CAFG is ranked #37 on value and #19 on growth. FYX and SMCP also rank in the top 40 on both scores, and the First Trust Active Factor Small Cap ETF ( AFSM ) managers prefer this mix, at least currently. Its value/growth scores of 5.61/5.71 rank inside the top quartile. AFSM has slightly outperformed IJR three years in, but its 0.75% expense ratio has limited its AUM to just $4 million, and it's hard to imagine the fund surviving much longer.
As for other small-cap ETFs, I've listed the top 25 by growth score below, alongside the underlying growth rates that support each score.
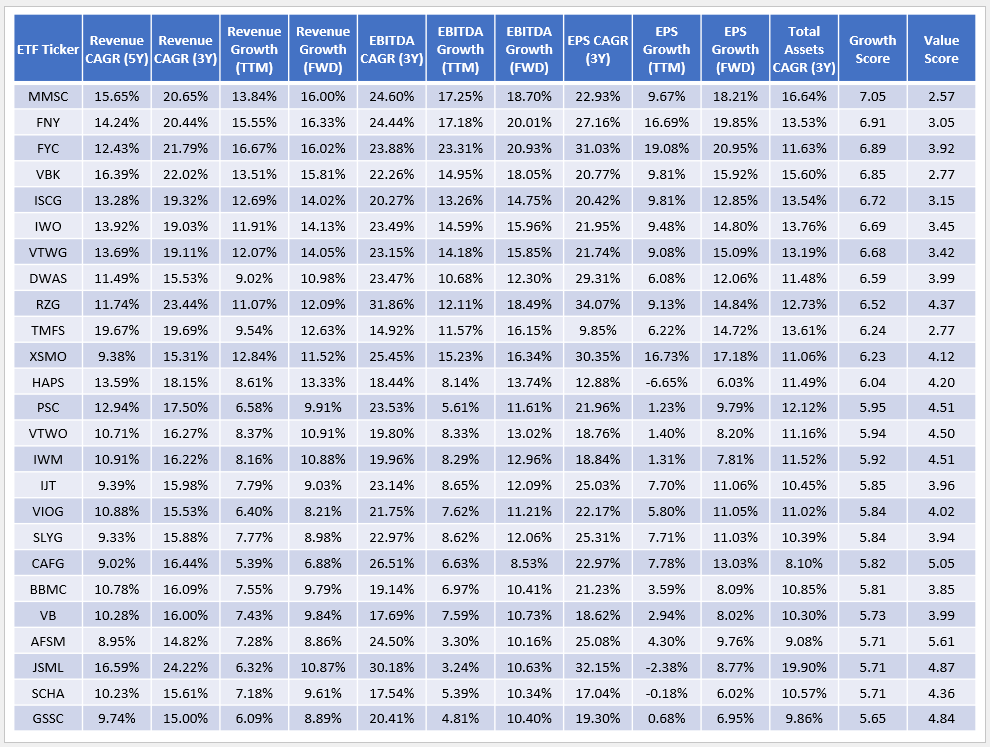
As mentioned, most of the poorly-ranked value ETFs are on this list, including IWO. You can also see most have forward EBITDA and EPS growth rates ahead of their three-year historical rates, which is a good sign because growth is hard to come by in the current market. I want to highlight how the Vanguard Growth ETF ( VUG ), which covers the large-cap growth segment, has a 12.98% estimated EPS growth rate and a 6.33/10 growth score, while VBK's growth rate and score are 15.92% and 6.85/10. This illustrates why one would venture into the small-cap growth ETF arena - these funds can offer incredible potential and diversification benefits for most investors.
Momentum / Earnings Revisions
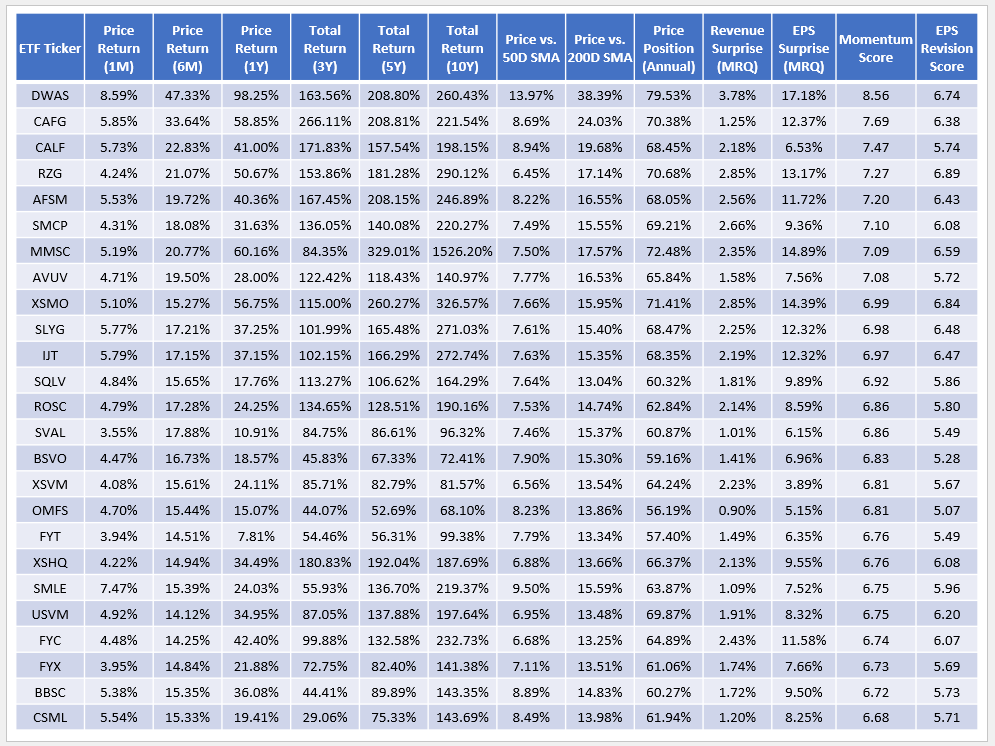
Earlier in this article, I hinted that momentum was an influential predictive factor. Zachary Marx explained it well with his article, and XSVM and XSMO were among the top-performing small-cap ETFs. The Seeking Alpha Quant Team has realized this too and revealed a "secret" in an October 2023 webinar : the system double-weights the momentum and value factors.
The momentum factor is a factor in Seeking Alpha's ETF Quant Rating system, but I don't think it works as well because ETFs are dynamic products. For example, consider an ETF like the SPDR S&P 500 High Dividend ETF ( SPYD ), which selects the 80 highest-yielding securities in the S&P 500. Since yield and price are inversely correlated, the strategy, by definition, is to select stocks with poor price momentum twice annually at the end of January and July.
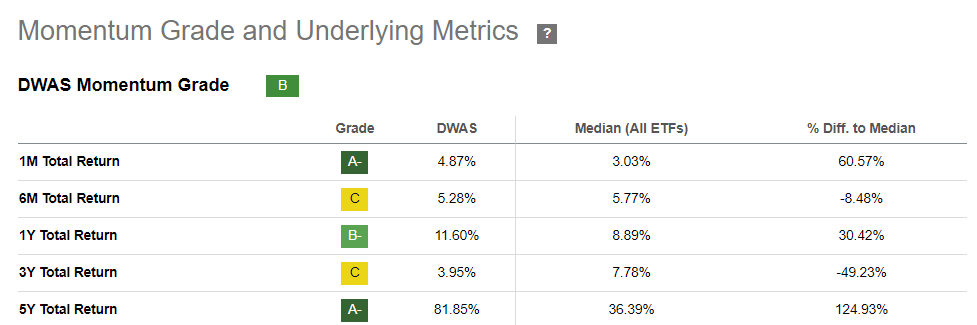
SPYD currently has a solid "B" Momentum Grade due to its excellent one- and six-month returns. However, what do you think the Grade will be on January 31, 2024, and the ETF rotates into worst-performing high-yield stocks? I anticipate little change because it doesn't appear the system considers these reconstitutions. And, since the momentum factor is double-weighted, this likely will result in a Quant Score that's too high.
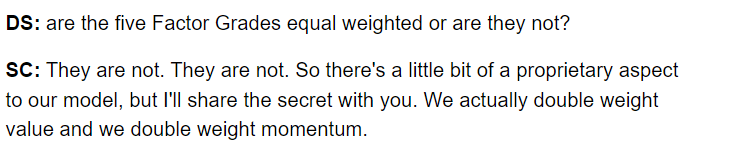
It's not an issue for ETFs like the SPDR S&P 500 ETF ( SPY ), which have annual portfolio turnover rates of around 2%. However, it is for many rules-based ETFs with turnover rates above 50% or even 100%. As a solution, I calculate weighted average momentum scores based on an ETF's holdings and make sure my database is updated weekly with the latest weightings. In addition, I calculate weighted average price/total return metrics based on current holdings because, as an investor, I'm not interested in what the ETF previously held. With that said, below are the 25 small-cap ETFs with the strongest weighted average momentum scores. I've also included each ETF's EPS Revision Score, which evaluates the trends in consensus earnings estimates.
As shown, the Invesco Dorsey Wright SmallCap Momentum ETF ( DWAS ) has the best momentum score at 8.56/10, which tells me that the strategy works as designed. Its constituents are trading 38.39% above their 200-day moving average price and are up 98.25% over the last year. To my previous point, this is substantially different than what the ETF itself experienced over the last year, and that's because DWAS is a highly active fund with an 181% turnover rate for its most recent fiscal year.
Pacer's CAFG and CALF also look great from a momentum perspective. That's just good fortune, as there's nothing in their methodologies that indicate they screen for high-momentum stocks, and this might not be the case as it reconstitutes four times throughout the year.
On earnings revisions, the average score is 5.82/10, but for this high-momentum group, the average score is 6.02/10. In contrast, the average earnings revision score for the bottom 25 ETFs by momentum score is only 5.70/10, which speaks to analysts' influence over stock prices. Simply put, when analysts increase their earnings estimate for a particular stock, more often than not, the stock price increases. This finding will not surprise anyone, but I want to highlight it because I prefer to follow Wall Street, not bet against it. Contrarian investors see things differently, and for those readers, please consider these 25 ETFs with the lowest earnings revision scores.
Unsurprisingly, we find a lot of value and dividend ETFs on this list because, in many ways, value investing is - buying beaten-down stocks with the potential for a strong turnaround. However, there are often good reasons for significant price declines, and that's the flag these earnings revision scores can raise.
Designing A Small-Cap ETF Ranking System
There are an infinite number of ways you can slice and dice the information presented in this article. While I can't create a strategy that works for everyone, I can give you the tools to design one that works best for you. To get started, please download this workbook , which contains three worksheets:
- An input worksheet sheet
- A points worksheet
- A statistics worksheet
On the first worksheet, I want you to assign a percentage value to each of the following ten statistics:
- assets under management (higher the better)
- expense ratio (lower the better)
- five-year beta (lower the better)
- five-year total returns (higher the better)
- ten-year total returns (higher the better)
- profit score (higher the better)
- value score (higher the better)
- growth score (higher the better)
- momentum score (higher the better)
- earnings revision score (higher the better)
If a factor is not important, enter 0%. Just make sure it sums to 100%.
Next, I want you to go to the last column in the second worksheet named "Total Points." Sort that list in descending order to find the best-ranked small-cap ETFs according to your personalized ranking system.
Finally, the third worksheet contains all the raw statistics for the ten factors listed above. If you'd like, you can view this first, but it's more valuable to do it last to see how well your current selections match your criteria. I hope this will give you some insight into how factor investing can help you discover the best ETFs for your portfolio, and as always, I look forward to answering your questions and comments below. Thank you for reading.
For further details see:
Small-Cap ETFs: Performance, Fundamentals, And Rankings For 102 Funds