OILX - Small Drop In U.S. February Oil Production
2023-05-05 01:15:00 ET
Summary
- U.S. February oil production decreased by 53 kb/d to 12,483 kb/d.
- Of the 53 kb/d drop, part of it is due to the upward revision of January production from 12,462 kb/d to 12,536 kb/d, an increase of 74 kb/d.
- Most of the states had a small drop except North Dakota which increased production by 77 kb/d.
A guest post by Ovi
All of the Crude plus Condensate (C + C) production data for the US state charts comes from the EIA?s Petroleum Supply monthly PSM which provides updated information up to February 2023.
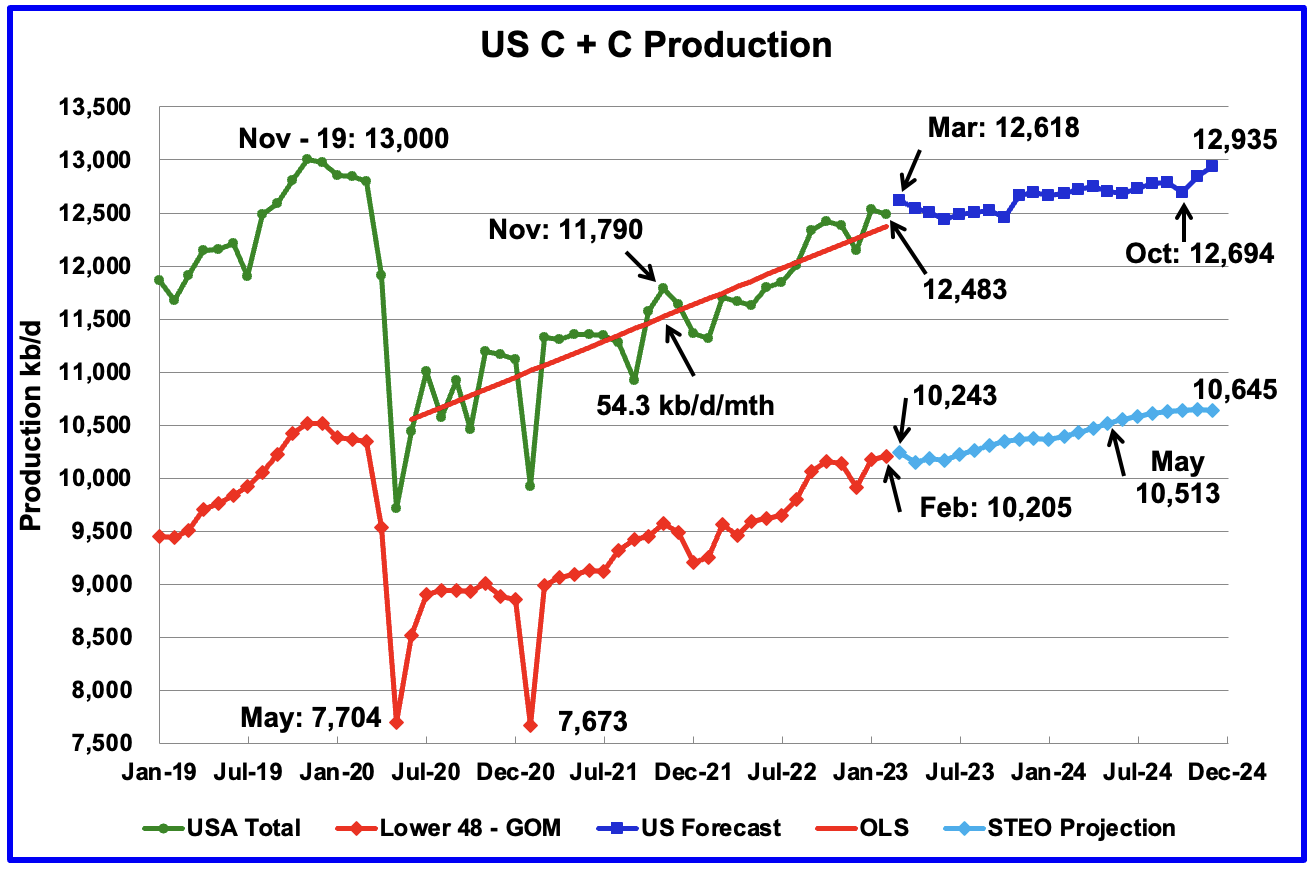
U.S. February oil production decreased by 53 kb/d to 12,483 kb/d. Of the 53 kb/d drop, part of it is due to the upward revision of January production from 12,462 kb/d to 12,536 kb/d, an increase of 74 kb/d.
Most of the states had a small drop except North Dakota which increased production by 77 kb/d.
The dark blue graph, taken from the April 2023 STEO, is the forecast for U.S. oil production from March 2023 to December 2024. Output for December 2024 is expected to be 12,935 kb/d which is 65 kb/d lower than the November 2019 peak of 13,000 kb/d. From March 2023 to October 2024, production is forecast to increase by 76 kb/d .
The red OLS line from June 2020 to February 2023 indicates a monthly production growth rate of 54.3 kb/d/mth, unchanged from last month. Clearly the growth rate going forward into 2023 and 2024, shown in the dark blue graph, is projected to be lower than the 54.3 kb/d/mth seen in the previous July 2020 to February 2023 period.
While overall US oil production decreased by 53 kb/d, the Onshore L48 had a production increase of 28 kb/d to 10,205 kb/d in February. The light blue graph is the STEO projection for output to December 2024 for the Onshore L48. From March 2023 to December 2024, output is expected to increase by 402 kb/d. Note that the last six months of 2024 are showing a hint of plateauing. From May 2024 to December 2024, production increases by just 132 kb/d.
Oil Production Ranked by State
Listed above are the 10 states with the largest US oil production along with the Gulf of Mexico. These 10 states accounted for 82.1% of all U.S. oil production out of a total production of 12,483 kb/d in February 2023. Note that New Mexico production, if it keeps increasing as it did over this past year, could surpass the GOM in the near future.
On a YoY basis, US production increased by 1,177 kb/d with the majority, 845 kb/d having come from Texas and New Mexico.
State Oil Production Ch arts
Texas production decreased by 25 kb/d in February to 5,264 kb/d, a drop from January’s post-pandemic high of 5,289 kb/d.
In January 2023, there were 324 Hz oil rigs operating in Texas. By late April 2023, the rig count had fallen to 311 Hz oil rigs, a drop 13 rigs. Will this drop in rigs manifest itself in a slowing or flat oil production rate going forward?
New Mexico’s February production continues at a high level but was little changed from January. February’s production dropped by 1 kb/d to 1,807 kb/d, close to the January record high of, 1,808 kb/d
The red OLS line from May 2020 to January 2022 indicates a production growth rate of 27.4 kb/d/mth and shows no sign of rolling over. However in the DPR section below, production in the Permian basin in April and May is showing sign of starting to roll over.
Since August 2022, the rig count has been steady in the high 90s, 97 ±4.
North Dakota’s February’s oil production has recovered from December’s extreme cold weather impacted production. Output increased to 1,124 kb/d, an increase of 77 kb/d over January.
The rig count in North Dakota has been holding steady at 40 since the beginning of the year.
Alaska?s February output decreased by 2 kb/d to 446 kb/d and was 4 kb/d lower than January 2022. February is the beginning of Alaska’s annual production declining phase.
Colorado?s February production decreased by 11 kb/d to 407 kb/d.
Oklahoma’s output in February dropped by 11 kb/d to 421 kb/d. Production remains 55 kb/d below the post-pandemic July 2020 high of 476 kb/d.
From January 2023 to March 2023 close to 60 rigs were in operation in Oklahoma. During April 2023 the average rig count fell to 53.
California?s overall slow output decline trend continues but appears to have accelerated in the last two months. February, along with January, also had a larger than normal drop. February dropped by 9 kb/d to 303 kb/d while January dropped by 11 kb/d.
Wyoming’s oil production has been on a slow unsteady uptrend from the low of 220 kb/d in February 2021 due to increased drilling. October and November 2022 output reached a post-pandemic high of 270 kb/d. Weather affected December production and February’s production is largely unchanged from January. February’s oil production dropped by 2 kb/d to 243 kb/d.
In late 2022, Wyoming had 18 rigs operating which dropped to 15 in January and dropped further to 12 in February.
Utah’s oil production increased steadily since early 2021 and reached a new high of 145 kb/d in October 2022. However since then, production has declined by 14 kb/d to 131 kb/d in February.
Utah had 7 Hz rigs operating in January and February 2023, up from 5 in January 2022.
Louisiana’s output rose from the low of 63 kb/d in September 2021 to 104 kb/d in May 2022. Since then output has plateaued. February’s production was unchanged at 99 kb/d and is 5 kb/d lower than May 2022.
GOM production decreased by 79 kb/d in February to 1,832 kb/d. If the GOM was a state, its production would normally rank second behind Texas.
The March 2023 STEO projected GOM output for February 2023 would drop to 1,828 kb/d. Amazingly, it just missed by 4 kb/d.
The April 2023 STEO projection for the GOM output has been added to this chart and projects that output in March 2023 will rise to 1,933 kb/d.
This could be a reasonable estimate since Shell announced that the Vito platform had begun production on February 15, 2023.
It is not known if the GOM decline after March 2023 is related to extensive maintenance.
A Different Perspective on US Oil Production
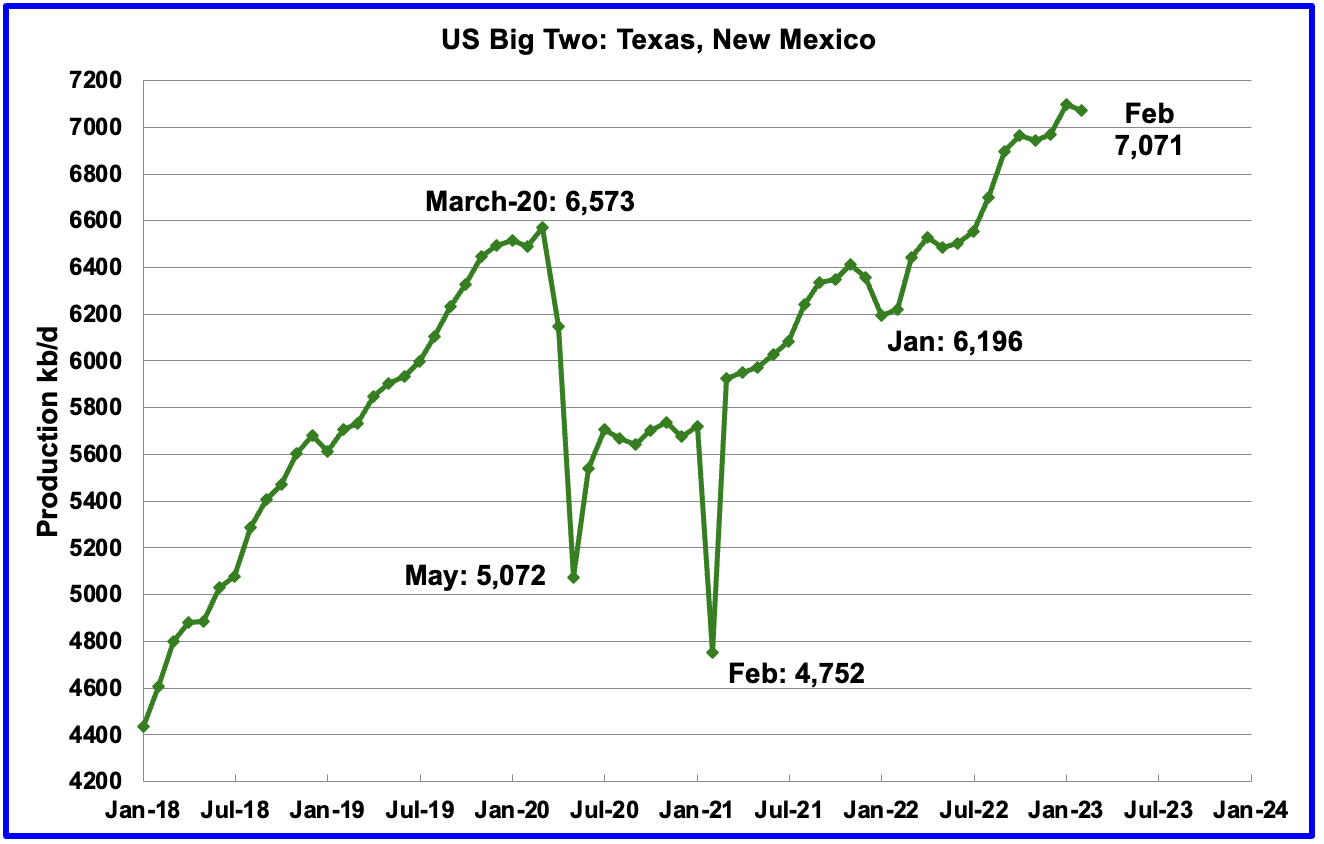
The Big Two states’ combined oil output for Texas and New Mexico.
February’s production in the Big Two states decreased by a combined 26 kb/d to 7,071 kb/d with Texas contributing 25 kb/d while New Mexico dropped 1 kb/d.
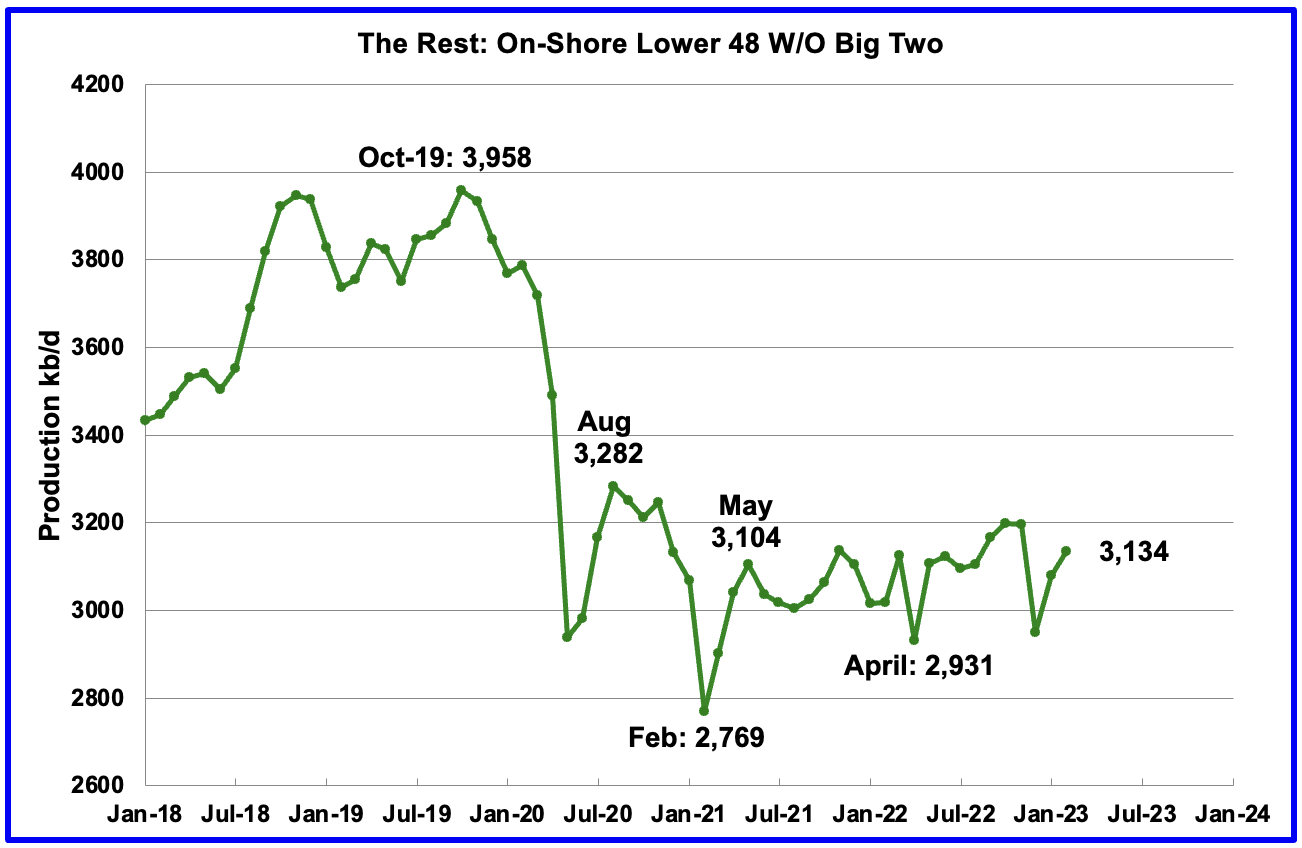
Oil production by The Rest
In February production in The Rest rose by 54 kb/d to 3,134 kb/d. From May 2021, oil production in The Rest has been range-bound between 3,000 kb/d and 3,200 kb/d and has not given any clear indication of being in decline or rising.
The main takeaway from The Rest chart is that current production is 824 kb/d below the high of October 2019. The question we need answered is “Is this a permanent loss that will never be recovered? ” All indications continue to be that this is a permanent loss.
Rigs and Fracs
Since the beginning of April 2021 through to the week ending July 29, 2022, the US added horizontal oil rigs at a rate of close to 3.76 rigs/wk, orange OLS line, and peaked at 551 rigs in the week ending July 29. However since then the number of operational rigs has wondered primarily sideways.
A high of 572 rigs was reached in the week ending November 25, 2022. In the week ending April 28, 2023 the number of rigs decreased by 2 to 541 and are down 31 from the recent high of 572.
In the week ending April 28, Permian rigs increased by 2 to 345 and Texas rigs dropped by 1 to 311. Note that the trend for rigs in the Permian is showing a slow increase from September 2022 and is currently 14 above the high of 331 on July 1, 2022.
For frac spreads, the general trend since the week of January 6, 2023 can best be described as recovering from the slowdown associated with the 2022 Thanksgiving and Christmas holidays. This trend is a repeat of what happened last year. However there is one difference. Last year the recovery took place over 9 weeks while this year it has taken 13 weeks so far.
For the week ending April 28, the Frac count increased by 4 to 294. How far above 300 will the Frac count get in 2023?
Note that these 294 frac spreads include both gas and oil spreads.
This interesting comment appeared in this North Dakota source regarding the availability of Frac crews: “Well completions rose in February and dropped in March due to volatility in the availability of fracking crews, Helms added.” Is this a North Dakota issue or does it also apply in the Permian?
Frac Spread Count Detail
The Frac Spread Count, provided by energy consultancy Primary Vision , measures how many crews across the U.S. are drilling wells in preparation for hydraulic fracturing of shale, and serves as a simultaneous indicator of the number of wells being drilled, as well as a leading indicator of crude oil production.
I have been working recently with the Frac Spread count database to try to understand how to use it. Some progress has been made and some initial results are provided. This is some of the typical information provided in their database, OperatorName, WellName, the vertical distance from a point in the well (usually the current or final depth) to a point at the surface, the total oil volume.
This above table shows the distribution of Frac spreads by Basin and State. The column NG was added to indicate which counties were primarily NG producers in places such as Texas and Colorado. Note that Pennsylvania and Ohio have no Frac spreads because they were left “Blank” in the spreadsheet since I think they are mostly natural gas plays.
The above results are for the week March 25 to March 31. According to the official Frac Spread site that week had 290 frac spreads operating. The table is showing 291. Of the 270 oil Frac Spreads, 138 or 51% are located in the Permian.
That date was chosen since the Frac data file is not fully up to date for later weeks.
This table shows the distribution of Frac spreads by State and County. Lea and Eddy counties are the hot spots in New Mexico while Howard, Midland, Loving, Martin, Midland and Reeves are the most active counties in Texas.
I would be interested in hearing whether there are any Gems in the two pivot tables or any additional info I should look at.
The info for many the lesser known counties came from this source . Information at this site and other similar ones indicate whether it is primarily an oil county or gas county.
Drilling Productivity Report
The Drilling Productivity Report (DPR) uses recent data on the total number of drilling rigs in operation along with estimates of drilling productivity and estimated changes in production from existing oil wells to provide estimated changes in oil production for the principal tight oil regions. The April DPR forecasts production to May 2023 and the following charts are updated to May 2023. The DUC charts are updated to March.
Above is the total oil production projected to May 2023 for the 7 DPR basins that the EIA tracks. Note that DPR production includes both LTO oil and oil from conventional wells.
The April DPR report made a modest upward revision to the March report. For instance, April output was revised up by 63 kb/d from 9,214 kb/d to 9,277 kb/d. The DPR is projecting that oil output for May 2023 will increase by 50 kb/d to 9,328 kb/d, a new all-time high. The pre-pandemic high was 9,288 kb/d in December 2019.
Note the rolling over production trend over the past five months. See next chart.
This chart shows the monthly DPR production increments. What is notable is the reduced month to month volatility since January 2023. The January 2023 spike is due to the weather related December oil production drop.
The more interesting trend to notice is the declining monthly changes in the production rate. March’s production increase was 82 kb/d while May’s increase dropped by 32 to 50 kb/d. This short-term trend is hinting at an upcoming plateau in Permian production, since it is the dominant producer.
The issue is whether this trend is the result of management’s decision on how to deploy its revenue, investors vs production, or is it related to geology, fewer Tier 1 locations along with the Permian gassing out?
However this source 's longer term forecast is that the Permian will continue to grow till 2030 and peak at close to 7,860 kb/d in 2030. See next chart.
In this chart, Rystad and Wood Mackenzie are forecasting peak production in 2030 of 7,000 kb/d to 7,200 kb/d. On the other hand, Enverus and S&P Global are forecasting peak production of 8,100 kb/d in 2030. The white graph is the EIA Permian projection showing close to 5,500 kb/d in early 2023. The white scale has been added to read the chart for 2030.
In January 2025, Rystad and Wood Mackenzie are indicating production of 7,100 kb/d to 7,250 kb/d while Enverus and S&P Global are showing production at 6,900 kb/d.
Looking at the lower estimate of 6,900 kb/d in January 2025 and current production of 5,700 kb/d (See next chart), and the slowing production in the Permian, it is difficult to see 1,200 kb/d being added over the next 19 months, based on the latest DPR info.
Permian output continues to rise in May. It is expected to increase by 13 kb/d to 5,694 kb/d.
If the Permian were part of OPEC, at 5,694 kb/d it would be the second largest producer after Saudi Arabia. April’s output is 778 kb/d higher than the pre-pandemic high 4,916 kb/d.
In February, the monthly production increase was 32 kb/d. In May it drops to 13 kb/d. This plateauing trend in the chart is very visible over the last four months , which is similar to the overall trend for the combined production in all of the LTO basins.
During March , 432 wells were drilled and 464 were completed in the Permian. (Note that March is the latest month for DUC information). The completed wells added 376 kb/d to March’s output for an average of 809 b/d/well. The overall decline was 345 kb/d which resulted in a net increase for Permian output of 31 kb/d. Of the 464 completed wells, 425 were required to offset the decline.
Note that the increased use of DUCs is a reversal of what occurred in the previous months where drilled and completed wells were essentially the same. For May, well competitions exceeded drilled wells by 32.
This chart shows the average first month total production from Permian wells tracked on a monthly basis. The total monthly production from the newest Permian wells in May continues to be at the 370 kb/d level. To achieve that production level in May, drillers completed 32 more wells than were drilled. In other words the Permian DUC count dropped by 32.
Output in the Eagle Ford basin has been in a generally flat trend since March 2021. However since the December 2022 weather-induced production drop, production has been increasing. May’s output is expected to increase by 6 kb/d to 1,141 kb/d and now exceeds the August 2020 output of 1,132 kb/d.
At the beginning of the year 2023, 68 rigs were operating in the Eagle Ford basin. The rig count began to drop in mid March to 60 and dropped further to 57 in the last week of April.
The DPR forecasts Bakken output in May will be 1,176 kb/d an increase of 17 kb/d over April.
Output in the Niobrara continues to increase slowly. May’s output increased by 4 kb/d and set a post-pandemic high of 672 kb/d.
Production increased due to the addition of more rigs into the basin. The Niobrara had 16 ± 1 rigs operating from January 2023 to April 2023.
DUCs and Drilled Wells
There has been a significant revision to the DUC data in the April report . First the total number of DUCs over the last five months has been reduced by approximately 200. Secondly, the trend has changed from increasing back to decreasing.
The number of DUCs available for completion in the Permian and the four major DPR oil basins has fallen every month since July 2020 and continued to decrease in March. March DUCs decreased by 28. The biggest decrease came from the Permian where DUCs decreased by 32 while Eagle Ford DUCs dropped by 10 and the Niobrara added 15, for a net of 27. The Bakken DUCs decreased by 1.
The Permian basin also had the same revisions as the four basins. Permian DUCs were revised down by over 300 and the trend reverted to decreasing. May Permian DUCs decreased by 32 to 761 because 432 wells were drilled and 464 were completed.
In these 4 basins, 742 wells were drilled while 770 were completed for a net decrease of 28 DUCs in March.
In the Permian, the monthly completion rate has been showing signs of stabilizing since the October high of 467. This is consistent with the frac spread chart shown above where there has been slow growth in frac spreads since February 2022. The number of wells drilled in the Permian is now showing signs of plateauing at the 435 level.
In March, 464 wells were completed, an increase of 2 over February. During March, 432 new wells were drilled, a decrease 3 from February. The gap between completed and drilled wells in the Permian has now opened up to 32.
The Permian, as of March has 761 DUCs and the current completion rate is 464 wells/mth. This means that the current cycle time between drilling and completions is 1.64 months or 50 days.
Editor's Note: The summary bullets for this article were chosen by Seeking Alpha editors.
For further details see:
Small Drop In U.S. February Oil Production