ATRI - SMDV: High Quality Small Cap ETF
2023-06-26 13:30:38 ET
Summary
- ProShares Russell 2000 Dividend Growers ETF holds about 100 dividend-growing small caps in equal weight.
- The heaviest sectors are financials, industrials, and utilities.
- Valuation looks inferior to the benchmark, but quality is much better.
- SMDV beats its closest competitor in return, dividend growth, and volatility.
This article series aims at evaluating ETFs (exchange-traded funds) regarding past performance and portfolio metrics. Reviews with updated data are posted when necessary.
SMDV strategy and portfolio
ProShares Russell 2000 Dividend Growers ETF ( SMDV ) started investing operations on 02/03/2015 and tracks the Russell 2000 Dividend Growth Index. It has 102 holdings, a distribution yield of 2.1%, and a total expense ratio of 0.40%. Dividends are paid quarterly.
As described in the prospectus by ProShares , the fund invests in:
companies that are currently members of the Russell 2000 Index, have increased dividend payments each year for at least 10 consecutive years and meet certain market capitalization and liquidity requirements .
Constituents are in equal weight, with a maximum of 30% in any sector. The underlying index is reconstituted annually in June and rebalanced quarterly.
SMDV invests exclusively in U.S.-based companies, 64% in small caps, and 36% in micro-cap companies. SMDV is more expensive than the parent index Russell 2000 ( IWM ) regarding price/earnings and price/cash flow ratios. However, it is a bit cheaper in price/book, as reported in the next table.
| SMDV |
| IWM |
| Price/Earnings |
| 15.32 |
| 11.11 |
| Price/Book |
| 1.54 |
| 1.77 |
| Price/Sales |
| 1.07 |
| 1.06 |
| Price/Cash Flow |
| 11.75 |
| 8.38 |
The fund is heavily invested in financials (27.6% of asset value), industrials (22%), and to a lesser extent in utilities (16.9%). Other sectors are below 10% individually and 34% in aggregate. Compared to IWM, SMDV massively overweights utilities, financials, materials, and consumer staples. It underweights mostly healthcare, technology, consumer discretionary, and ignores energy.
SMDV sectors (Chart: author; Data: ProShares, iShares)
Positions are in equal weight after every rebalancing, but they may drift with price action. The current top 10 names are listed below with fundamental ratios. These are the constituents with the highest momentum since the last rebalancing. They represent 10.7% of asset value. The largest holding weighs 1.15%, so risks related to individual companies are low.
| Ticker |
| Name |
| Weight |
| EPS Growth % TTM |
| P/E TTM |
| P/E fwd |
| Yield % |
| Apogee Enterprises, Inc. |
| 1.15% |
| 588.34 |
| 9.97 |
| 11.50 |
| 2.05 |
| Atrion Corp. |
| 1.10% |
| -9.96 |
| 35.39 |
| N/A |
| 1.44 |
| LeMaitre Vascular, Inc. |
| 1.08% |
| -25.39 |
| 73.45 |
| 57.33 |
| 0.82 |
| The First of Long Island Corp. |
| 1.07% |
| -2.66 |
| 6.97 |
| 9.63 |
| 6.66 |
| The Andersons, Inc. |
| 1.06% |
| 15.24 |
| 14.10 |
| 23.32 |
| 1.64 |
| Cogent Communications Holdings, Inc. |
| 1.06% |
| -67.01 |
| 301.40 |
| 620.46 |
| 5.80 |
| CSG Systems International, Inc. |
| 1.06% |
| 3.68 |
| 26.84 |
| 14.52 |
| 2.19 |
| Griffon Corp. |
| 1.06% |
| -449.67 |
| N/A |
| 9.64 |
| 1.34 |
| Healthcare Services Group, Inc. |
| 1.05% |
| 11.15 |
| 29.78 |
| 20.20 |
| 0 |
| HNI Corp. |
| 1.05% |
| 97.72 |
| 10.37 |
| 15.63 |
| 4.65 |
Historical performance
Since 3/1/2015, SMDV has beaten IWM by 7.5% in total return (see next table). SMDV is also ahead of its closest competitor, WisdomTree U.S. SmallCap Quality Dividend Growth Fund ( DGRS ). The difference in annualized return between the three funds is not really significant, but SMDV looks safer regarding the maximum drawdown and volatility (standard deviation of monthly returns). It also shows a better risk-adjusted performance, measured by Sharpe ratio.
| Total Return |
| Annual.Return |
| Drawdown |
| Sharpe Ratio |
| Volatility |
| SMDV |
| 71.29% |
| 6.68% |
| -34.12% |
| 0.4 |
| 15.63% |
| IWM |
| 63.72% |
| 6.11% |
| -41.13% |
| 0.31 |
| 20.47% |
| DGRS |
| 68.44% |
| 6.47% |
| -44.83% |
| 0.31 |
| 20.67% |
SMDV vs benchmark and competitor since March 2015
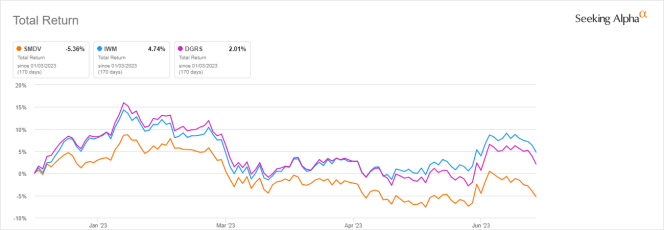
However, SMDV has been lagging in 2023 to date:
SMDV vs benchmark and competitor, year-to-date (Seeking Alpha)
The annual sum of distributions has increased from $0.73 per share in 2015 to $1.54 in 2022, which represents a 111% increase in 7 years. At the same time, cumulative inflation has been about 25%, based on CPI. SMDV beats not only inflation by a wide margin but also the dividend growth rate of its competitor DGRS: 70.6% in the same period.
SMDV distribution history (Seeking Alpha)
In previous articles, I have shown how three factors may help cut the risk in a dividend portfolio: Return on Assets , Piotroski F-score , and Altman Z-score .
The next table compares SMDV since 3/1/2015 with a subset of the S&P 500: Stocks with above-average dividend yield and ROA, good Altman Z-score and Piotroski F-score, and a sustainable payout ratio. It is rebalanced annually to make it comparable with a passive index.
| Total Return |
| Annual.Return |
| Drawdown |
| Sharpe Ratio |
| Volatility |
| SMDV |
| 88.64% |
| 8.45% |
| -33.22% |
| 0.53 |
| 15.69% |
| Dividend quality subset |
| 95.50% |
| 8.39% |
| -35.52% |
| 0.51 |
| 15.99% |
Past performance is not a guarantee of future returns. Data Source: Portfolio123
SMDV is close behind my dividend quality subset and shows similar risk metrics, which is a good point. My core portfolio holds 14 stocks selected in this subset (more info at the end of this post).
Portfolio quality
I have scanned holdings with my quality metrics, considering that risky stocks are companies with at least 2 red flags among: Bad Piotroski score, negative ROA, unsustainable payout ratio, bad or dubious Altman Z-score, excluding financials and real estate where these metrics are unreliable. With these assumptions, 12 holdings are risky, and they weigh 11.8% of asset value. It is not excellent but still acceptable.
Based on my calculation reported in the next table, SMDV beats its parent index in Altman Z-score, Piotroski F-score, and ROA. These metrics point to a portfolio quality superior to the benchmark.
| SMDV |
| IWM |
| Altman Z-score |
| 3.37 |
| 2.75 |
| Piotroski F-score |
| 5.13 |
| 4.43 |
| ROA % TTM |
| 3.93 |
| -0.22 |
Takeaway
ProShares Russell 2000 Dividend Growers ETF holds about 100 dividend-growing small caps with an equal-weight methodology. The heaviest sectors are financials, industrials, and utilities. The fund looks less attractive than the parent index Russell 2000 regarding valuation, but quality metrics are significantly better. SMDV beats the Russell 2000 in total return since inception. Moreover, it also beats its closest competitor DGRS, both in return and dividend growth rate, and shows a lower volatility.
For further details see:
SMDV: High Quality Small Cap ETF