SNN - Smith & Nephew: Need Strong Rotation Of Capital Into Market Value For FY23
2023-05-14 01:05:59 ET
Summary
- Smith & Nephew has caught a 21% bid in the past 6 months despite no major fundamental changes.
- Long-term data analysis reveals the company's difficulty in turning capital investments into additional market valuation.
- Shares look to be fairly priced with limited upside potential at the time of writing.
- Net-net, reiterate hold.
Investment Summary
Large cap medical device equities continue to present selective alpha opportunities for the intelligent investor. You will find the industry saturated with long-term capital appreciators, primed to unlock future risk capital with their superior economic characteristics. It is always wise to be on the hunt for cash-producing gems in this space.
Since my last publication on Smith & Nephew plc (SNN), the market has responded positively to its FY'22 numbers with an 8% upside reversal in market valuation. The question beckons: can this run further, and to what level? Some housekeeping – you're paying 18x forward earnings and 2.6x book value for SNN at the time of writing. That is an almighty request if you ask me. That, and quantitative-based analysis has it rated a firm hold as well. This report will examine the market's expectations at the 18x multiple, and present SNN's ability to create value going forward.
Key Findings:
- You can't count SNN out on the business front. Financial performance from the old warhorse (founded in 1856) continues to rate highly. It clipped $5.2Bn in FY'22 sales, and if you exclude 2020, has typically grown its top-line each year since 2015. It could do $5.5–$5.6Bn this year in my opinion. You count neck-high 70% gross margins on this, it pulls down to $233mm in TTM earnings. Consensus forecast earnings to compound each year into FY'25 [Figure 1], potentially driving 14% YoY growth in FY'24 with 4–6% P/E upside in that time. Regardless of the broad economy, there's no earnings recession projected on the cards for SNN.
Fig. 1 –SNN Forward Earnings Estimates
Data: Seeking Alpha
Fig. 2
Data: Author, SNN 10-K's
- Despite the above, investors have overlooked SNN in favour of more lucrative opportunities over the long-term. Indeed, 5-year performance of its stock has trailed all benchmarks. For one, the share price is down 11.6% since May 2018 (note: at the time of writing) compared to the S&P 500's 51% cumulative return.
- Recall, a company's market price is simply a set of future expectations priced at an agreed value. The daily auction process of the market ensures the day-to-day machinations in various quotes, and always ensures a buyer/seller at any one point. But over the long-term, it is a fairly accurate judge of intrinsic value, rewarding exceptional business economics over growth alone.
- Key point: investors have rewarded SNN with 26% rally in market value over the past 6-months. Question is, what (if any) expectations have changed for this near-term rally? After reading the arguments presented in this report, you'll note the data implies 1) not much, and 2) if anything, a reversion to the mean. Findings show there is a dislocation in company performance to investment performance, irrespective of the recent price-rally. Fundamental equity portfolio managers should factor this into the investment debate.
Net-net, findings corroborate that SNN stock is a hold in my opinion and I continue rate the stock neutrally until further evidence of its 12-point plan comes through.
Fig. 3 – SNN long-term performance
Data: Updata
Fig. 4 – SNN relative strength vs. S&P 500 index
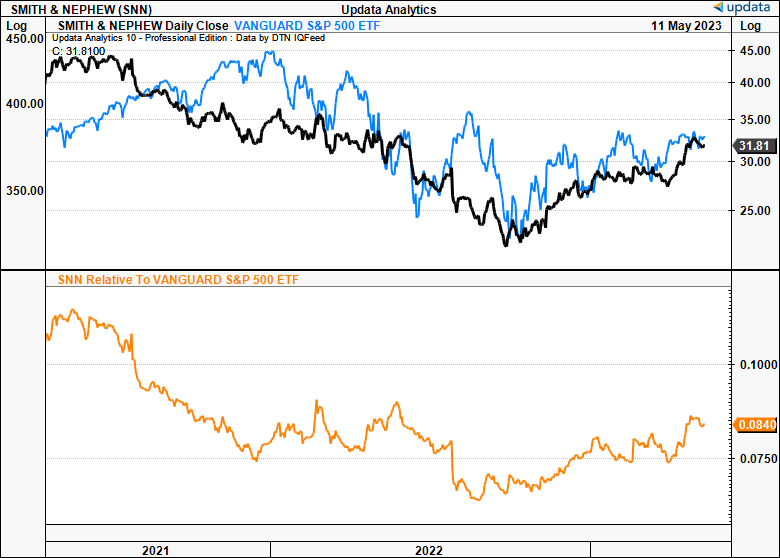
Data: Updata
Deep dive into SNN's value drivers
A long history and stable income from top to bottom line enables high predictability of SNN's future cash flows. Growth (with respect to financial performance) is not a key value driver for SNN. Such a mature company with broad market share must have more desirable economic characteristics in order to attract a higher market valuation over time. In that respect, there are two major segments of analysis required to dissect the dislocation in SNN’s financial performance to its investment performance going forward.
1. Relative Standing
Comparisons are always good to gauge value. SNN's standing relative to industry peers is observed in Figure 5 and 6. The former, seen below, outlines that SNN is typically more profitable than its average peer (~18% on average), but not compared to the upper 25% of near competitors.
The absolute numbers leave plenty to be desired as well. You'd be happy with a 21% trailing pre-tax, pre-interest margin for sure, less so if it pulled to just 2.6% in FCF margin as it did for SNN. Still, this is a whole 10% above the industry. This, on ~5% trailing return on total capital, compared to a negative 14% for peers – fairly small hurdle to beat in that regard. As you will see here today, it is capital productivity that has hampered SNN's share price in recent times (and could do going forward), illustrated below with the under-performance in asset turnover.
Fig. 5 – SNN vs. comps: Profitability
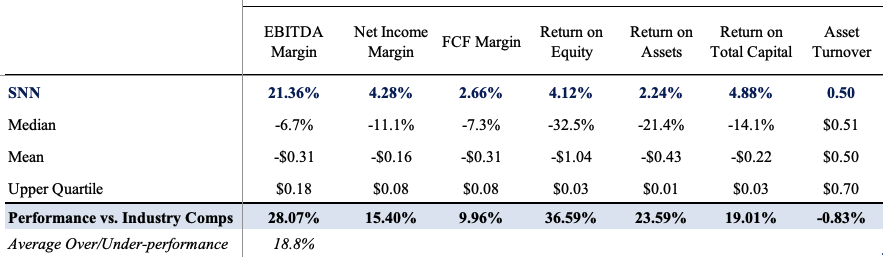
Data: Author, Refinitiv Eikon
Looking to how this has translated into market valuation for SNN, the following points sum it up nicely [Figure 6]:
- The market has rewarded SNN with a $13.8Bn market valuation at the time of writing, well above the industry median.
- It is priced at a 27% discount to peers at 18x forward earnings, however. The industry multiple is at 25x, quite a charge itself.
- There's also a relative discount at 2.6x book value and 29x cash flow, a point those shopping for actual discounts would find startling.
The major spectacle here is that SNN trades at an average 9% discount to peers even at these lofty multiples. This tells me a couple things.
Fig. 6 – SNN vs. comps: Multiples
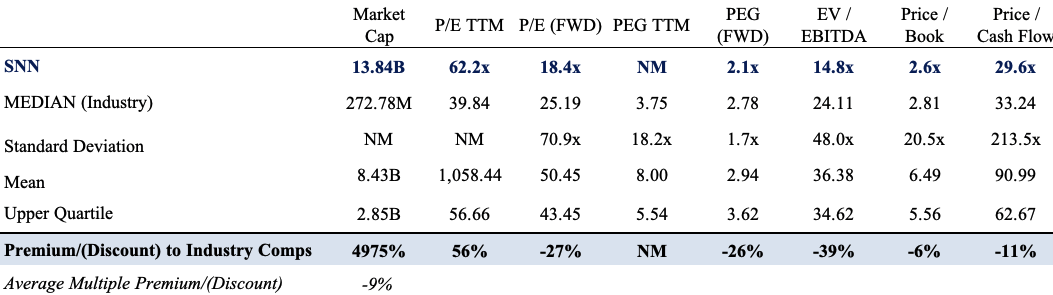
Data: Author, Refinitiv Eikon
First, is that the sector is expensive and actual bargains may be scarce. But this could also mean higher expectations of value, or, it could be higher risk associated with the investment. If it's higher expectations, SNN trades at a discount to these expectations. If it is higher risk, SNN offers only a slight discount relative to comps. Alas, if you're going to pay $18 for every $1 of SNN's future earnings (in-line with the S&P 500 by the way), you'd expect plenty of upside on the table.
2. Earnings Power, Capital Recycling
Investment return is a function of 1) initial capital charge [cost], and 2) cash and/or capital appreciation produced from putting the money at risk. This archaic calculus is no different for individuals or corporations. Understanding the value created from an investment return is a little more complex. For both investment managers and corporate CEO’s, a more detailed comparison against a hurdle rate is in order.
The importance of such a comparison when evaluating corporate equities cannot be understated, SNN included. The market rewards firms that recycle capital well with higher market valuations, and punishes those that don’t. More-so over the long-term. Further, intelligent investors pursue the best use of their capital, so the question of opportunity cost is constantly front of mind.
In that vein, for a firm to create additional value for its shareholders down the line, it should generate at least $1 in additional market value, for every incremental $1 in earnings it retains, and then reinvests into new capital. As the equation suggests, the market will pay higher multiples when the value of $1 is more valuable in the company’s hands than the investors over time. These are the economic characteristics of the business. Circling back to first principles, this relates to returns on capital:
- Investors trust their businesses to produce cash flows at rates above what he or she could produce on their own by investing at the benchmark rate.
- That way, the value of $1 is more in the company’s hands than the investor. The key point: you can only expect this to occur when a firm generates a return on its capital investments above what is generally available to investors [consider this watermark as the hurdle rate, otherwise, the UST 10-year yield + S&P 500 forward earnings yield, ~10–12% LT average] .
This economic profitability is more important to astute investors and differs from the accounting profit shown in financial statements. Periodic earnings growth says little about the success of capital allocation decisions. Economic earnings, the profit or loss above the cost of capital, say plenty. Earnings growth should occur with minimal capital charge, and generate profits above the hurdle rate to grow intrinsic value. If not, there’s no saying that a company’s growth will create value for its shareholders, often why you see disconnect between financial performance and investment performance of a company’s stock.
Note : Last time I talked at lengths about the company’s planned 12-point program to drive productivity and top-line sales in ortho and sports med. I’d say this is an essential move going down the line.
You’ll note in Figure 7 that SNN’s market valuation (market capitalization, annual) has collapsed from highs of $21.1Bn in 2019 to $13.8Bn at the time of writing in 2023. The Covid-19 period was unkind to the company’s P&L in 2020, resulting in a $500mm pullback in turnover to $4.5Bn and decrease in pre-tax income from $1Bn in June 2019 to $433mm by the same time next year (trailing figures). Things have improved, however. It now sees 5–6% top-line growth in FY’23 and booked $665mm in FY’22 EBIT, coupled with the relative findings discusses earlier.
Yet, there’s been no recovery in per-share market price. Simply looking at accounting numbers, this would remain puzzling. With a more thoughtful analysis, the answers are clearer.
Understanding SNN’s capital recycling and earnings power reveals some tough truths, as seen in Figure 7. Here SNN’s capital is separated into three separate piles. One pile covers the capital provided to the business from investors (i.e., debt and equity). Retained earnings are also treated as “retained capital”, that could have otherwise been distributed to shareholders. Finally, the book value of SNN’s capital investments show how SNN has used the capital provided and reinvested, as “capital at risk”. As of FY’23 in the TTM, total capital provided by investors amounted to $7.86Bn, and the firm had retained $5.4Bn in capital from its cumulative profits (FY’23 estimates call for $410mm increase in retained capital YoY).
From the numbers, three observations are made:
- Of the $7.86Bn and $5.4Bn in capital provided and earnings retained respectively, SNN has put $8.6Bn at risk through its own capital investments ($5.4Bn excluding goodwill). This suggests it has invested 110% and 63% of capital provided and retained, respectively (100% and 68% excluding goodwill).
- At the same time, post-tax earnings have shrunk from $858mm in FY’18 to $653mm last year. My numbers have SNN to generate $675–$680mm in after-tax operating earnings in FY’23. This is still a marked step down off long-term range.
- Hence, less profits on more capital density, equals higher capital intensity, and lower capital productivity. The demands required to create value a far higher in this scenario.
Fig. 7
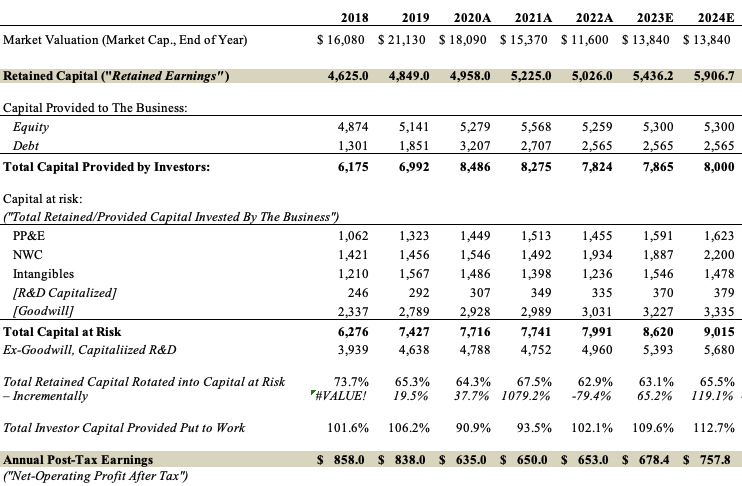
Data: Author, Refinitiv Eikon, Market Data
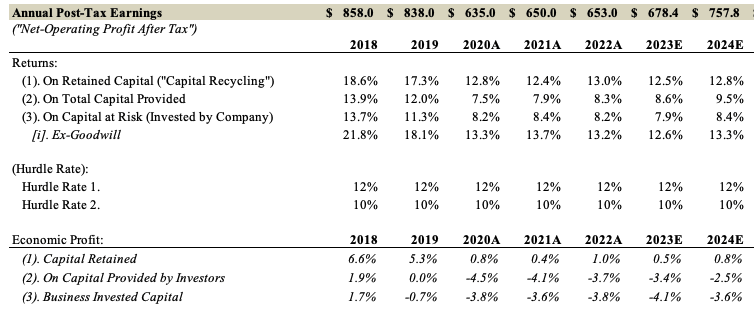
The implications on SNN’s investment return from point number (3) are observed in Figure 8. The total profit generated from the 3 investment piles are shown in numerical order. Returns are measured by the total post-tax earnings (“NOPAT”) generated from each investment pile. This is then compared with the hurdle rate (12% in this instance) to establish the economic earnings for the period, expressed as a percentage. Notably, the company is profitable on the capital it allocates.
However, additional findings reveal:
- From 2019–date the firm has produced a series of economic losses for shareholders. This is seen when looking at returns on total capital and returns on invested capital. The spread is ~4 percentage points under the benchmark each year.
- Looking to returns on retained capital (i.e., capital recycling from retained earnings) the returns haven’t been much better.
- SNN’s market cap has followed the trajectory of these rates of return with tight causal relationship.
- In years, when where returns on capital at risk and capital provided missed the hurdle rate, investors revalued the company to the downside, and vice-versa.
The resulting economic profit or losses for each year are seen near the bottom of Figure 8 and show SNN with a negative 3.8% loss on invested capital in FY’22. My numbers have this to widen to negative 4.1% this year, and negative 3.6% in 2024. In all three scenarios, the capital retained, provided and invested, has not generated sufficient return above the benchmark since 2020, and might continue doing so if my numbers prove to be correct.
Fig. 8
Data: Author, Refinitiv Eikon, Market Data
Incremental investment values and incremental returns are observed in Figure 9. Here, the year-on-year delta is taken across retained capital, capital provided and invested, along with the change in post-tax earnings and book value per share from 2018–date. The incremental returns are measured as the change in NOPAT with respect to the change in investment/capital, as a percentage. Returns on incremental capital have been lumpy in recent years as the cadence of investments increased with slower profit growth. It wouldn’t be unreasonable to expect SNN to invest another $600–$650mm this year to potentially generate another $25mm in post-tax earnings, representing 7.6% return on incremental capital.
Fig. 9
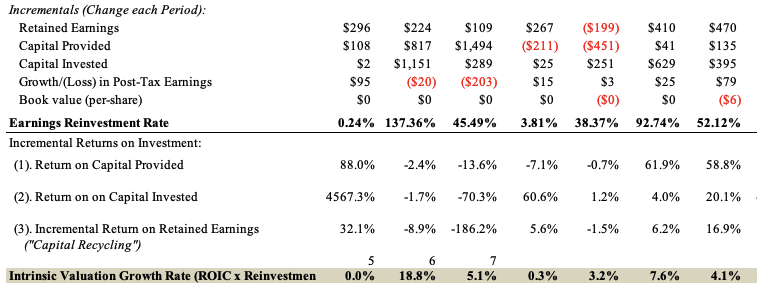
Data: Author, Refinitiv Eikon, Market Data
There is much to take from the data presented so far. The most important, that investor capital is at risk with SNN unable to meet the hurdle on its own investments. A dollar is more valuable in the investor’s hand than the company. How this translates to intrinsic value is intriguing, but perfectly logical. Investors aren’t going to value a company higher if it isn’t rotating capital to produce new profits at rates above the hurdle. And why would they? Their business isn’t as effective as a use of capital. They will hold its dollar instead and ride the benchmark. In that vein, SNN’s YoY growth hasn’t been conducive to valuation. Instead, the growth has come at a cost to shareholders, given it came at an economic loss.
3. Valuation
It is clear that investors have overlooked SNN for more lucrative opportunities who can increase the value of $1 higher than themselves. The company is projected to generate $680mm in NOPAT this year and did $650mm in FY’22. Looking to the steady-state value, at the 12% hurdle rate, SNN is valued at $5–$6Bn ($650 / 0.12 = $5,440), so in my opinion, the market expects another 18–20% growth in NOPAT over the coming 5-years, getting to the $13–$14Bn current market cap ( [$650 x 1.12^5 ] / 0.12 = $13,500). That is not unreasonable, but is a tremendous ask, nonetheless, especially given the trends observed in recent years.
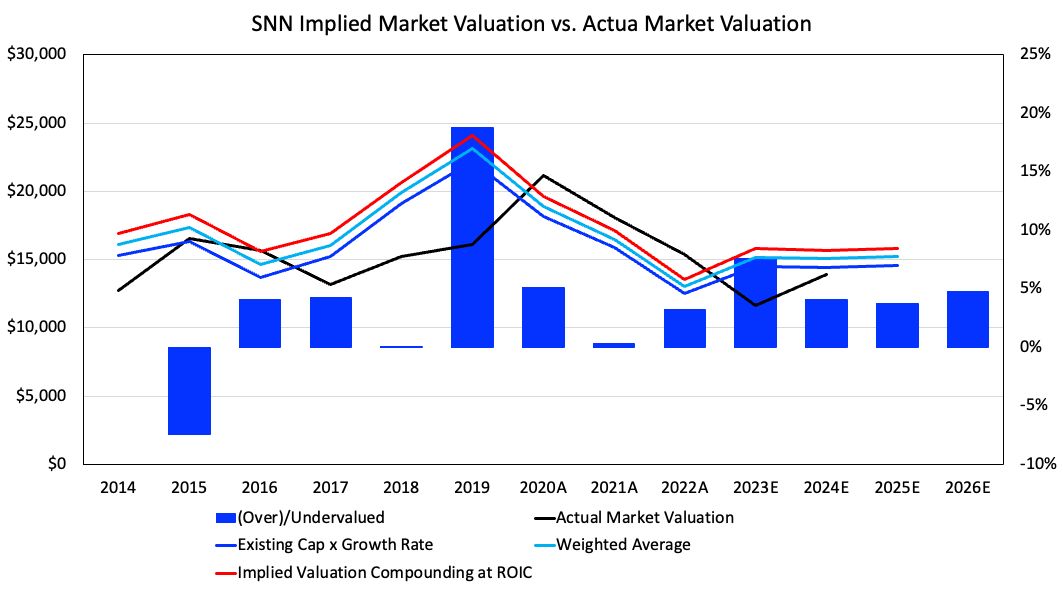
A firm can compound its intrinsic valuation at a rate determined from the return on its investments and size of reinvestment (Growth = ROIC x Reinvestment). In that vein, intrinsic value closely follows a company’s return on capital and incremental investments. The market pays very close attention to this relationship for SNN, as seen in the implied valuation model Figure 11. The model of implied valuation is built with 3 separate drivers into a single composite. Each driver uses either ROIC, intrinsic value growth, rolling growth from current value, and a weighted average, to assign a fair valuation. Implied values are then calculated. Data of actual market cap and price delta from 2013–2022 is then rolled forward 1-year onto the implied values to project a fair market value for the following 12-months, on a rolling 12-month basis. Results are seen below.
Findings suggest that SNN is reverting towards longer-term mean and may be about fairly valued at its current market value. It certainly doesn’t suggest a rapid upside potential, like it did in 2017, and again in 2019. The model does a good job in capturing the changes in market value from the capital investments a firm makes. Further, it shows the market is a good judge of fair value over time, with the market cap eventually moving in tandem with the derived values.
Looking ahead, it shows:
- SNN is likely fairly valued at its current market cap, and could track sideways into FY’24.
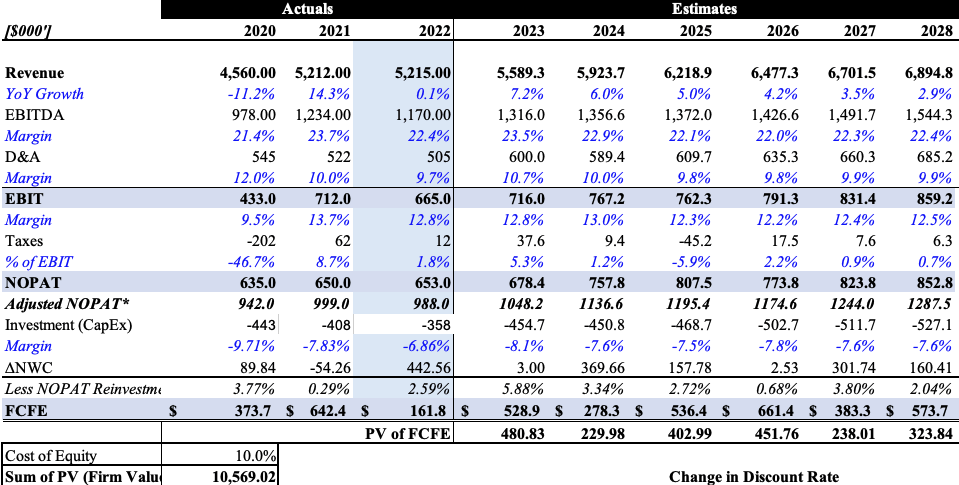
- The firm could throw off $530mm in cash to shareholders this year, with another $280mm in FY’24. I’d call for SNN to be a $500mm in FCF company by 2025 [Figure 10].
- Discounting these cash flows at the hurdle rate out to FY’28 would value SNN at $10–$12Bn, depending on what growth is used. Using my FY’23 numbers, this translates to 13.5x forward P/E. This is below consensus forward estimates of 18x earnings.
- We’d need an 8–8.5% discount rate for SNN to be fairly valued using these projections.
As a result, it appears from this analysis that a hold rating is warranted for SNN.
Fig. 10
Data: Author
Fig. 11
Data: Author, Market Data
Fig. 11a
Data: Author, Market Data
4. Conclusion
In summary, there is a logical explanation of SNN's stock performance over the last few periods. Going forward, there's no evidence to suggest this will rapidly change. My numbers expect the company to do 5–6% growth in revenue this year on ~$680mm in NOPAT, which could pull to $500mm in FCF for the year. Still, there are concerns. The orthopaedics and sports medicine juggernaut hasn't been an efficient use of capital and created value for shareholders above the benchmark. If these trends are to continue, it's hard to see SNN catching a bid back above previous highs. The 12 point plan, discussed at lengths in my last SNN publication, is well received, but may take some time to fully materialize. Still, don't count this name out just yet. It hasn't been around since the 1800's for no reason. I'll be monitoring the data closely. Net-net, reiterate hold for now.
For further details see:
Smith & Nephew: Need Strong Rotation Of Capital Into Market Value For FY23