STEW - STEW: Sell This Underperforming Low-Yield Fund
2024-01-02 12:55:21 ET
Summary
- The SRH Total Return Fund, Inc has a disappointing current yield of 3.97%, lower than most closed-end funds and cash in a money market fund.
- The STEW closed-end fund's share price has consistently trailed the S&P 500 Index over the past five years.
- The fund's heavy concentration in a few securities, including Berkshire Hathaway, may be a factor in its underperformance.
- The fund is covering its distribution and has a very attractive valuation, but that is not enough to redeem it.
- The fund is consistently underperforming the one stock that accounts for more than a third of its portfolio, so just buy that instead of this fund.
The SRH Total Return Fund, Inc ( STEW ) is a closed-end fund, or CEF, that investors can employ as a way to make money from their assets. At first glance, this fund does not seem to have very much to offer, as its 3.97% current yield is very disappointing for a closed-end fund. After all, most of these funds have yields that approach the double digits. This fund’s yield is actually lower than what we can easily obtain by storing cash in a money market fund, but it does still manage to beat most common stocks. It is also not from a very well-known fund manager, which could be a turn-off for some investors.
That does not necessarily mean that the fund will be unable to deliver an acceptable return to its investors. After all, Apollo Global Management ( APO ) and Ares Management ( ARES ) also do not have as much name recognition as Eaton Vance or PIMCO, but closed-end funds offered by those two management companies have been among the best-performing funds in the market over the past three years.
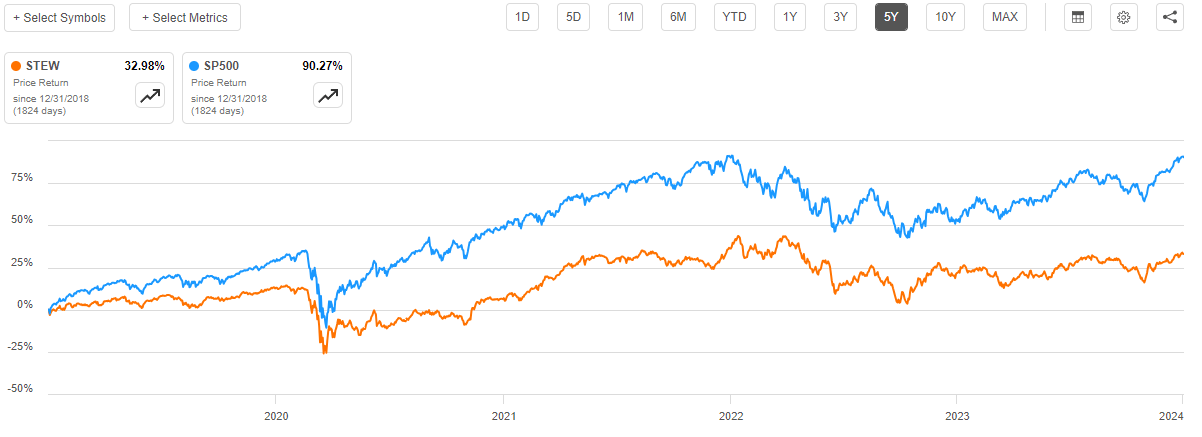
Unfortunately, the SRH Total Return Fund has not had an especially impressive track record. As we can see here, the fund’s share price has trailed the S&P 500 Index ( SP500 ) over the past five years:
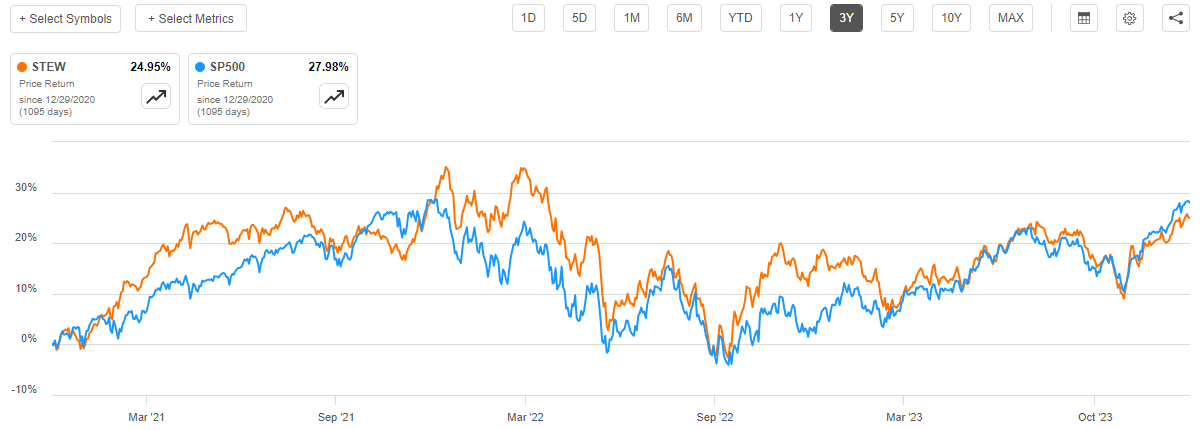
We see the same thing over shorter periods of time as well. The fund’s share price also trails the index during any past period that is longer than a week. The fund only manages to get reasonably close to the index over the trailing three-year period:
However, even then the index beats the fund by more than 300 basis points. As such, this comparison suggests that buying an S&P 500 Index fund would be a better option for anyone who is seeking to maximize their total returns.
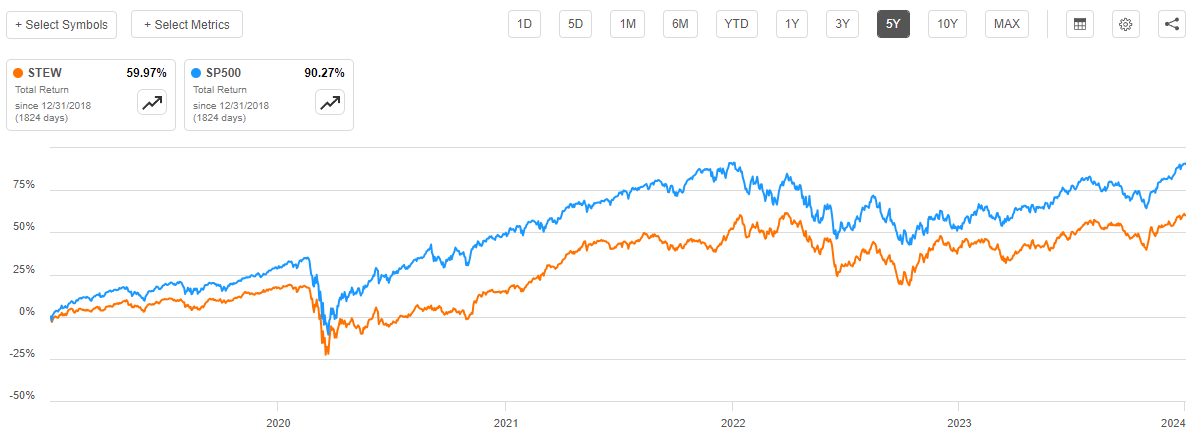
However, as I have pointed out numerous times in the past, closed-end funds like the SRH Total Return Fund generally attempt to maintain a relatively stable asset value and pay out all of their investment profits to the shareholders in the form of distributions. This is the reason why these funds usually have much higher yields than most other things in the market. This fund is not really an exception to this, as its current yield does beat most common stocks, although it is lower than most other closed-end funds. As such, we need to include the distributions paid by the fund in any discussion of its performance. When we do that, we still see that the fund has substantially underperformed the S&P 500 Index over the past five years:
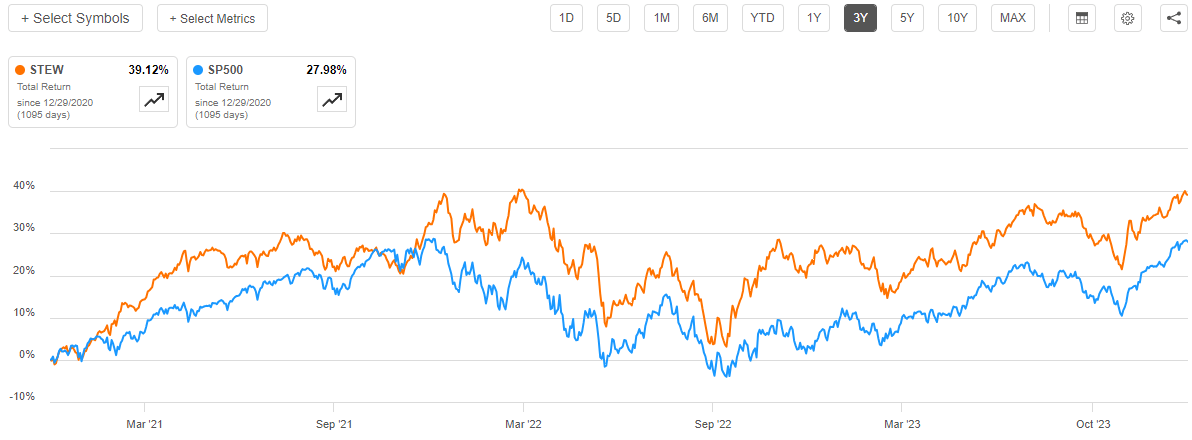
However, in this case, it does manage to beat the index over the past three years:
This could have something to do with the fund’s active management. When the Federal Reserve started raising interest rates in early 2022, it crushed the technology stocks that were responsible for much of the gains in the S&P 500 Index over the past decade. Meanwhile, energy stocks delivered strong gains and some other sectors, like healthcare, were relatively flat. Thus, it was not too hard to avoid the worst of the 2022 decline in the index by avoiding certain sectors.
However, for the most part, this cursory review of the fund’s total returns suggests that potential investors would be better off putting their money into an S&P 500 Index fund. With that in mind, let us have a closer look at this fund as it is possible that we are missing something that may still give us a reason to consider purchasing it.
About The Fund
According to the fund’s website , the SRH Total Return Fund has the primary objective of providing its investors with a very high level of total return. This actually makes a lot of sense just considering the fund’s name. The website describes the basic strategy that the fund employs in pursuit of that objective:
SRH Total Return Fund, Inc. is a non-diversified closed-end fund with a total return investment objective. To achieve its objective, the Fund utilizes a bottom-up, value-driven investment process to identify securities of good quality businesses trading below estimated intrinsic value. The intent of this process is to identify investment opportunities that will provide attractive returns over a long holding period. By doing this, the Fund seeks to keep portfolio turnover low, which the sub-adviser believes helps to minimize associated trading costs. The Fund maintains a high level of investment flexibility and has the ability to invest in equity and fixed income securities of domestic and international without limitation to a company’s market capitalization.
This admittedly does not tell us very much except that the fund is using a buy-and-hold strategy that focuses on investing in common equities. CEF Connect confirms this:
CEF Connect
As we can see, the fund is nearly entirely invested in common stock. It does have very low allocations to bonds, preferred securities, and convertibles but all three of these allocations are so small that they will have next to no impact on the fund’s overall performance. The negative allocation to cash simply tells us that the fund uses a small amount of leverage in an attempt to boost its total returns. We will discuss this in more detail later in this article.
The fact that the fund focuses on common stock works pretty well with its total return objective. As I discussed in various previous articles, common stocks are by their very nature total return vehicles. After all, investors purchase these securities because they want to earn an income from the dividends that these companies pay out to their owners, as well as benefit from the capital gains that should accompany the growth and prosperity of the issuing companies. That is the very definition of total returns.
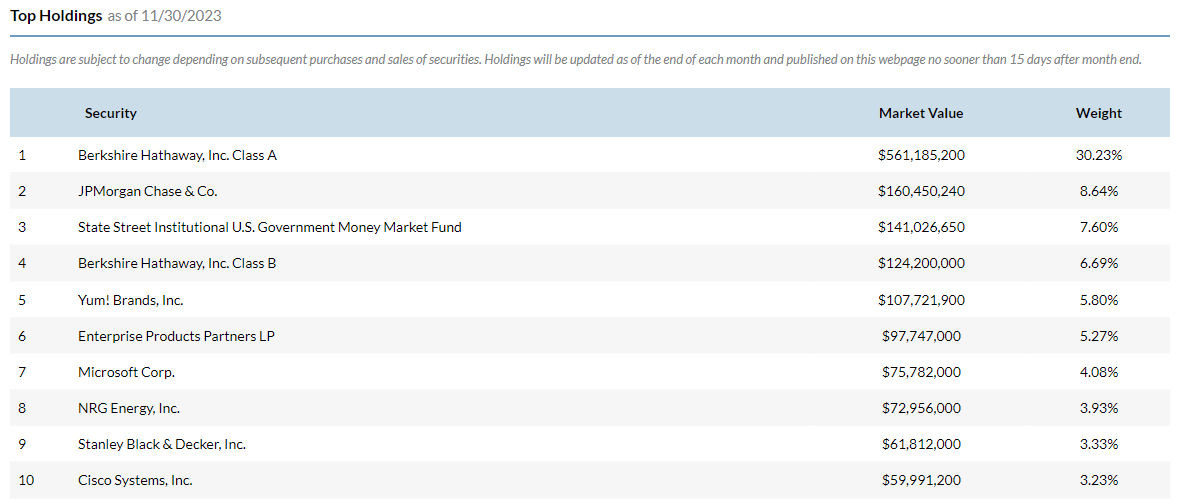
The fund’s portfolio is very different from what we might find in most closed-end funds. Here are the largest positions in the portfolio:
I think that this might be one of the only funds that I have ever seen with Berkshire Hathaway ( BRK.A , BRK.B ) among its largest holdings, as well as Stanley Black & Decker ( SWK ). This could be a good thing for those investors whose portfolios contain other funds because it provides exposure to companies that other funds do not. This works well to reduce concentration risk, which is one of the biggest problems that most fund investors face. Basically, many closed-end funds tend to hold the same or very similar portfolios, so even if you have a number of equity funds in your portfolio, you may not be very well diversified because all of the funds are holding the same dozen or so stocks. This fund has very different holdings from most funds, which does allow it to improve the diversification of your overall portfolio as you will have exposure to very different securities than those provided by the other funds that you might hold.
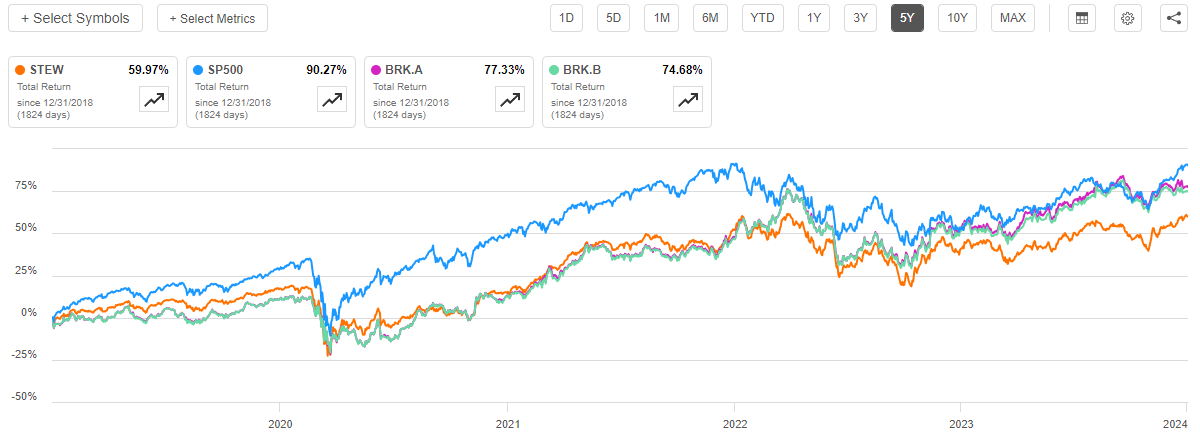
However, we can see here that this fund has a very heavy concentration in only a few securities. Specifically, we can see that Berkshire Hathaway’s class A stock accounts for 30.23% of the fund and its class B shares account for 6.69%. This means that fully 36.92% of the fund’s portfolio is invested in Berkshire Hathaway. The first thought that I had when I saw this was that the management of this fund are students of the Ben Graham/Warren Buffett way of thinking about investing and the markets. The heavy exposure to this company does provide investors with a great deal of exposure to Warren Buffett and his lieutenants as investment managers, but anyone who wants that can just buy Berkshire Hathaway directly. The heavy exposure to Berkshire Hathaway could explain some of the fund’s performance problems, as Berkshire Hathaway’s stock has underperformed the S&P 500 Index over the past five years:
As we can see here, over the past five years, the S&P 500 Index delivered a 90.27% total return. This significantly beat the 77.33% total return of Berkshire Hathaway’s class A shares and the 74.68% total return of Berkshire Hathaway’s class B shares. Interestingly, the fund trailed Berkshire Hathaway over the same period despite the heavy exposure to this company in its portfolio. That further suggests that investors who really want exposure to Berkshire Hathaway may as well just buy that company instead of this fund.
The fund explicitly warns investors about its high concentration to a relatively small number of stocks on its website:
“The Fund’s management believes that it is important that stockholders be aware that the fund is highly concentrated in a small number of positions. Concentrating investments in a fewer number of securities may involve a degree of risk that is greater than a fund which has less concentrated investments spread out over a greater number of securities. In particular, the fund is highly concentrated in Berkshire Hathaway Inc., which in addition to other business risks, is dependent on Warren Buffett for major investment decisions and all major capital allocation decisions. If Mr. Buffett were no longer able to fulfill his responsibilities to Berkshire Hathaway Inc., the effect on the value of the Fund’s position in Berkshire Hathaway Inc. could be materially negative.”
Berkshire Hathaway is not the only company that the SRH Total Return Fund is heavily weighted to, however. As regular readers on the topic of closed-end funds are no doubt well aware, I generally do not like to see any individual position in a fund account for more than 5% of a fund’s total assets. That is because this is approximately the point at which a position begins to expose the fund as a whole to idiosyncratic risk. Idiosyncratic, or company-specific, risk is the risk that an event will cause a company’s stock price to decline when the market as a whole does not. The quote above points this out, as it seems very likely that something bad happening to Warren Buffett will have a much more adverse effect on Berkshire Hathaway’s stock price than it would have on the S&P 500 Index. If a fund’s position in a given asset is too large as a percentage of the portfolio, then such an event could cause that asset to drag the entire fund down with it.
In addition to Berkshire Hathaway, we see very high weightings to JPMorgan Chase ( JPM ), Yum! Brands ( YUM ), and Enterprise Products Partners ( EPD ). As such, potential investors should ensure that they are willing to take on the individual risks of these companies before investing in this fund.
Leverage
As mentioned earlier in this article, the SRH Total Return Fund employs leverage as a method of boosting its effective total returns. This is a very common strategy that is employed by funds like this, which I have explained in various previous articles on other closed-end funds. To paraphrase myself:
“Basically, the fund borrows money and then uses that borrowed money to purchase common stocks and similar assets. As long as the purchased securities provide a higher total return than the interest rate that the fund has to pay on the borrowed money, the strategy works pretty well to boost the effective total return of the portfolio. As this fund is capable of borrowing money at institutional rates, which are considerably lower than retail rates, this will normally be the case. However, the use of leverage is not nearly as effective at boosting total returns today than it was a few years ago due to the fact that leverage is considerably more expensive than it used to be.
It is important to keep in mind that the use of debt in this fashion is a double-edged sword. This is because leverage boosts both gains and losses. As such, we want to ensure that the fund is not employing too much leverage because that would expose us to an excessive amount of risk. I generally do not like a fund’s leverage to exceed a third as a percentage of its assets for this reason.”
As of the time of writing, the SRH Total Return Fund has leveraged assets comprising 11.65% of its portfolio. This is substantially less than the one-third level that I generally consider to be acceptable for an equity fund. This is also far below the leverage that is employed by most closed-end funds. This could actually prove to be a bit of a handicap for this fund, unfortunately. Closed-end funds like this one are actively managed so their fees tend to be a bit higher than passive index funds. This fund has a 1.61% management fee, for example. The use of leverage is one of the ways that fund managers are able to deliver returns that are competitive with passive options while still covering the higher fees. The fact that this fund has such a low level of leverage thus means that the fees might drag on its performance compared to passive options. That might be one of the reasons why this fund consistently underperforms the S&P 500 Index.
The balance between the risk and reward with respect to this fund’s leverage is acceptable. In fact, it probably should be using a bit more leverage to bring its performance up to a level that is more in line with the underlying assets.
Distribution Analysis
As mentioned earlier in this article, the SRH Total Return Fund has the primary objective of providing its investors with a very high level of total return. In pursuance of this objective, the fund invests primarily in common stocks that provide their returns both in the form of capital appreciation and dividends. However, the dividend yields on most common stocks have been incredibly low over most of the past twenty years. However, the general strategy for most closed-end funds is to pay out all of their investment profits to the shareholders. This includes realized capital gains, which can result in even equity closed-end funds having fairly high yields. The SRH Total Return Fund only has a 10% annual turnover though, so it does not realize capital gains very often. Unfortunately, this means that we can expect that this fund’s distribution yield will probably be lower than that of most other closed-end funds.
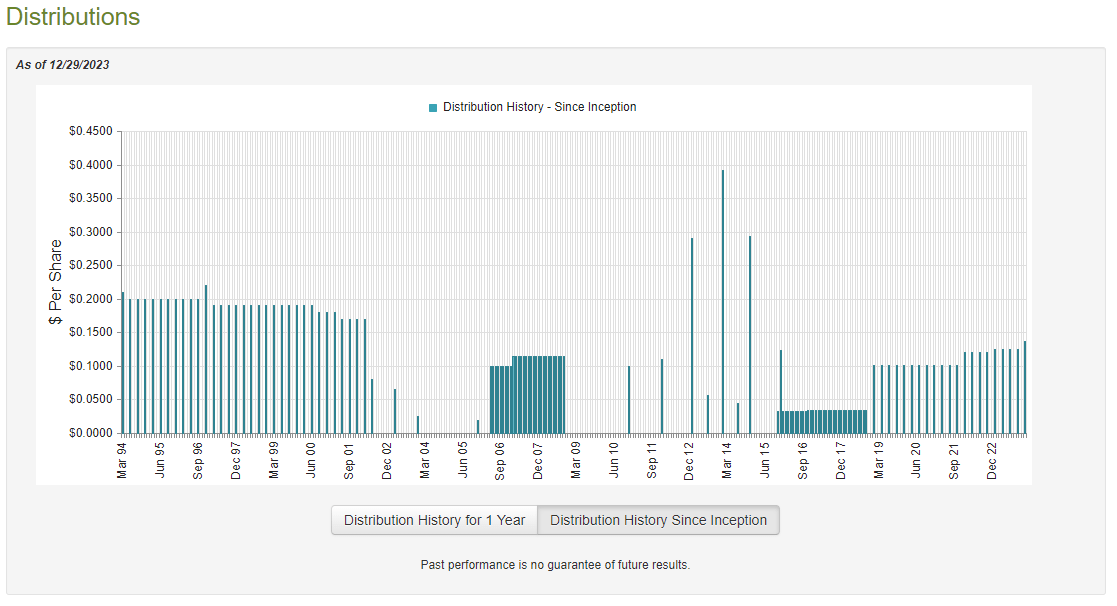
This is indeed the case, as the SRH Total Return Fund pays a quarterly distribution of $0.1375 per share ($0.55 per share annually), which gives it a 3.97% yield at the current price. That is certainly better than the 1.40% current yield of the S&P 500 Index ( SPY ) but it is far lower than the near double-digit yields possessed by most closed-end funds today. In addition, the fund’s yield has not been especially consistent with respect to its distributions over the years. As we can see here, the fund’s distribution has been all over the place over its history:
The fact that the fund’s distribution has varied considerably over time seems likely to prove very unattractive for those investors who are seeking to receive a safe and consistent income that can be used to pay their bills or finance their lifestyles. However, that is not really the point of a fund like this. It is simply trying to maximize its total return, so this is the sort of fund in which the distributions should be reinvested into its shares or other things so that they compound over time. There are several funds such as this, especially ones that invest in foreign markets. As many investors who invest in closed-end funds are seeking to earn income to supplement their retirement though, the variable distribution here will probably make it somewhat less attractive than many of the other funds that we discuss in this column.
As is always the case though, we want to have a look at the fund’s finances in order to determine how well it is sustaining the distribution that it is paying out. As I have pointed out numerous times in the past, a fund that pays out more than it generates from its portfolio ends up destroying its net asset value. That is an unsustainable situation over any sort of extended period. Thus, let us have a look at the fund’s finances.
Unfortunately, we do not have an especially recent document that we can consult for the purpose of our analysis. As of the time of writing, the most recent financial report that is available for the SRH Total Return Fund corresponds to the six-month period that ended on May 31, 2023. As such, this report does not provide any information about the fund’s performance over the past seven months. That is disappointing, as there have been a number of events that have occurred over the past seven months. In particular, the market declined over the summer as investors began to become accustomed to the Federal Reserve’s “higher for longer” mantra. This reversed around mid-October, and the market delivered one of the strongest rallies that many of us have ever seen. As such, the fund may have incurred some losses during part of the interim period, but it also had the opportunity to make some profits in recent months. This report will unfortunately not provide any information about how well it delivered during either of these periods. We will need to wait for the fund to release its annual report to obtain this information, which should occur sometime in the next month or so.
During the six-month period, the SRH Total Return Fund received $18,411,457 in dividends and $1,576,905 in interest from the assets in its portfolio. This gives the fund a total investment income of $19,988,362 over the full-year period. The fund paid its expenses out of this amount, which left it with $7,878,529 available to shareholders. That was, unfortunately, nowhere close to enough to cover the distributions that the fund paid out over the period. This fund paid out a total of $24,333,280 to its investors via its distributions over the six-month period. At first glance, this is almost certainly going to be concerning, as the fund clearly is failing to fully pay its distributions out of its net investment income.
However, the fund does have other methods available to earn the money that it needs to cover the distributions. For example, it might have been able to realize some capital gains from the stocks that are in its portfolio. After all, the first half of this year was a pretty good period for many stocks in the market as investors were attempting to front-run a September 2023 pivot by the Federal Reserve. That pivot obviously never happened, but the fund might have still had the opportunity to make some money.
The fund unfortunately had mixed results at this task. It reported net realized gains of $19,358,023 during the period, but this was more than offset by $59,717,279 net unrealized losses. Overall, the fund’s net assets declined by $56,814,007 during the six-month period after accounting for all inflows and outflows. Thus, the fund technically failed to cover its distributions fully.
However, the only reason that the fund failed to cover the distributions is because of unrealized capital losses. These can very quickly be erased the moment the market turns, as it did back in October. As such, they are not really a big deal. The fund’s net realized gains plus its net investment income totaled $27,236,552, which was sufficient to fully cover the distribution. We see the same thing during the full-year period that ended on November 30, 2022, as the fund did have sufficient net investment income and net realized gains to cover the distributions that it paid out during that period. As such, this fund does not really appear to be having problems covering its distribution. It is not destroying its net asset value, but the fund might still cut its distribution if its net realized gains decline.
Valuation
As of December 29, 2023 (the most recent period for which data is available as of the time of writing), the SRH Total Return Fund has a net asset value of $17.39 per share but the shares trade for $13.84 each. This is an enormous 20.41% discount on net asset value at the current price. This is relatively in line with the 20.26% discount that the fund’s shares have averaged over the past month. This also represents one of the largest discounts that I have ever seen a closed-end fund possess. As such, the current price looks reasonable if you want to buy this fund for some reason.
Conclusion
In conclusion, the SRH Total Return Fund is probably one of the more unusual funds in the market as it is basically using a buy-and-hold strategy involving only a few stocks. Unfortunately, this does not give it any real advantages. The fund consistently underperforms both the S&P 500 Index and the one single company that accounts for well over a quarter of its assets. It also does not have an attractive enough yield to overlook the underperformance.
In short, there is no reason to own SRH Total Return Fund, Inc instead of just buying Berkshire Hathaway or an index fund. It is probably best to take advantage of the recent strength in the share price to unload in favor of better options.
For further details see:
STEW: Sell This Underperforming Low-Yield Fund