SUPN - Supernus: Product Sales Stretching Higher But Not Reflected In Economic Leverage
2023-09-01 22:07:06 ET
Summary
- Supernus Pharmaceuticals specializes in developing and commercializing treatments for CNS disorders, with 8 commercial products in the market.
- The company's Q2 FY'23 revenues declined by 20% due to a decrease in Trokendi XR product sales.
- Economic considerations show that while the company has a high return on investment, it requires significant reinvestment to sustain growth, limiting cash flow to shareholders.
- Net-net, initiate hold.
Investment Briefing
Supernus Pharmaceuticals, Inc. ( SUPN ) is a biopharmaceutical company that specializes in developing and commercializing treatments for central nervous system ("CNS") disorders. The company's neuroscience portfolio comprises a range of approved treatments for epilepsy, migraine, attention-deficit hyperactivity disorder ("ADHD"), and hypomobility in Parkinson's Disease ("PD"). It currently has 8 commercial products in the market.
On examination, SUPN has many potentially attractive investment features. But these are offset by the economic realities faced by the business. Chiefly, it would appear that 1) the company's growth potential is already priced into current market values, and 2) without additional product launches, it may face a lack of opportunities to deploy surplus capital.
This report will unpack all the moving parts of the SUPN investment debate, and link this back to why, in my estimation, the company is not an investment grade name right now. Net-net, I initiate coverage at a hold for SUPN, looking to a $975—$1Bn market value.
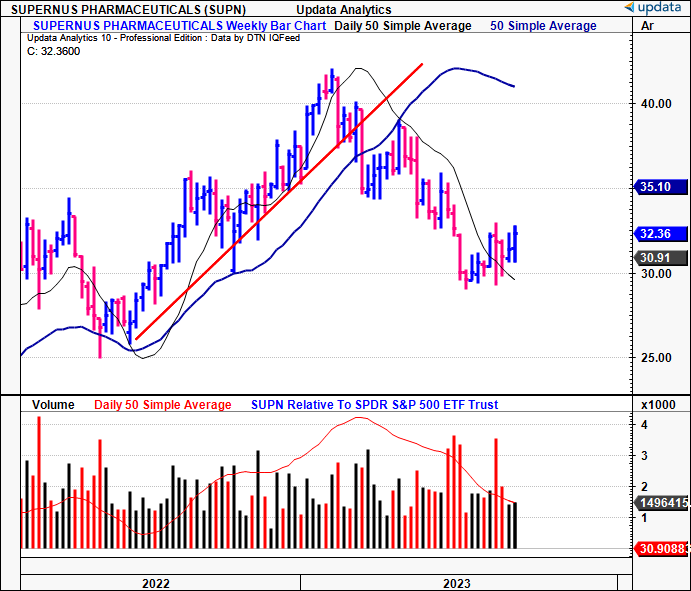
Figure 1.
Critical factors to investment debate
1. Q2 FY'23 insights
SUPN's Q2 revenue declined to $135.5mm from $170.1mm in Q2 last year, a 20% decline. The snip in turnover was underscored a decrease in Trokendi XR product sales, offset by the rest of the product portfolio. Critically, product sales contributed $128.3mm to the top line, while the rest, $7.2mm was earned on royalty revenue. Excluding the impact from Trokendi XR , revenues actually increased by 18% YoY.
As a result of the revenue headwind, management left guidance for FY'23 unchanged. It forecasts revenue between $580mm—$620mm, on OpEx of $450mm—$480mm, and an operating loss of $10mm—$30mm. Adjusting for R&D and it is eyeing a range of ~$100mm.
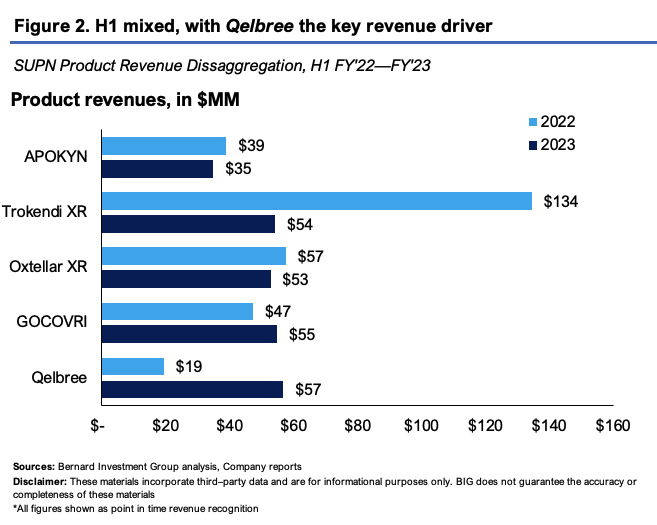
The divisional breakdown of SUPN's product revenues includes the following:
- Its Qelbree and GOCOVRI labels continued their growth route with a combined sales of $60mm, up 67%YoY. Qelbree's growth can be attributed to various factors, including:
- A 12% increase in the average total daily dose ("ATDD") and >30% of prescriptions exceeding 300mg per day, a 6-point gain. More mg's out the door is akin to higher volumes, and supports the demand profile of the label.
- The gross-to-net figures also improved, leading to an average net price per prescription of $212, a 20% increase compared to Q2 last year.
- An expanded prescriber base to ~21,291, up 6.9% from Q1 this year. Driving the wider base was SUPN's increased capacity, its salesforce expansion, and seasonality (mainly back-to-school season).
- The GOCOVRI label put up sales of $29mm, growing 17% YoY. The label is now at an annualized run rate of ~$115mm—$120mm
- In contrast, its Oxtellar XR line did $24mm of business during the quarter, down from $30mm last year. SUPN wasn't immune to industry-wide pressures in its Oxtellar segment. Customers are destocking inventories after over-stocking during the supply chain issues last year. This has reduced demand across core healthcare/pharmaceutical markets in FY'23. My estimations suggest this trend will diminish by FY'24.
- Trokendi XR sales were down $52mm YoY and clipped $19mm for the quarter. Trokendi was more sensitive to the price and sales erosion as it is now wrestling 3 generics in the market. Management therefore expects further sales erosion into H2 FY'23 and beyond.
2. Economic considerations
The following section performs a deep dive in the company's economic growth levers. I wanted to snake around the company's economics to see what kind of risk-capital SUPN can unlock into the future. Specifically, I'm looking at what kind of earnings are/can be produced off what level of capital is employed into the business (earnings power and asset factors). Then, we can relate this back to where SUPN sells today, to see if it's fair.
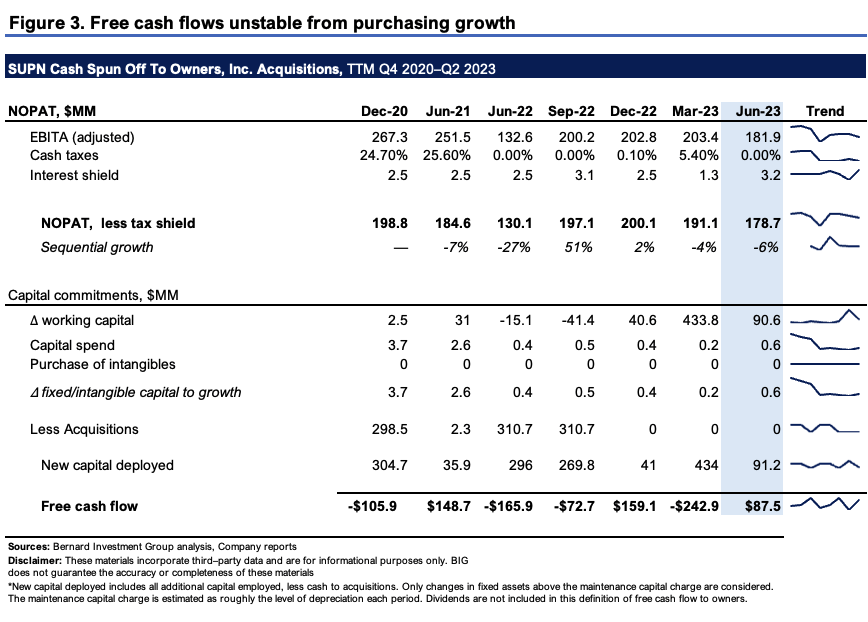
Figure 3 outlines the free cash flow SUPN has spun off to shareholders over rolling TTM periods from 2020–2023. Free cash flow is considered owner earnings here, and is calculated as the net operating profit after tax ("NOPAT"; also dubbed as "post-tax earnings" here) minus investments for future growth. All cash diverted to acquisitions is included in this representation.
Two things are obvious from Figure 3. One is that SUPN's free cash flows have been unstable over the last 2.5 years when factoring in acquisitions, where it has bought growth. Things are much rosier when stripping acquisition charges out, but this wouldn't be as clean a measure of its bottom-line fundamentals in my view. Nor would it fully capture the investment side of the FCF equation.
The second is that the company's working capital requirements have ratcheted higher over the last year or so since 2022 (TTM figures). Most of this has been in inventory upticks and growth to the receivables account. Critically, I've also included changes in marketable securities here as 'investment' to capture the cash flows employed on a more accurate basis. The $433mm NWC increase in March 2023 stemmed from capital allocations to marketable securities.
A third point that's worth noting is that its NOPAT clip has tightened on a sequential basis over the periods shown. Ideally, you'd see the growth numbers stretching up—that, or holding the fort as sales and capital allocations grow. As such, suspicions arise about what SUPN can generate moving forward.
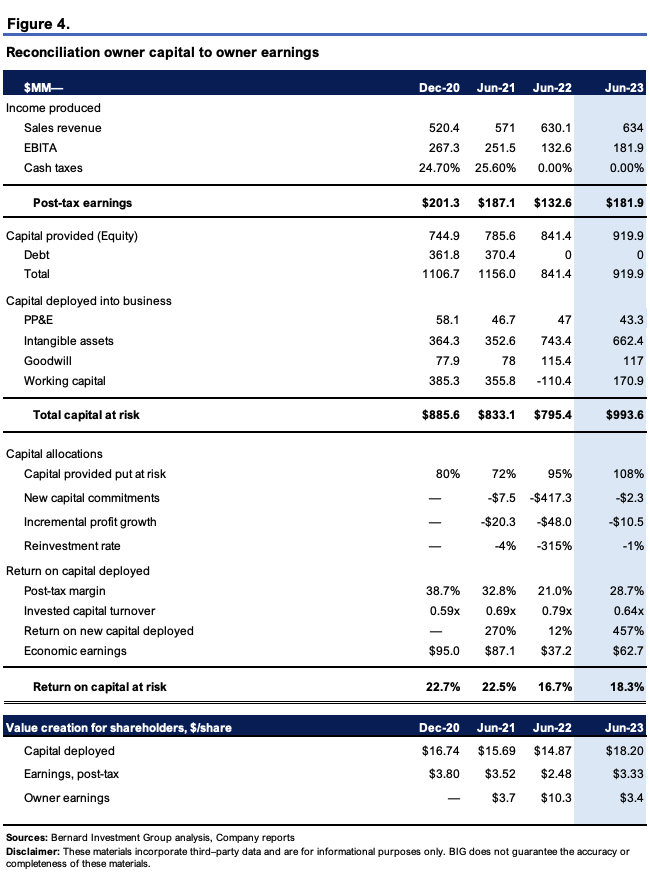
The above figures are transposed into the economic model outlined in Figure 4. Here, acquisitions are excluded from all calculus, to gauge the economic characteristics of the firm's core operations. Investors have provided SUPN with $920mm in capital as of Q2 FY'23 (debt, equity). It has put 108% of this at risk into the business.
Critically, the $993mm of invested capital produces $182mm in trailing post-tax earnings, both up from $133mm on $795mm capital invested. This equates to $18.20/share capital invested, producing $3.33 in earnings, 18.3% return on investment—up from 16.7% last year.
As is typically the case for pharmaceutical players, the high ROICs are driven by post-tax margins vs. capital turnover, at 28.7% margin for SUPN last quarter. This squares off with the economics of the business and the model. Products must move out the door, vs. tangible capital being utilized to produce sales and earnings (such as a warehouse). As a result, the company is, in one way, creating value for shareholders above long-term market rates of return (12% here representing long-term market averages).
It did also ~$63mm in economic earnings in Q2, up from $37mm last year. Economic earnings are compared to the 12% hurdle rate and recorded as a function of the capital required to produce them. Anything above a 12% return will register a profit, and vice-versa. Hence, Q2 sales were down, but economic profitability was up—a potentially bullish facts pattern.
Valuation
The stock sells at 18x forward earnings and 21x forward EBIT (note: these are adjusted figures). It is therefore trading roughly in line with the sector. The market has priced its net assets at $1.89 for every $1 in NAV as I write. Hence, priced in line with peers, with a small premium to net assets. The next question to decipher is, is this fair or underpriced.
Despite the strong returns on capital deployed, the company doesn't pay a dividend; hence to create value, it must have plenty of avenues to deploy its surplus cash flows at these high rates of return. Without that, it will lay stagnant in my view, growing sales and operating income, but the operating assets required to produce these will likely increase sharply as well, reducing the economic leverage. This would not be accretive to value.
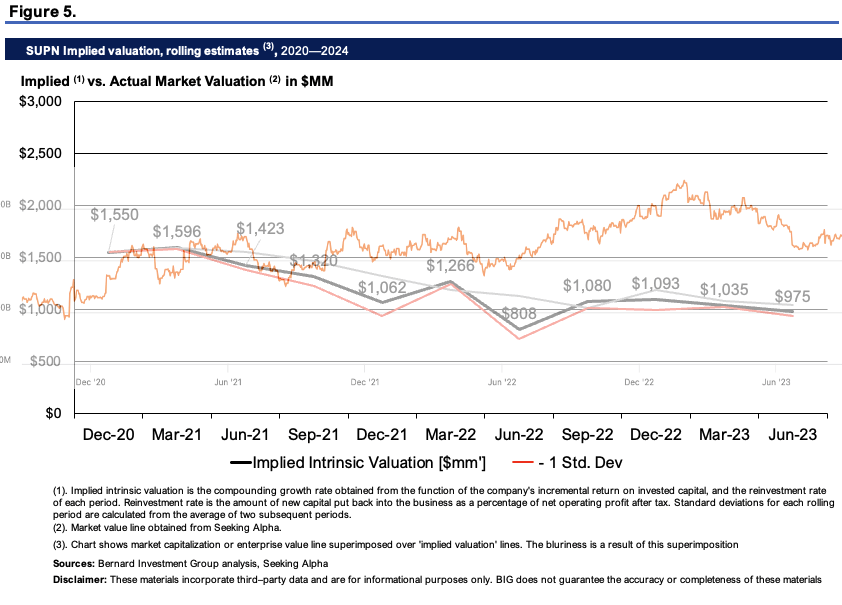
As a reminder, a firm can compound its intrinsic value at the function of its ROIC and what amount it invests at these rates. Applying this calculus to SUPN's equity line reveals a divergence from its current market price. It implies it might be ~38% overvalued given the inputs, and could be worth closer to $975mm in market value. This supports a neutral view.
To check the validity of Figure 5, I've used the ratio of SUPN's ROIC to the 12% hurdle rate as a kind of 'no growth' proxy, then compared this to where it sells at EV/invested capital ("EV/IC"). At a c.$1.6Bn EV to $993mm in capital at risk, the company trades at just 1.6x EV/IC. The ROIC/12% ratio is at 1.53x, a decent premium.
I look to companies priced at least 3x EV/IC to suggest the market values their operating capital highly. This suggests it sees strong earnings power to be produced on these assets.
But given what SUPN is producing at its current rate of investment, and how much it invests at these rates, it would appear growth has been fairly priced for the company right now, leaving just 5% prospective growth that isn't priced in (1.05x multiple). This also supports a neutral view and aligns with findings from Figure 5.
BIG Insights
In short
In summary, SUPN presents with a number of potentially attractive features to investment. However, these are offset by the economic realities of the company's operations. The capital required to run this business is ~$18/share and produces an attractive $3.33/share in post-tax earnings, >18% return on investment. Typical to the pharmaceuticals business, all of this is driven at the post-tax margin, vs. capital turns.
But the key issue uncovered here, is SUPN requires significant reinvestment of earnings if it is to grow (and grow in valuation). This will either 1) clamp the cash it can spin off to its shareholders, and/or 2) increase the required investment to maintain a higher set of operations. If it can get another 18% by investing more, that is attractive. But consider this. It took $993mm invested to produce $182mm after-tax. Say it wants to increase earnings by 50%, to $273mm. Based on the economics just shown, this will likely require another $495–$500mm investment to do so ($993x0.5 = $497), 1.8–2x the profit it would engender. Hence, it would appear there are more selective opportunities available to investors right now, supported by robust economic characteristics and creating immense value for their shareholders. Net-net, rate hold.
For further details see:
Supernus: Product Sales Stretching Higher, But Not Reflected In Economic Leverage