TBLD - TBLD: Diversified Exposure For Income-Oriented Investors
2023-11-22 14:14:03 ET
Summary
- Thornburg Income Builder Opportunities Trust has outperformed its peer group and several asset classes in 2023, with double-digit total returns year-to-date.
- TBLD offers an attractive investment opportunity for income-oriented investors looking for diversification, with nearly 70% of the stock allocated outside the U.S. and a distribution rate of nearly 8%.
- TBLD's performance has been positive on a relative basis, outpacing stock indexes and several asset classes, despite the challenging environment for allocation funds.
As much as other allocation funds, the Thornburg Income Builder Opportunities Trust (TBLD) has faced a challenging environment over the past couple of years, given the sharp price decline in many asset classes, notably in fixed income.
The silver lining for TBLD is that it has been able to outperform the peer group and several asset classes over the period and the performance in 2023 has been particularly strong, with double-digit total returns year-to-date.
With nearly 70% of the stock allocated outside the U.S. and a distribution rate of nearly 8%, I believe TBLD represents an attractive investment opportunity, particularly for income-oriented investors looking for diversification.
Fund Description & Highlights
TBLD's objective is to generate a monthly stream of income and additional total return through investment in a broad range of equities and debt securities located in the U.S. and globally.
The trust has an allocation strategy skewed to stocks, as can be noticed by its benchmark, which is comprised of 75% MSCI World Index and 25% Bloomberg U.S. Aggregate Bond Index. For context, The MSCI World Index is constituted of large and mid-cap stocks across 23 developed markets, while the latter tracks the performance of the U.S. investment-grade bond market.
The actual allocation of TBLD has not been as concentrated on the stock market though. As of Sep 30th, 2023, 57.2% of the trust was invested in stocks, dropping from 64.4% in March 2023. Meanwhile, as of Sep 30th, 2023, the fixed income portion of the portfolio was allocated as follows: 19.0% in corporate bonds, 8.9% in securitized assets, such as ABS and MBS, 2.0% in government bonds and 5.2% in cash and equivalents.
The trust has a weighted coupon of 5.05%, above the category average of 3.92%, and its average maturity is somewhat longer-dated than the category, as 29% of the portfolio's maturity is higher than 20 years, as opposed to the category's average of just 19%. The remainder of the portfolio is concentrated in maturities below 10 years, with 30% below 5 years and 33% in the range of 5-10 years.
Consistent with TBLD's relatively higher coupons, roughly 65% of the trust's fixed income assets are rated as B, BB or BBB, versus 30% of the category.
Regarding the equities' portfolio, nearly 30% of TBLD's exposure is in the United States, as opposed to the MSCI World Index, where the United States accounts for 69% of total equities.
From the sector allocation perspective, unlike most common stock indexes, where we see a growing exposure to the technology sector, TBLD's largest allocation is in the financial sector, with 23.8% of total equities, followed by information technology with 16.9%, communication services 11.3%, basic materials 9.9%, health care 9.7%, utilities 7.9%, consumer discretionary 7.4%, energy 7.1%, consumer staples 5.3% and industrials 0.5%.
The most significant distinctions relative to the MSCI World Index are the TBLD's overweight allocation on financials (+8.9%), basic materials (+5.8%), utilities (+5.3%), communication services (+4.0%) and its underweight exposure to industrials (-10.3%), information technology (-4.7%), consumer discretionary (-3.5%) and health care (-3.1%).
Relative to the S&P 500 index, TBLD's overweight allocations are even more pronounced in financials (+11.0%), basic materials (+7.5%), utilities (+5.5%) and energy (+4.6%), while the trust's underweight exposure to information technology (-10.6%), industrials (-7.8%), health care (-3.7%) and consumer discretionary (-3.3%) are also noticeable.
TBLD's website, MSCI and S&P indexes' websites, consolidated by the author
Regarding TBLD's individual stocks' allocation, its top ten constituents (Enel (ENLAY), NN Group (NNGRY), Meta Platforms (META), Pfizer (PFE), BHP (BHP), CME (CME), ING (ING), Cisco (CSCO), Mercedes-Benz (MBGYY) and Endesa) account for nearly 19.9% of its total equity exposure, and appears as a fairly diversified representation of the broader stock market. Meanwhile, the MSCI World Index's top ten holdings (Apple (AAPL), Microsoft (MSFT), Amazon (AMZN), Nvidia (NVDA), Alphabet Class A (GOOGL), Tesla (TSLA), Alphabet Class C (GOOG), Meta platforms, Exxon (XOM) and UnitedHealth (UNH)) are more concentrated on tech stocks, similarly to the S&P 500, and represent 20.0% of the index.
TBLD's overweight allocation to the financial sector, as well as its global stock exposure, which traditionally trades at lower multiples, resulted in lower valuations for the trust. On a P/E Forward basis, for instance, TBLD's multiple of 10.4 is well below the MSCI World Index's multiple of 15.5, and the S&P 500 multiple of nearly 17.5.
Positive Performance On A Relative Basis
It has been quite a challenging time for allocation funds, both globally and in the U.S., as many fixed-income asset classes have performed poorly over the past couple of years, despite the recovery this year.
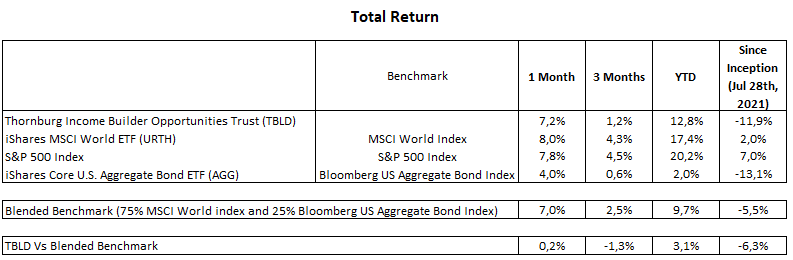
Against this backdrop, the performance of TBLD is still negative since its inception on Jul 28th, 2021, with a total return of -11.9%, while its two benchmarks, the MSCI World Index and Bloomberg US Aggregate Bond Index, have returned 2.0% and -13.1%, respectively, over the same period. As an additional remark, we adopted for this analysis the iShares MSCI World ETF (URTH) as the benchmark for the MSCI World Index and the iShares Core U.S. Aggregate Bond ETF (AGG) as the benchmark for the Bloomberg US Aggregate Bond Index.
As showed below, while TBLD has lagged the blended benchmark (75% MSCI World Index and 25% Bloomberg U.S. Aggregate Bond Index) since its inception, the trust is outperforming in 2023, with a rally of 12.8% year-to-date.
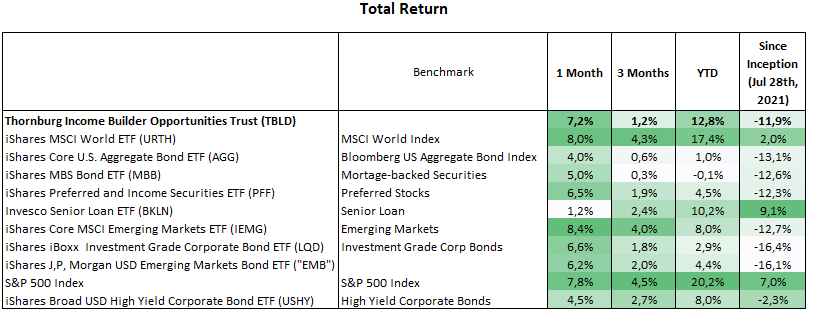
But taking into consideration the broader market, TBLD's performance has not been as bad, as most asset classes have not fully recovered from the dramatic drop in 2022. Looking at the following table, while TBLD has indeed underperformed stock indexes and some fixed-income securities, such as senior loans and high-yield corporate bonds, the trust has outpaced the performance of several asset classes, such as mortgage-backed securities, preferred stocks, emerging markets, and investment grade corporate bonds.
This mixed price action among asset classes has dragged down returns for the whole category of allocation funds. For context, in 2022, TBLD's NAV returned -13.62% versus -14.94% of the category (according to Morningstar website), while in 2023 the trust has risen 12.66% year-to-date compared to 9.49% of the category. This outperformance relative to its peers places TBLD in the second quartile within global allocation funds in 2022 and 2023.
That being said, although TBLD is a relatively new trust, based on the performance we have seen so far, it seems to me that TBLD's management team has been able to add value to investors, as the trust has outperformed the peer group and several asset classes in two quite different years. The year 2022 was marked by a plunge in many asset prices, while in 2023 we experienced a rebound, especially in the stock market.
Well-Covered Distributions So Far
The income generated by TBLD's invested portfolio consists of the equities' dividend, currently yielding nearly 5.65%, and the distribution from fixed-income assets, which have a weighted coupon of roughly 5.05%. This constitutes a substantial portion of the trust's annual distributions. The remaining portion should come from capital gains and, if necessary, the return of capital to shareholders, in order to complete the trust's annual distribution of nearly 8.37% based on the current price level.
As a reference, according to the fund's semi-annual report for the six-month period finished on March 31st, 2023, the fund generated $4.99 million through dividends and $4.18 million through interest income, totaling an investment income of $9.06 million. After netting out $4.37 million relative to net expenses during the period, net investment income was $4.68 million.
In addition, there was a net realized gain from investments of $14.73 million and gains from options written of $4.04 million. After deducting foreign currency transaction losses of $1.13 million, the net realized gain in the period was $ 17.64 million.
As the distribution in the period was $20.05 million, the fund was able to cover the distribution and had $2.27 million left from realized gains.
For the year 2023, monthly distributions remain at $0.1042 per share, having totaled $1.1462 year-to-date. Of those, $0.5110 (44.6%) was distributed as income, $0.2470 (21.5%) as short-term capital gain, $0.2084 (18.2%) as long-term capital gain and $0.1797 (15.7%) as return of capital.
This distribution profile in 2023 is consistent with the strong TLBD's NAV gain year-to-date. As such, capital gains represented nearly 40% of total distributions and just 15% was needed as return of capital.
That said, while we cannot expect that yearly double-digit total return is the norm for the trust, my view is that income plus capital gains are expected to remain as major contributors for distributions over time. On the flip side, premiums collected from options written can be another source of income during times of market weakness, mitigating the need of a more substantial return of capital or even distribution cuts.
Price/NAV Discount At Neutral Levels
Following the recent rally in the broader market, the discount in shares of TBLD versus its Net Asset Value has just narrowed, as expected. Now the discount appears at neutral levels at -14.05% and a new catalyst is necessary to drive a meaningful change in the price/NAV.
On the one hand, the share price is close to a short-term top toward the 18.0 level and a continuation of the rally seems necessary to break out this level. On the other hand, as the macroeconomic environment remains a key concern for investors, any deterioration of the outlook can lead to a market sell-off. If it occurs, we are likely to see discounts widening again.
Either way, while the current discount seems not compelling for the time being, I see the investment in TBLD as an opportunity for diversification, with 70% of the stocks allocated outside the U.S., where valuations are lower and less concentrated on the technology sector.
On top of that, with the invested portfolio yielding nearly 5% and using options written as an additional source of income, I believe the likelihood of a distribution cut is fairly low, absent a severe market correction we may face down the road.
For further details see:
TBLD: Diversified Exposure For Income-Oriented Investors