ROST - The $300K IG SWAN Portfolio (One Year Later)
2023-10-09 01:49:56 ET
Summary
- One year later, the total return of my managed $300K IG SWAN portfolio was just over 3%.
- Despite getting the duration call, on the 5 YR U.S. Treasury, to the tune of 83 Bps, the underlying credit spreads and earned interest more than offset it.
- The word 'SWAN' is overly used and too loosely. Many high-yielding dividend stocks haven't held up or experienced big drawdowns - not SWAN-like. IG bonds are safer.
On behalf of my parents, in late September 2022, I was asked to construct a $300K high-quality intermediate duration investment grade bond portfolio, in a taxable account. The idea was to take advantage of the rapid rise in short-term interest rates and pick up some incremental yield. In other words, my mandate was to generate safe and reliable income, with very limited drawdowns of the portfolio's principal. Given the big move up in interest rates, it felt like for the first time in ages, we were finally getting paid a respectable (portfolio blended) 5.21% yield on this pool of capital. Moreover, to be crystal clear this portfolio was expressly designed to be a buy-and-hold portfolio and the idea is the principal would be money good as well as avoid big drawdowns of the portfolio's principal.
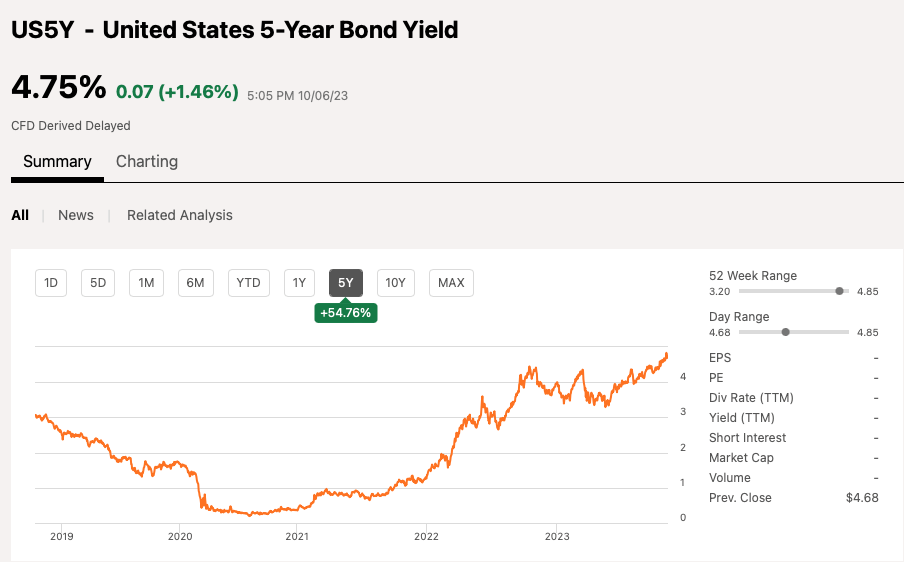
On October 5, 2022, I put to work $250K worth of capital. The money was put to work in the morning when the yield on the 5-year U.S. Treasury was roughly 3.92%. A second smaller tranche of capital, $50K, was put to work on October 21, 2022. That day, the 5-year U.S. Treasury was trading around 4.4%, at mid-day, when the second, much smaller batch of bonds was added to the portfolio.
Lo and behold, since constructing this portfolio, the 5-year treasury yields have been extremely volatile. The 5 YR Treasury bond traded back down to 3.50%, in February 2023 and spent a few months between 3.20% to 3.75%-ish (from April - May 2023). However, since August 2023, yields have been climbing at a steady pace and closed at 4.75%, as of October 6, 2023.
Just to reiterate, 5/6th of the capital was invested when the 5 YR U.S Treasury was yielding 3.92%, which means, through October 6, 2023, I'm on the wrong side duration, to the tune of 83 Bps! And even the second tranche, put to work, when the 5-year was trading at 4.4%, has experienced 35 Bps of treasury yields going the wrong way.
Believe it or not, though, and despite getting the duration call wrong, at least as of October 6, 2023, the portfolio has held up really well. Further, this is purely a buy-and-hold portfolio, meaning we didn't liquidate the portfolio when 5 YR U.S. Treasury was trading in the 3.20s, to capture the then-high watermark of unrealized gains ($12K), because that isn't our strategy. For perspective, there can be a decent bid / ask spread in corporate bonds, depending on the average daily liquidity for a particular bond issue (cusip), which is also related to the issuance size (amount of the bond outstanding) of a particular bond cusip. Secondly, we can't be bothered with the portfolio drag of having to pay short-term capital gains and trying to time markets and reinvest back in.
So despite getting the duration call wrong, at least measured at a moment in time, or as of October 6, 2023, in this case, the portfolio has performed well because of the rally in corporate bond spreads (of the underlying credits). Moreover, given this exceptionally difficult overall market for both bonds and stocks, arguably there is a flight to quality, which creates strong demand for high-quality investment grade paper.
As a quick aside for people not well versed in bonds, a corporate bond trades at a credit spread to treasuries (you match the maturity dates of the corporate with the treasury bond, to match duration). For example, when we bought the Lennar Corp ( LEN ) bonds, the yield to maturity was 6.08%, which was then about a +218 Bps spread to the 5-year U.S. Treasury. Despite the 5 YR U.S. Treasury increasing in yield, by 83 Bps, we have an unrealized gain on the Lennar Corporation 4.75% 11/29/2027 bond. Meaning the perceived credit default risk for Lennar has greatly diminished, more than offsetting getting the duration call wrong.
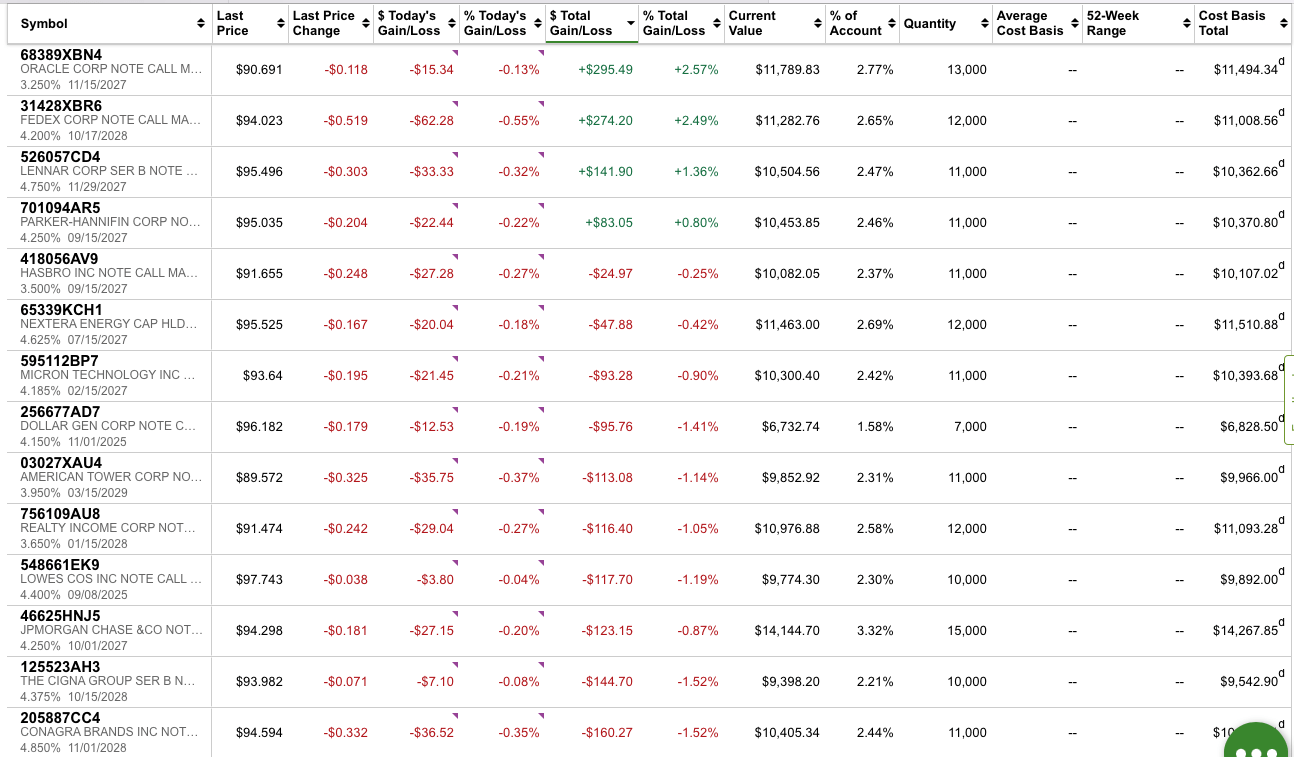
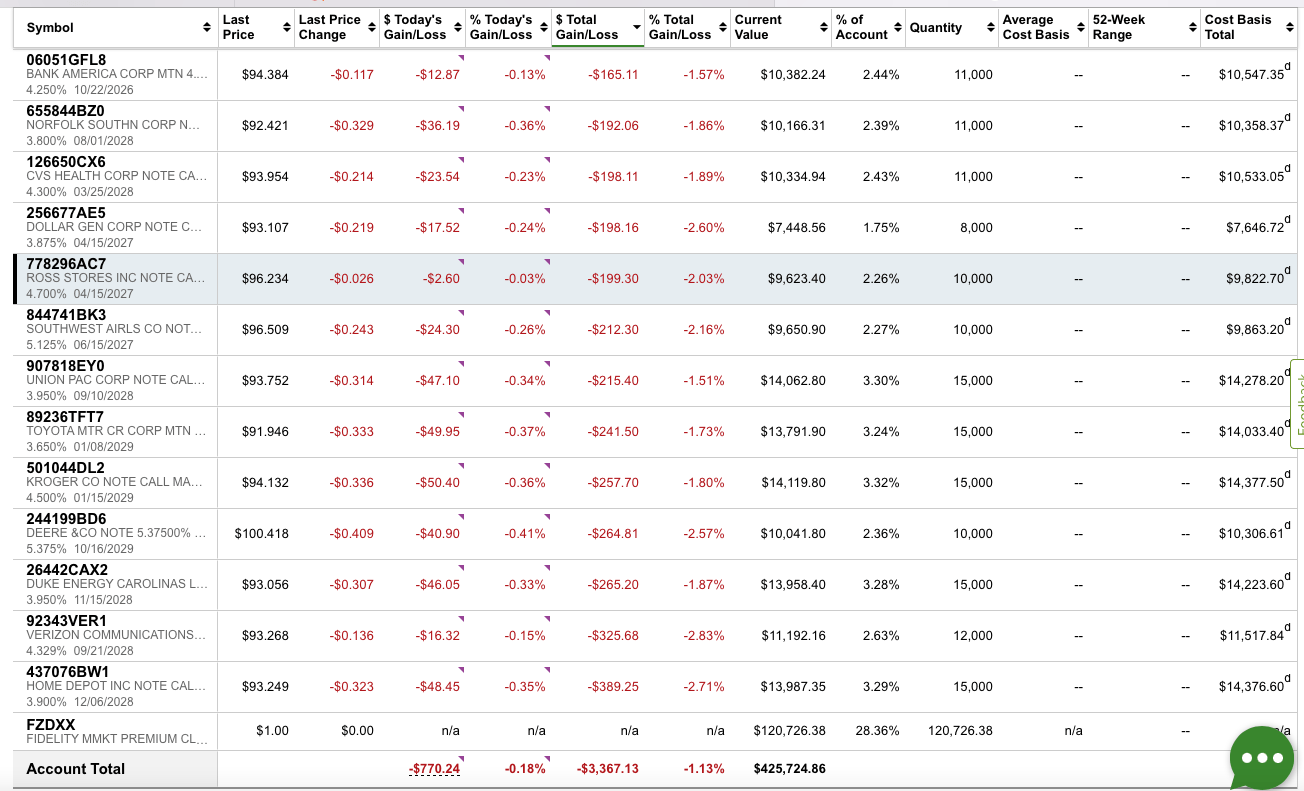
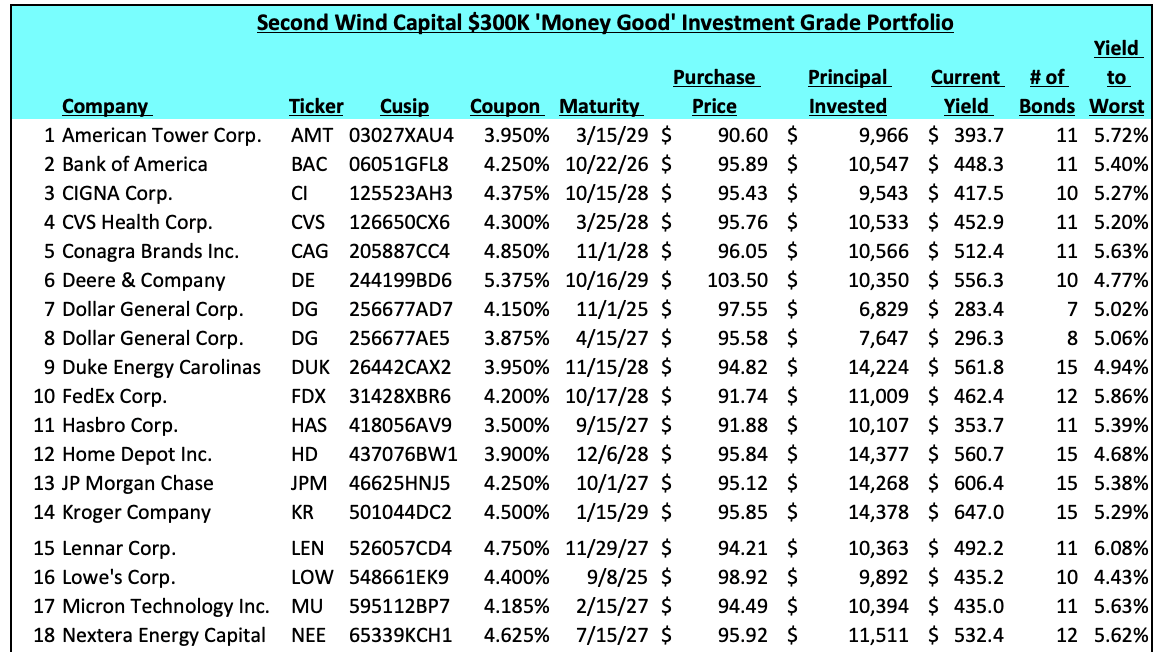
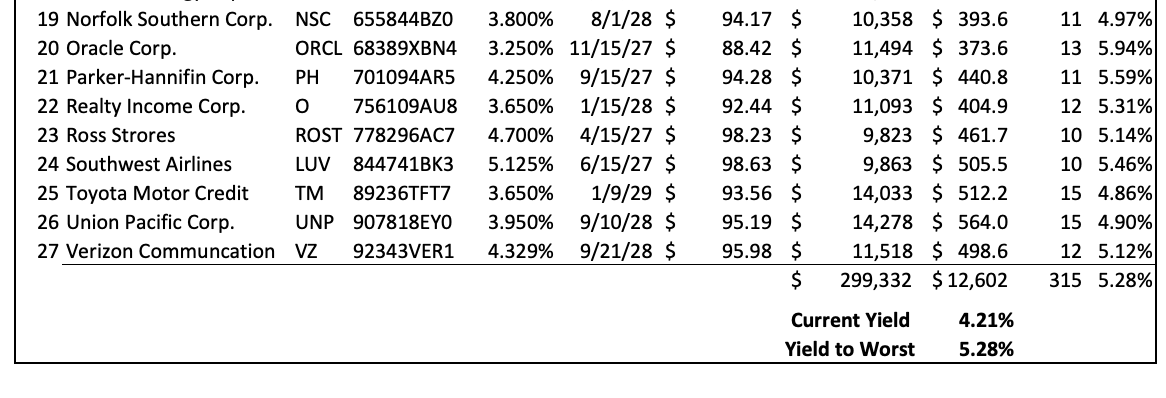
Enclosed below is the mark-to-market snapshot of the portfolio of the bonds, as of the October 6, 2023 close.
On $300K of principal invested, the value of the IG bond portfolio, is down $3,367 or 1.13%, as of October 6, 2023.
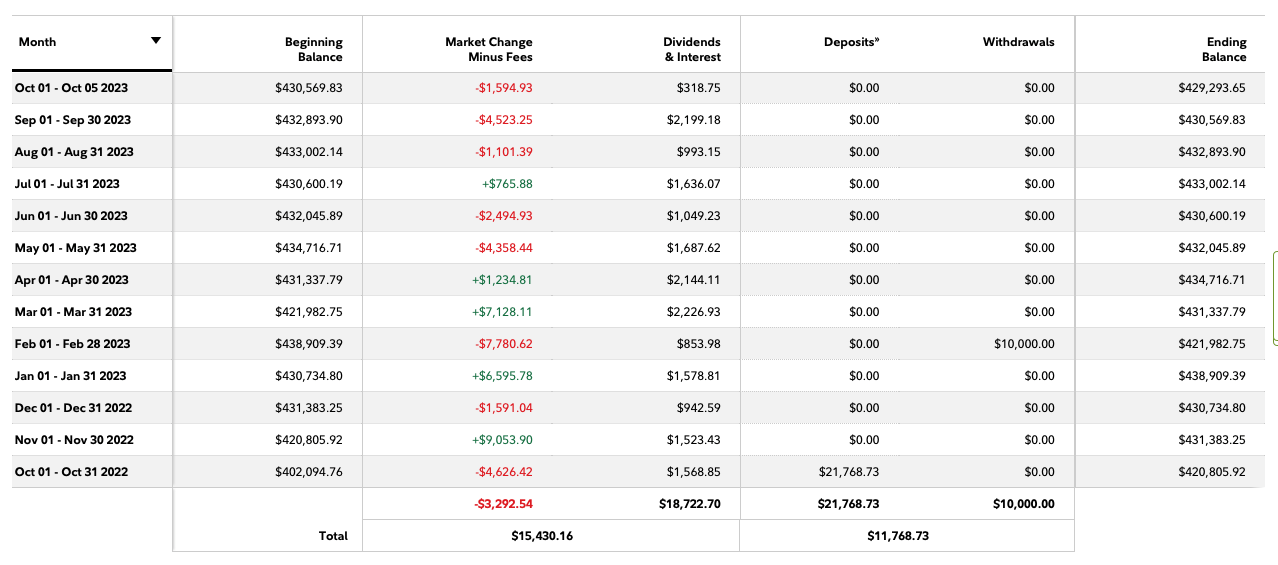
Enclosed below is the one-year performance tracker, so people can see all the coupons have been paid.
Unfortunately, though, Fidelity performance tracker isn't really designed for closely tracking a bond portfolio, so coupon payments and interest earned on idle cash, especially considering the attractive money market rates get blended.
Therefore, it is easier to track annual interest earned via the semi-annual coupons via this spreadsheet I created.
See below:
Therefore, from October 5, 2022 - October 6, 2023 (as $250K out of $300K was put to work on October 5, 2022), the total return of the IG SWAN portfolio is ((+$12,602 in coupon payments - $3,367 in mark to market portfolio drawdown) / $299,332 in starting principal = 3.085%.
For perspective, the current duration on a 5 YR U.S. Treasury is about 4.2. This means for a one percent move in interest, the underlying value of the bonds, in the short term, will move up or down by 4.2%.
The reason the IG bond portfolio performed better than treasuries is because the blended credit spread was 121 Bps over treasuries.
5.21% - 3.92% =1.29% x (5/6) = 107.5 Bps
5.21% - 4.40% = 0.81% x (1/6) =13.5 Bps
I'm Not Throwing Rock From A Glass House
If you're familiar with my work, the vast majority of my time is spent picking stocks and managing two small-cap value portfolios. This is a completely different go-to-market strategy and has a much higher risk profile. Given this higher risk profile, I expressly never actively court or even really mention the word 'retirees' in any of my small-cap value articles or communications. Candidly, I don't want the awesome responsibility that comes with trying to help retirees find safe and reliable income (the REITs or Dividend cohorts of investors) while avoiding the drawdowns. And let's face it, this has been an exceptionally difficult task, in this rising rate environment. Moreover, and perhaps rightly so, it is almost impossible to reach for yield while simultaneously avoiding both risking principal and decent-sized drawdowns.
As a quick aside, in my small-cap value strategy, which I've iterated and honed over many years, and it is still a work in progress, the idea here is high conviction and a concentrated portfolio, consisting of at least 8 to no more than 15 stocks. Where I've, at least historically, and admittedly the market has been exceptionally tough from August 1, 2023 - October 6, 2023, been able to generate real alpha has been by taking advantage of the significant market inefficiencies in the sub-$500 million market capitalization universe. This includes doing a lot of bottoms up fundamental work on the underlying businesses, speaking with management teams, and innately being able to weather stomach big drawdowns given the higher Beta that goes along with table stakes of playing in small-cap land. You can be a good stock picker, but if you don't have the mettle to handle the big drawdown, and they can really get amplified in small caps, you really can't run this type of strategy.
The other element of the secret sauce is understanding that slugging percentage matters, so if one or two of your Top 5 largest sized stocks (and I usually weight my Top 3 names at 15% each, and 4th and 5th largest names at roughly 10%, each), perform really well then this can drive the alpha and deliver overall portfolio outperformance. Moreover, as part of the strategy, many other investments could perform poorly, but hopefully, they are smaller weighted (3% to 5% sized bets).
Again, in terms of not throwing rocks and living in a glass house reference, after being up north of 60% (and closer to the upper 60%) YTD through July 31, 2023, like so many other stock pickers, I've struggled of late. Candidly, from August 1, 2023 - October 6, 2023, I too have experienced a big portfolio drawdown. During this drawdown, the portfolio has given back a lot of year-to-date outperformance. And as of October 6, 2023, the two small-cap value portfolios are only up about 35%. So trust me, as I embark on this next section of this article, I too am feeling the pain. This is by no means schadenfreude or anything of the sort. Instead, it is explaining the word SWAN, at least in my view, has been overly used and too loosely thrown about when describing higher-yielding equity (or equity-like vehicles) purportedly designed for retirees.
It's Been An Exceptionally Difficult To Period To Manage Retirees Portfolios
Candidly, for people that are intellectually honest and truly have retirees' best interests in mind, over the last twelve months, I can't imagine a more difficult a period it has been for money managers that mostly only manage portfolios for retirees. The rapid rise in interest rates has meant the tide has gone out (a great Warren Buffett phrase) and so many purportedly safe dividend-paying stocks have got smashed on the rock and washed up on shore during this firestorm of market conditions. Essentially, given the rapid rise in U.S. Treasuries, the relative attractiveness of even say a Blue Chip dividend stock, yielding 3% or 4%, get diminished. And if also has a lot of refinancing risks, with a lot of near-term bond maturities, especially for leveraged companies, this also leads to multiple comprehension. This in turn means go forward cash interest expense is climbing quickly and this reduces the amount of free cash flow left over to pay out dividends and reinvest back into the businesses or de-leverage the balance sheets (given the new and much less attractive funding environment for large debt issuers).
Said differently, when rates were so low, for so long, you had crazy multiple expansion as the relative attractiveness of the dividends and cheap debt financing options meant record earnings. Another way to think about it is investors were paying peak multiples for arguably peak earnings. That is a bad recipe for future capital appreciation or even capital preservation, for that matter, of hard-earned retirement nest eggs.
How The Equities Have Performed
Let's start by looking at the total returns of the equities held in this bond portfolio. This measures total return from October 5, 2022, through October 6, 2023.
- American Tower Corporation ( AMT ): $159.57 - $214.14 +6.25 (dividends) = -28.4% total return
- Bank of America ( BAC ): $26.07 - $31.92 + 0.90 (dividends) = -15.5% total return
- The Cigna Group ( CI ): $288.23 - $294.03 + $4.92 (dividends) = -0.1% total return
- CVS Health Corporation ( CVS ): $69.90 - $100.45 + $2.42 (dividends) = -28% total return
- Conagra Brands, Inc. ( CAG ): $26.41 - $33.8 + $1.34 (dividends) = -17.9% total return
- Deere & Company ( DE ): $378.54 - $355.57 + $4.95 (dividends) = +7.9% total return
- Dollar General Corporation ( DG ): $103.67 - $242.7 + $2.32 (dividends) = -56.3% total return
- Duke Energy Corporation ( DUK ): $86.92 - $94.02 + $4.04 (dividends) = -3.3% total return
- FedEx Corporation ( FDX ): $257.9 - $156.87 + $4.82 (dividends) = +67.5% total return
- The Home Depot, Inc. ( HD ): $292.82 - $289.56 + $8.16 (dividends) = +3.9% total return
- JPMorgan Chase & Co. ( JPM ): $145.1 - $110.39 + $4.05 (dividends) = +35.1% total return
- The Kroger Co. ( KR ): $43.35 - $44.6 + $1.07 (dividends) = 0.0% total return
- Lennar Corporation ( LEN ): $109.22 - $79.85 + $1.50 (dividends) = +38.7% total return
- Lowe's Corporation ( LOW ): $199.54 - $199.03 + $4.25 (dividends) = +0.2% total return
- Micron Technology, Inc. ( MU ): $69.96 - $54.73 + $0.46 (dividends) = +28.7% total return
- NextEra Energy, Inc. ( NEE ): $50.24 - $81.77 + $1.83 (dividends) = -36.3% total return
- Norfolk Southern Corporation ( NSC ): $191.51 - $221.02 + $5.29
- (dividends) = -11% total return
- Oracle Corporation ( ORCL ): $109.96 - $66.64 + $1.52 (dividends) = +67.3% total return
- Parker-Hannifin Corporation ( PH ): $391.72 - $263.19 + $5.62 (dividends) = +51% total return
- Realty Income Corporation ( O ): $50.11 - $59.52 + $3.05 (dividends) = -10.7% total return
- Ross Stores, Inc. ( ROST ): $112.38 - $89.92 + $1.315 (dividends) = +26.4% total return
- Southwest Airlines Co. ( LUV ): $27.08 - $32.99 + $0.72 (dividends) = -15.7% total return
- Toyota Motor Corporation ( TM ): $173.18 - $138.09 = +20.3% total return
- Union Pacific Corporation ( UNP ): $202.46 - $200.62 + $5.2 (dividends) = 0.4% total return
- Verizon Communications Inc. ( VZ ): $30.85 - $39.4 + $2.624 (dividends) = -15% total return
Although I feel very strongly about the credit quality of the companies contained within my bespoke $300K IG SWAN portfolio, look at the wild divergence in total returns, on the equity side, measured during the same one-year stretch of time (October 5, 2022 - October 6, 2023).
Tough Sledding Out There
And unfortunately for retirees, and I sure hope these investments were sized small, enclosed below are a few examples of companies that were highly touted for retirees and that have struggled to really struggled.
- Medical Properties Trust, Inc. ( MPW ): $11.40 - $5.1 + $1.02 (dividends) = -46.3% total return
- W. P. Carey Inc. ( WPC ): $52.53 - $73.55 + $4.27 (dividends) = -22.8% total return
- NextEra Energy Partners, LP ( NEP ): $22.55 - $75.75 + $3.29 (dividends) = -65.9% total return
- British American Tobacco p.l.c. ( BTI ): $30.5 - $37.04 + $2.84 (dividends) = -10% total return
- Algonquin Power & Utilities Corp. ( AQN ): $5.77 - $11.34 + 0.508 (dividends) = -44.6%
Putting It All Together
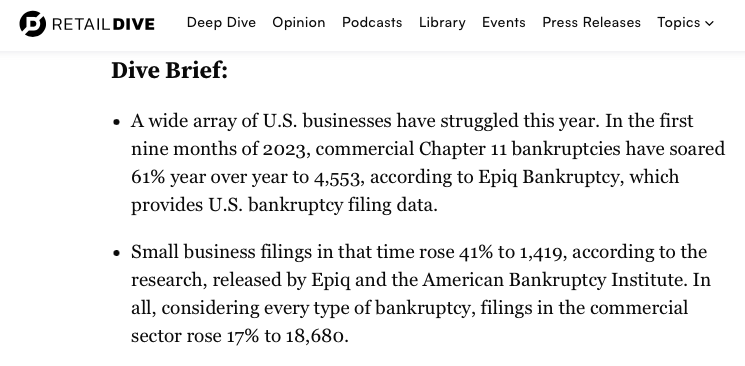
I don't envy financial advisors that are charged with helping risk-averse and drawdown-sensitive retirees navigate this exceptionally tricky market environment. However, I think and I've tried to express this, at least on a few occasions, when discussing this $300K IG SWAN portfolio, now is a very attractive time to be putting money to work in corporate bonds. Everyone's situation is unique and the duration preferences will certainly vary, but the 10YR hasn't had this high a yield since the mid-2000s. I would argue the Fed's potent medicine risks killing the patient, meaning there is a decent possibility of a recession, and I find it hard to believe the Fed won't (eventually) be forced to pivot and start cutting rates in that scenario (maybe by Q2 2024). In fact, there was an informative article, published on October 4, 2023, by Retail Dive, highlighting how Chapter 11 filing has increased markedly. Perhaps, evidence the Fed has gone too strong with the 5.5% Fed Funds moonshine.
Credit card delinquencies are rising and credit card debt has eclipsed $1 trillion. A 30-Year mortgage is approaching 8% for borrowers with strong credit scores. So many small caps that I follow are already pricing in a strong probability of a recession. Therefore, call it cognitive dissonance on my part, but what bond market is pricing in and what small caps are pricing in are radically different.
Circling back, I just hope retirees are considering the risk associated with many of these high-yielding dividend stocks that are frequently touted. I'm sure a select few might in fact be the goods and end up performing nicely over the next five years. That said, and we've already witnessed a number of big blow-ups, usually when a dividend gets slashed, perhaps some of the risk associated with these high-yielding dividends stocks wasn't fully stressed tested. Either way, my message is simple, it is high time to build or add to a diversified investment grade corporate bond portfolio. Locking in a blended 5.25% to 6.5% portfolio (depending on how you build it), with very minimal drawdowns, and a high probability of getting your principal back, at par, upon maturity seems like a truer and frankly better definition of a SWAN like portfolio. I'm not sure how low these juicy yields will be available, so I'm arguing now looks really attractive.
For further details see:
The $300K IG SWAN Portfolio (One Year Later)