CHI - The 8% Income Portfolio: 2022 Year-End Review
Summary
- Presenting our 2022 year-end review of our 8% Income Portfolio.
- This high-income portfolio earned over $29,000 in distributions (including year-end special distributions) amounting to over 14% yield-on-cost basis.
- The portfolio had a loss of -12.5% in 2022, compared to -18.2% for the S&P 500 and -16.2% for a typical stock-bond portfolio.
- We will provide updates on recent buys, dividends collected, and overall performance. As usual, we will compare the performance with a traditional 60:40 stock/bond portfolio.
This income-centric portfolio was launched in October 2014 with two simple goals. The primary goal of this portfolio was to provide roughly an 8% income while preserving the capital. The secondary goal was to provide some reasonable capital appreciation over the long term. This portfolio has completed a total of eight years now, and we have provided its progress periodically on public Seeking Alpha.
In our view, our "8% Income Portfolio" has continued to perform reasonably well under many different circumstances during the last eight years. Obviously, the year 2022 had been a tough one for most portfolios. The broader market and mostly all other assets, including bonds, crashed in 2022. Our portfolio was no exception, but even then, it has lost much less compared to the S&P500. Our 8%-Income portfolio lost roughly -12.5% compared to -18.2% for the S&P500 and -16.2% for a typical 60:40 Stock-Bond portfolio. It may be appropriate to mention here that we have maintained a 10 to 12% plus cash reserves most times. Even though it has been a drag on the performance during boom times, at the same time, during the rough patches like the year 2022 and during the pandemic crash of 2020, it has been helpful to reduce volatility and contributed to overall better performance than the broader market.
Based on 2022 numbers, this portfolio provided a 14.5% yield on the cost basis and a 9% yield on the current market value of the portfolio. Since its inception in Oct. 2014, until the end of 2021, the portfolio has provided an annualized gain of about 10%. However, 2022 has put a serious dent in the overall returns/performance, and the annualized gain until 2022 works out to be much lower at about 8.0%.
In the meantime, in spite of the challenges, there has been no shortfall in income. After all, that's the primary objective of this portfolio. We think this portfolio is suitable even for many conservative investors, including retirees if they need income. However, we only recommend less than a quarter (25%) of the capital to this kind of portfolio. We generally advocate a multi-bucket diversified portfolio. This "8% Income Portfolio" represents one of the important buckets in our overall investment strategy. This portfolio takes most of the risk while providing most of the income in our otherwise conservative strategy. Even though many folks would associate an all-CEF portfolio with a risky portfolio, a small exposure could still be appropriate for most investors. We find that the consistently high distributions/income reduce the volatility and improve the overall returns that are generally comparable to the broader market. In addition, our large cash reserve of 12% affords us an opportunity to go bargain hunting at times.
As is true in most areas of life, one should pay attention to the right proportions. How much exposure (to a portfolio like this) would be appropriate for an individual? It would depend on the individual's goals, risk tolerance, and personal situation. Please see our allocation model at the end of the article.
If you are interested in the history of this portfolio, you can read our original introductory article from 2014 here . You also could search for all the updates on our Profile page.
Performance Snapshot:
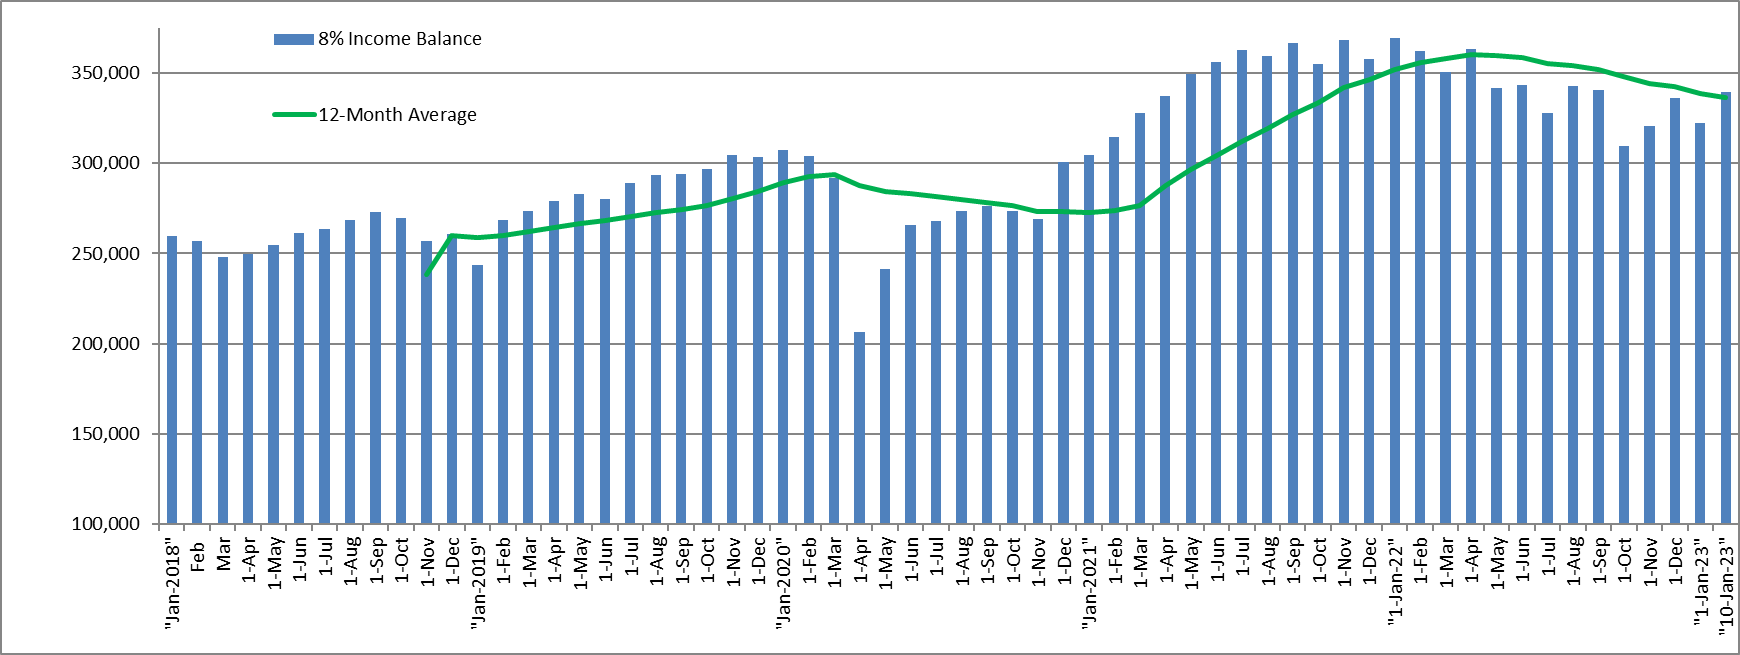
The chart below shows the performance of the 8% Income Portfolio during the period from January 2018 to Dec. 31, 2022. The movement of the portfolio was similar to the broader market but with much less volatility. The reasons for lower volatility are 10%-12% cash in the portfolio and the constant flow of over 8% distributions.
Chart-1:
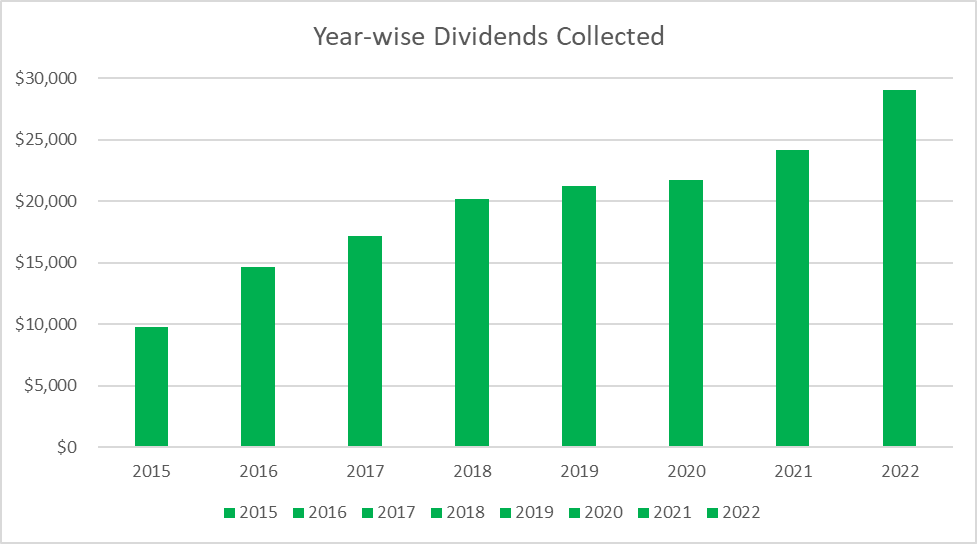
True to its name, this portfolio has continued to generate high income, thus meeting its primary goal. Sure, a few funds did cut their distributions in 2020, but we would call them minor adjustments. Moreover, many of them increased the distributions in 2021, and our total income from the portfolio has grown consistently over the years.
Chart 1A: Year-wise Dividends/Distributions
Note: For the year 2015, the initial investments were still being made and deployed. No additional contributions were made after 2015. However, subsequently, the dividends were collected and reinvested periodically.
We recognize that the total return of the portfolio is important to many folks; however, for this portfolio, it's a secondary goal to us. We know that the stock market never moves in a straight line, and there will be ups and downs along the way, as shown by the first chart. In fact, we should take advantage of lower prices when substantial discounts are available.
Some Background:
Here's some brief background for the new readers. A total amount of $100,000 was initially allocated to the portfolio, and another $100,000 was contributed in the next 12 months ($8,333 in 12 installments). No more fresh money was added thereafter.
Cash Added/Contributed:
| Initial Investment 10/17/2014: |
| $100,000 |
| From Nov. 1, 2014 until Oct. 1, 2015 |
| $100,000 |
| 12 installments of $8333.33 |
| TOTAL Contribution (Cost basis) |
| $200,000 |
The primary goal of this portfolio was to provide a durable income stream in good times and bad. The investment strategy was to utilize closed-end funds ("CEFs"), which generally use some amount of leverage to generate high distributions. To start with, initially, we had chosen to invest in as many as 13 funds (11 CEFs, one ETN, and one ETF) to provide us broad diversification, high distributions, and exposure to different types of assets such as equity, bonds/credit securities, utility, infrastructure, energy MLPs, preferred income, floating-rate income, technology, healthcare, etc. Subsequently, during the following years, we added many more funds and a few individual company stocks to the portfolio from the BDC/mREIT/ MLP sectors. However, these individual stocks form only about 10% of the portfolio size.
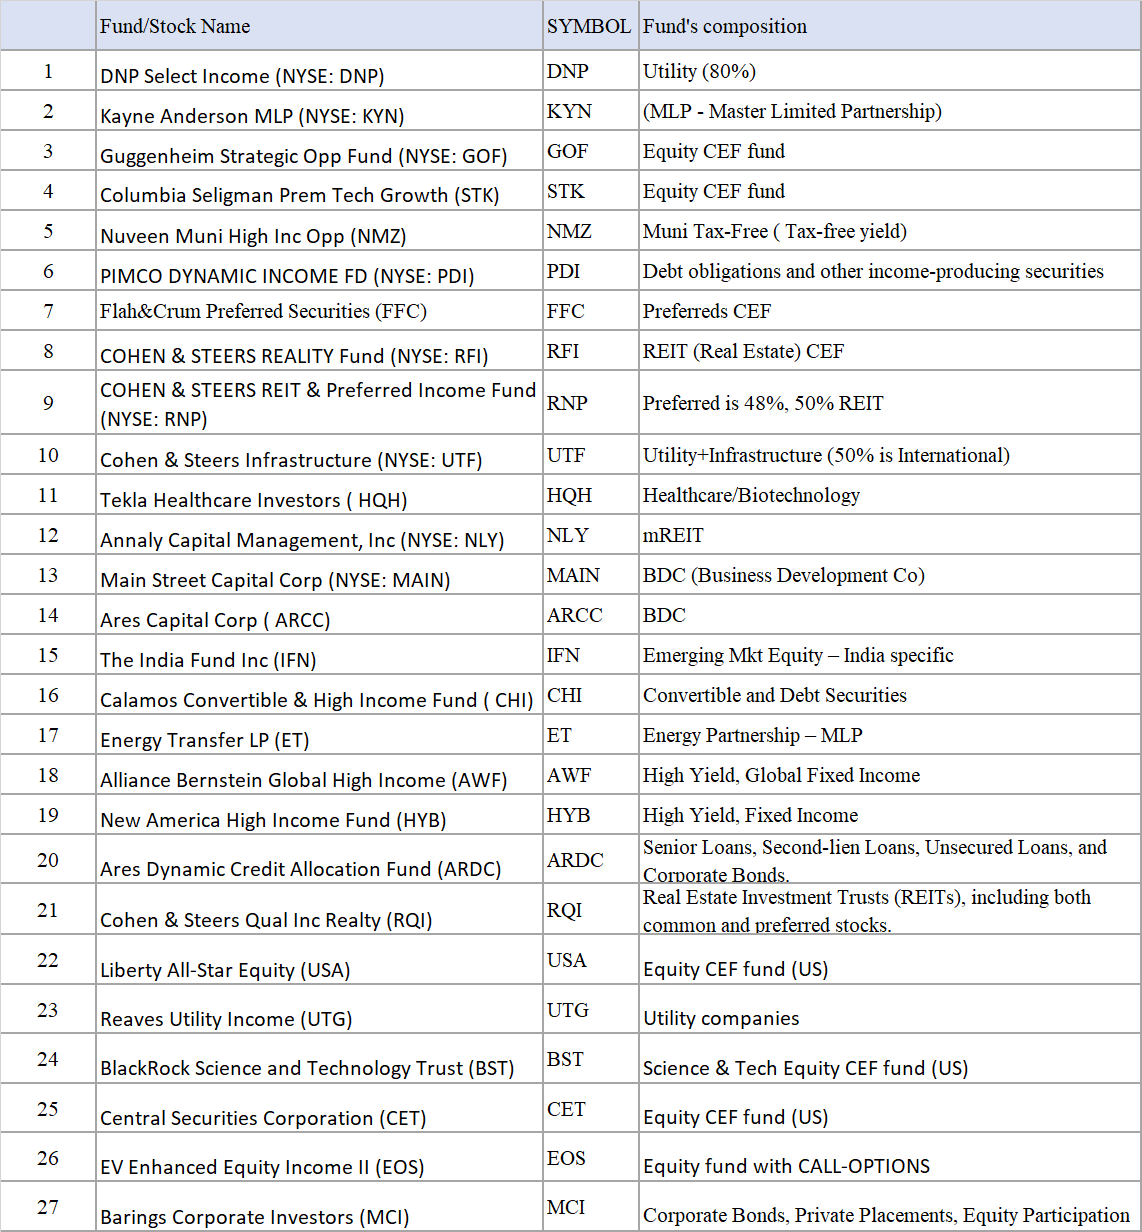
Portfolio Composition:
Here's the current portfolio consisting of 27 securities, including two BDCs, one mREIT, one MLP, and 23 closed-end funds.
The Symbols are:
( DNP ), ( KYN ), ( GOF ), ( STK ), ( NMZ ), ( PDI ), ( FFC ), ( RFI ), ( RNP ), ( UTF ), ( HQH ), ( NLY ), ( MAIN ), ( ARCC ), ( IFN ), ( CHI ), ( ET ), ( AWF ), ( HYB ), ( ARDC ), ( RQI ), ( USA ), ( UTG ), ( BST ), ( CET ), ( EOS ), and ( MCI ).
Table-1:
MAIN, NLY, and ARCC: Three Individual Stocks:
MAIN, NLY, and ARCC are the only three individual company securities in this portfolio that are not funds (every other security is a fund). MAIN and ARCC are in the BDC sector, whereas NLY is an mREIT. ARCC was added in 2017. All three put together form only about 10% of the portfolio value.
HQH:
Tekla Healthcare is the only fund from the healthcare sector in our portfolio. The fund has a good past record. Even though the fund has struggled in recent times, the long-term future looks bright, given the tailwinds to the healthcare sector.
FFC:
In 2022, we replaced PFF (an ETF in the Preferred securities sector) with this closed-end fund FFC that invests in the same sector. FFC is the Preferred fund from Flaherty & Crumrine fund family.
DNP, UTF, and UTG:
DNP and UTG invest in the utility sector, whereas UTF invests both in the utility and infrastructure sectors.
GOF:
The fund invests in US government and agency-issued fixed-income debt and senior equity securities, corporate bonds, mortgages, and asset-backed securities. It also utilizes an options strategy. The fund carries a premium most of the time and currently yields 11.5%.
STK:
STK is an equity CEF and invests primarily in the technology sector. Even though the fund deploys an options strategy, however, most of the distributions come from capital gains. The fund is somewhat risky but also can provide high growth in good times. Due to the large appreciation since we invested and some recent buys, the fund is just about 6% of our portfolio.
BST:
BST is another Science & Technology focused fund (from the BlackRock group); however, unlike STK, it does not write call options. It is invested roughly 60% of the assets in US-based companies, and the rest from other developed countries. We added this fund in December 2021.
RFI, RNP, and RQI:
RNP, RFI, and RQI are from Cohen & Steers fund family and have some overlap in the types of securities they invest in. RNP is a sort of hybrid fund which invests roughly 50% in real estate investment trusts ("REITs") and the balance of 50% in preferred and debt securities. It also provides some exposure to international preferred securities as an added benefit.
RFI is invested in equities of real estate securities. It also invests roughly 15% in the preferred securities issued by real estate companies.
All three funds have a solid history, provide decent yields, and have a relatively low expense ratio. RFI does not use leverage, whereas RNP uses roughly 25% leverage.
PDI:
Note: PCI was merged into PDI as of Dec.10, 2021.
This is a PIMCO fund in our portfolio. The fund has a large exposure to mortgage debt. Due to a strong recovery in the housing market and a steep fall in mortgage delinquencies, this asset class has performed very well so far.
KYN and ET:
KYN is our fund for the MLP sector. The past few years have been tough for the sector. KYN provides exposure to some of the best companies in the MLP sector without the headache of K-1 (partnership) tax treatment.
We added ET in 2019 because of the value proposition that was being offered. This is an individual MLP partnership, which we think will continue to do well and provide a very high level of income. Please note that MLPs provide a K-1 tax form instead of a 1099-Div.
NMZ:
NMZ is the diversified Municipal fund from Nuveen's family. This fund is tax-exempt and should be used in a taxable account. If the portfolio was maintained in a tax-deferred account, we could replace NMZ with BlackRock Taxable Muni Fund ( BBN ), Guggenheim Taxable Muni Fund ( GBAB ), or Nuveen Build America Bond ( NBB ).
IFN:
This is an emerging market, country-specific equity fund focused on India. This replaces the earlier similar India specific fund IIF (Morgan Stanley India Inv fund). IFN provides more consistent and regular distributions than IIF.
CHI:
The fund invests in convertible securities (45%), debt securities (40%), and preferred securities (6%). The fund is sponsored by Calamos Advisors. It provides monthly distributions and uses a leverage of about 33%.
USA, CET:
These both are US-focused equity funds. They invest primarily in a diversified portfolio of equity securities, mostly in US securities.
EOS:
This funds comes from the Eaton Vance fund family. The fund invests primarily in domestic equity and writes call-options to generate income. The fund has a proven past record of good performance.
MCI:
The fund is the flagship fund from Barings group. The fund has a long history since 1971 and has performed well over the years. Fund invests principally in privately placed, below-investment grade, long-term debt obligations and often accompanied by equity features, purchased directly from their issuers.
Sector Allocation:
Chart-2A
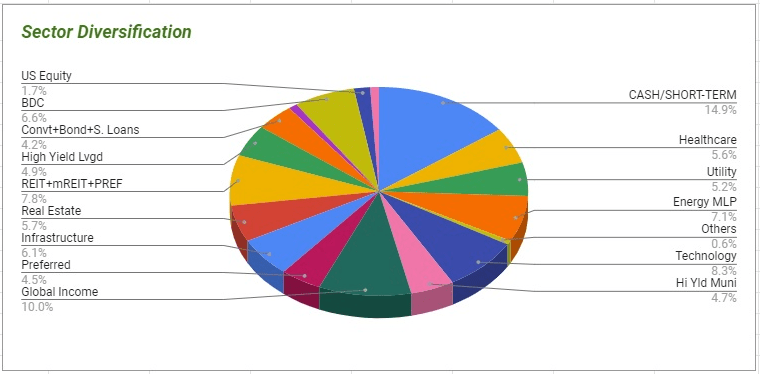
Position-wise Holdings:
Chart-2B
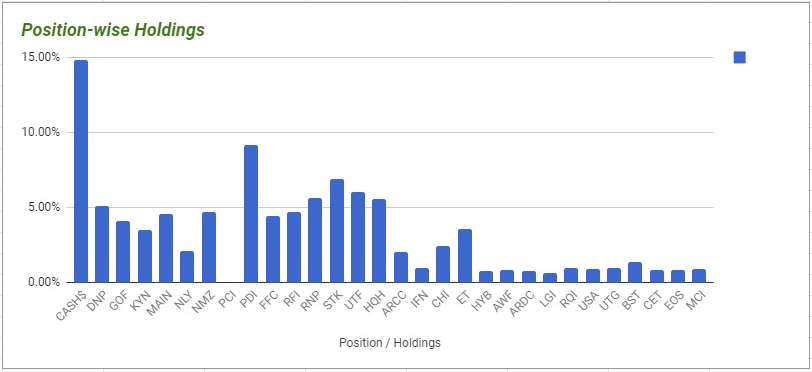
Income Distribution Chart:
Chart-2C
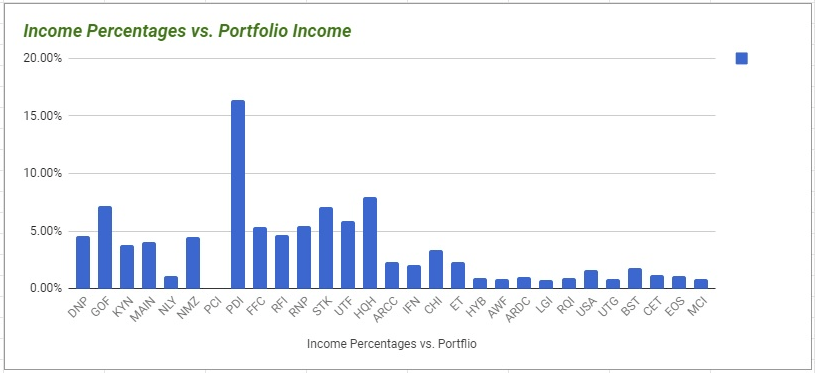
Please note that PDI's income contribution became a bit outsized due to the merger of PCI into PDI (in 2021). However, we still like PDI, so we are not reducing the exposure.
Sale/Purchases made during the year 2021:
We had a rather subdued level of activity in 2022 in terms of sales/purchases. That said, we still made purchases worth about $44,568. However, $22,000 of that was due to the fact we replaced two funds with new funds in the same respective sectors. In the meanwhile, our cash reserve has gone up even more due to incoming dividends. Our total cash reserve at the end of the year 2022 stood at $48,729, roughly 15% of the current portfolio value.
That said, we will need to buy some more funds in the near future to bring down the cash reserve a bit.
Table-2 (sale and purchase transactions):
| Ticker |
| Date of transaction |
| Buy or Sell |
| Shares |
| Price |
| Total Amount |
| BST |
| 3/14/2022 |
| Buy |
| 50 |
| 39.84 |
| 1,992.00 |
| HQH |
| 3/14/2022 |
| Buy |
| 105 |
| 18.93 |
| 1,987.65 |
| CHI |
| 3/14/2022 |
| Buy |
| 169 |
| 11.81 |
| 1,995.89 |
| EOS |
| 3/14/2022 |
| Buy |
| 103 |
| 19.3 |
| 1,987.90 |
| CHI |
| 6/21/2022 |
| Buy |
| 94 |
| 10.61 |
| 997.34 |
| UTF |
| 6/21/2022 |
| Buy |
| 42 |
| 23.5 |
| 987 |
| UTG |
| 6/21/2022 |
| Buy |
| 34 |
| 29.06 |
| 988.04 |
| PDI |
| 6/21/2022 |
| Buy |
| 49 |
| 20.36 |
| 997.64 |
| NMZ |
| 6/21/2022 |
| Buy |
| 90 |
| 11.05 |
| 994.5 |
| FFC |
| 6/21/2022 |
| Buy |
| 58 |
| 17.09 |
| 991.22 |
| BST |
| 6/21/2022 |
| Buy |
| 30 |
| 32.75 |
| 982.5 |
| HQH |
| 6/21/2022 |
| Buy |
| 55 |
| 18.06 |
| 993.3 |
| USA |
| 6/21/2022 |
| Buy |
| 165 |
| 6.04 |
| 996.6 |
| RQI |
| 6/21/2022 |
| Buy |
| 75 |
| 13.21 |
| 990.75 |
| EOS |
| 6/21/2022 |
| Buy |
| 61 |
| 16.14 |
| 984.54 |
| MCI |
| 7/14/2022 |
| Buy |
| 216 |
| 13.86 |
| 2,993.76 |
| TOTAL |
| $21,860.63 |
There was a reverse split (0.25 : 1) of shares by NLY (Annaly Capital). So, the share count was reduced in the ratio of 4 to 1.
In addition, we replaced IIF with IFN and PFF with FFC as below:
Table-2B:
| Ticker |
| Date of transaction |
| Buy or Sell |
| Shares |
| Price |
| Amount |
| IIF |
| 1/13/2022 |
| Sell |
| -161 |
| 28.25 |
| -4,548.25 |
| IFN |
| 1/13/2022 |
| Buy |
| 205 |
| 22.15 |
| 4,540.75 |
| PFF |
| 1/13/2022 |
| Sell |
| -467.35 |
| 38.9 |
| -18,179.92 |
| FFC |
| 1/13/2022 |
| Buy |
| 843 |
| 21.55 |
| 18,166.65 |
Total Purchases: $44,568.03 (21,860.63+4,540.75+18,166.65)
Total Sales: $22,728.17 (4,548.25+18,179.92)
Dividends:
Total dividend earned in the year 2022: $29,048.77
Total dividends earned until the end of 2021: $131,648
Total dividends earned since portfolio inception: 160,697 ($131,648+29,049)
(This includes $1,382 from securities that were sold prior.)
The yield-on-cost [YOC] for the year 2022 was 14.52%. However, the distribution amount also includes year-end special distributions. If you were to invest today in this portfolio, you would get a much lower yield of 8.0 to 9.0%. This is obviously a function of capital appreciation and reinvested dividends over the years. The current cash reserve of $48,729 represents roughly 15% of the portfolio.
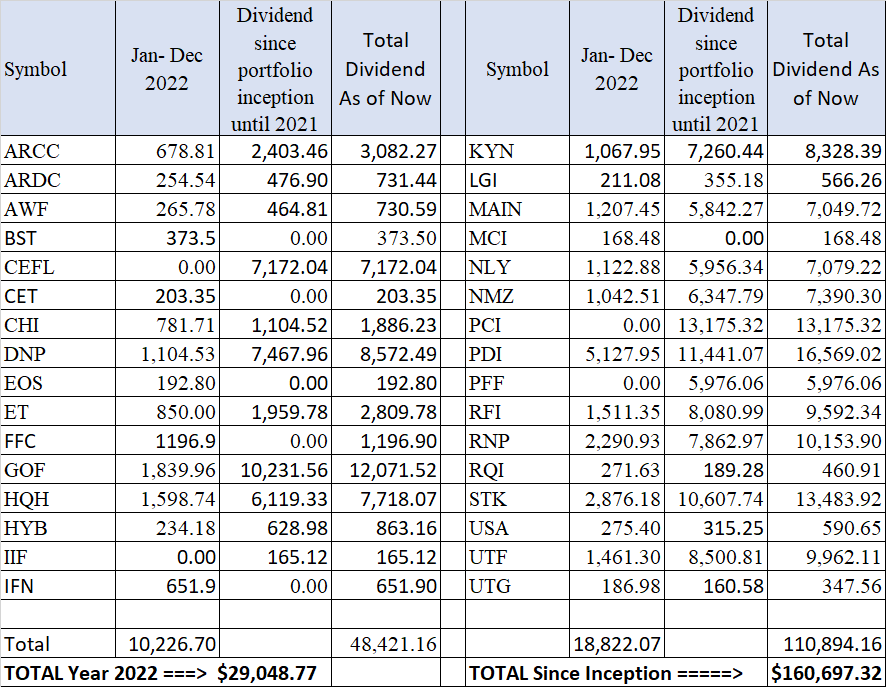
Security-wise dividends:
Table-3:
Total dividend since inception = $160,697 (includes $1,382 from closed positions not shown in the table).
Performance:
The portfolio returned roughly -12.5%, 20.3%, 0.12%, and 30% in the years 2022, 2021, 2020, and 2019 respectively.
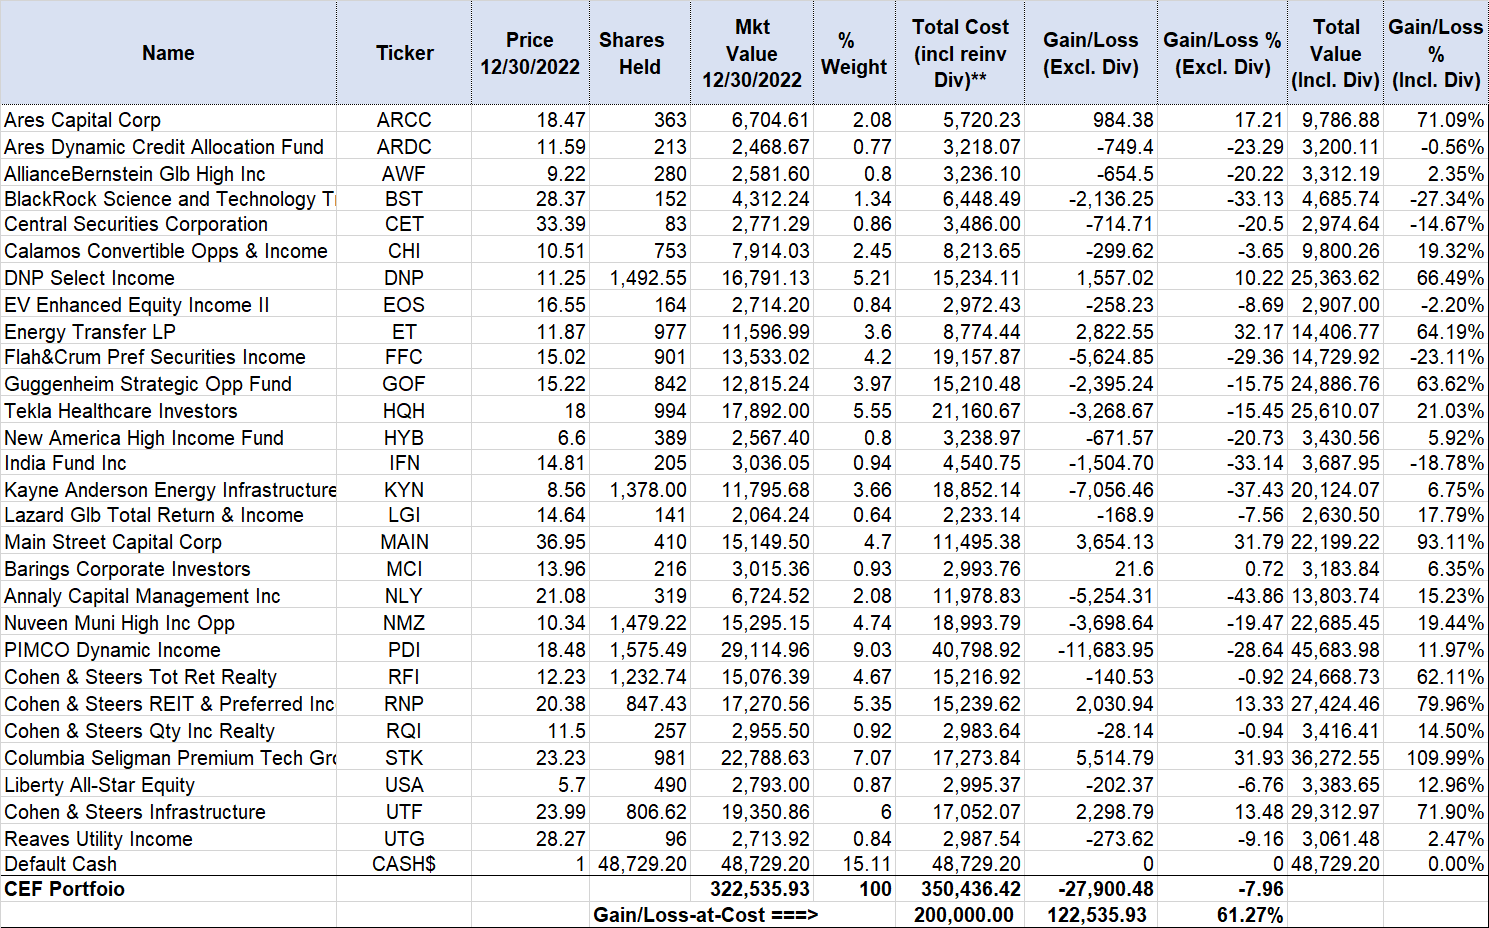
Here's the current portfolio (sorted alphabetically on Ticker) as of 12/31/2022. The very last column shows the performance calculated after including the dividends for each security.
Table-4:
Here's another view of the above table. It shows the funds sorted in order of performance, including the dividends (from best to worst) as of Dec. 31, 2022.
Table-5:
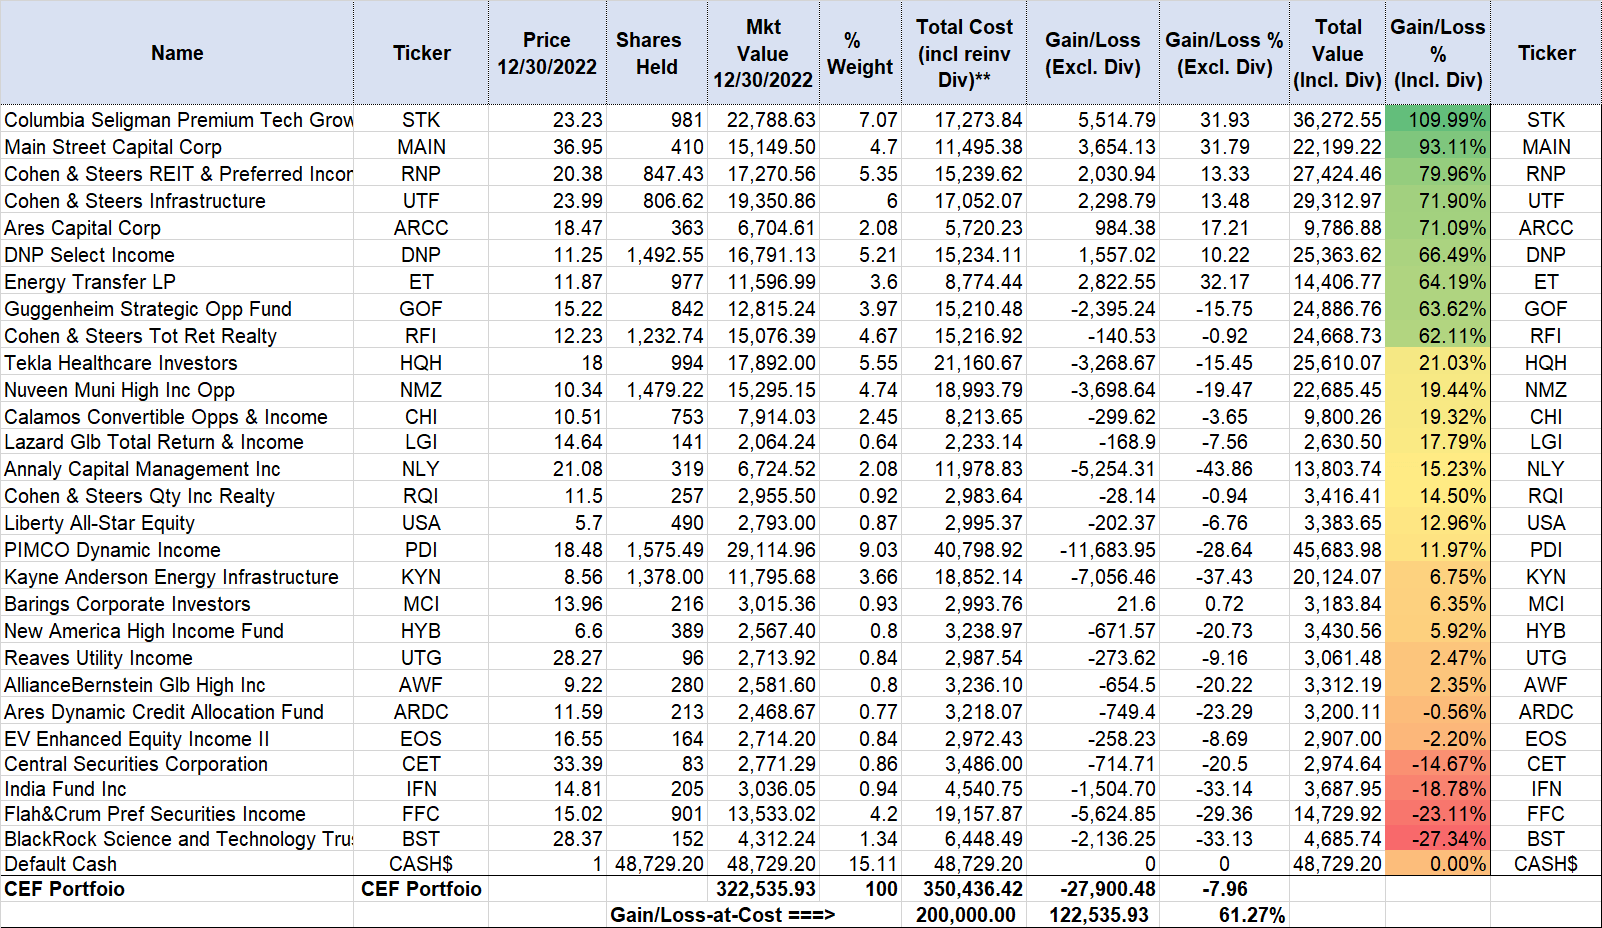
Table-6:
| 1 |
| Sold during the period (year 2022) |
| $22,728.17 |
| 2 |
| New investments made during the period (year 2022) |
| $44,568.03 |
| 3 |
| Net new money invested (2 -1) |
| $21,839.86 |
| 4 |
| Net Cash deployed so far (including redeployed dividends) (297,326 + 21,840) |
| $319,166 |
| 5 |
| Total Dividends collected (from Oct 17, 2014, until Dec. 31, 2022) |
| $160,697 |
| 6 |
| Net Cash position (12/31/2022) |
| $48,729 |
| 7 |
| Cost basis (12/31/2022) |
| $200,000 |
| 8 |
| Portfolio balance (as of 12/30/2022) |
| $322,536 |
| 9 |
| Net profit/Loss (incl. dividends) (12/31/2022) |
| $122,536 |
| 10 |
| Return on original invested capital (122,536/200,000) |
| 61.27% |
Performance Comparison with Benchmark:
Here are our two original goals:
| 1 |
| Earn a current income of 8% and preserve capital. |
| 2 |
| Provide roughly 2% or more capital appreciation over the long term. |
As such, this portfolio is meeting its primary goal of earning an 8% income. For performance comparison, we have been using the traditional Stock/Bond portfolio as a benchmark.
We earned an income of $29,049 during the year 2022, with yield-on-cost being 14.52%. The total of dividends/ distributions since inception stands at $160,697. However, the current yield of the portfolio is roughly 9.0%.
Capital preservation: The portfolio value generally moves along with the market. Currently, overall, it's showing gains of about 61%. But this is only a snapshot of a moment and can go up or down, depending upon the movement of the broader market.
Our benchmark for this portfolio is not S&P 500 but a traditional stocks/bonds portfolio (40/20/40 Stocks/International Stocks/Bond allocation). We will assume that similar amounts were contributed on the same dates and similar amounts were deployed. We will compare our income-centric portfolio with a hypothetical stock/bond portfolio with 40/20/40 allocation to Vanguard Total Stock Market ETF ( VTI ), iShares MSCI EAFE - International ( EFA ), and (Vanguard Total Bond Market ETF ( BND ). As you would notice, the Stock/Bond portfolio briefly outperformed the '8%-CEF-Income' portfolio during the panic of the 2020 pandemic crash, but that was the only instance in the last eight years.
Chart-3:
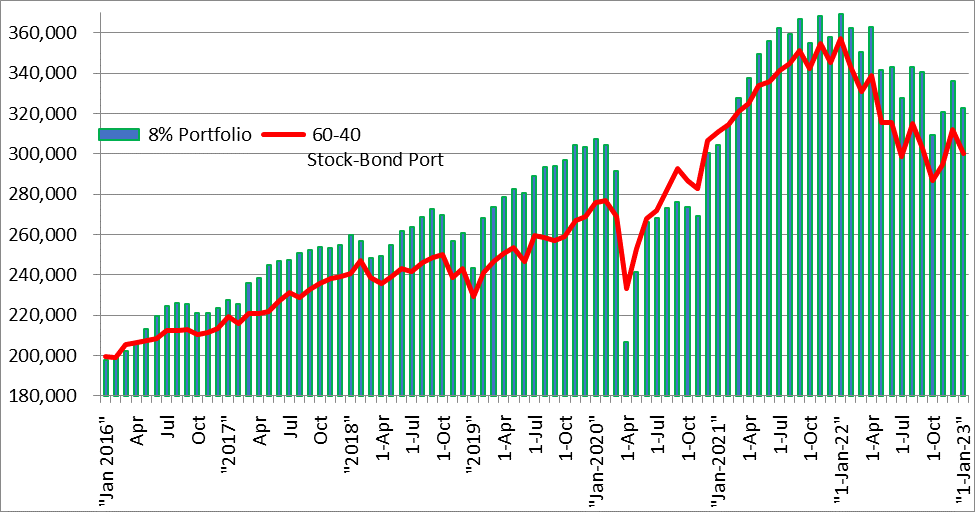
| As of 12/30/2022 |
| 8% Income portfolio |
| 60:40 Stock/Bond portfolio |
| Cost Basis |
| $200,000 |
| $200,000 |
| Total Portfolio Value |
| $322,536 |
| $299,925 |
| Net Dividends Earned |
| $160,697 |
| $41,520 |
Closing Remarks:
We started this portfolio in Oct. 2014. In most years, except 2020, and 2022, the portfolio has performed quite well. In 2020, the portfolio was mostly flat in spite of the tremendous challenges caused by the pandemic and the oil prices crash. In 2022, it lost money but at a lesser rate than the S&P500 or a stock-bond portfolio. Moreover, as a policy, we have maintained roughly 10% to 12% cash reserve; though it has its benefits, at the same time, it earns not much income or appreciation.
Nonetheless, for an income investor, what is more important - consistent and reliable income or the total return? We are of the opinion that in the short to medium term, it is the reliability of income, while in the longer term, both the income and total return are important. This portfolio has behaved as we would have expected. We already know that this portfolio would not hold well during panics when investors like to move away from risk assets. But in that regard, it is certainly not worse off than the S&P500. However, one thing that it never failed was to provide consistently high income, now exceeding 14% on our cost basis.
For us, this is a buy-and-hold-forever portfolio, as we rarely sell. For this reason, we want to keep only the best funds in the portfolio and not worry about market gyrations. In some ways, this is like an "annuity" portfolio without many of the downsides of an annuity. Sure, this portfolio is not for everyone. If you do not need a high income or you cannot tolerate a high level of drawdowns and would be tempted to sell at the worst times, you should not own it.
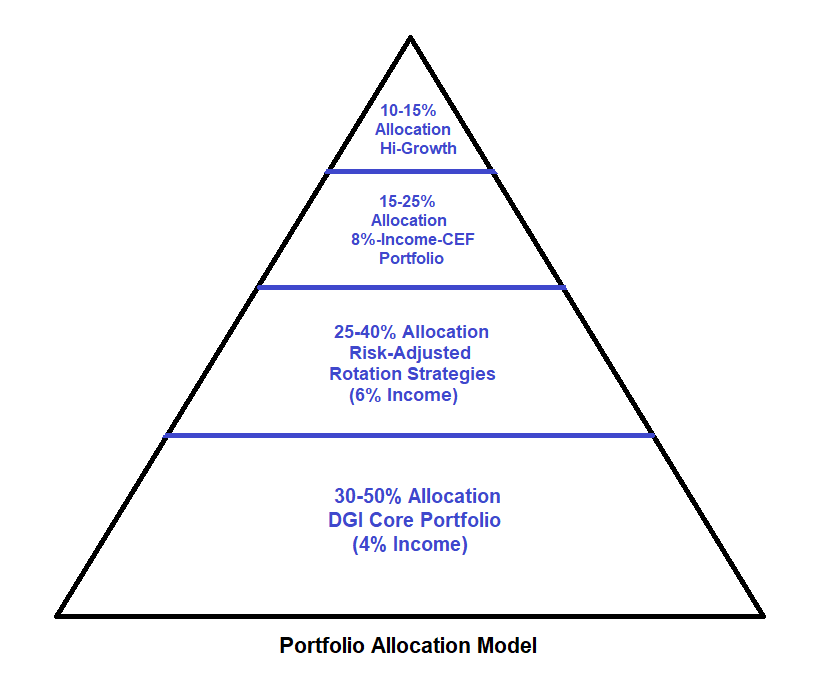
We would like to remind the readers that the CEF portfolio should not be considered a "core" portfolio. We do not recommend allocating more than 20-25% of the investment assets to this type of portfolio, though these decisions should be considered on a personal basis. Below is the allocation model that we like to follow:
For further details see:
The 8% Income Portfolio: 2022 Year-End Review