IMCV - The Boyar Value Group's Q2 2023 Client Letter
2023-10-25 08:30:00 ET
Summary
- The Boyar Value Group's mission is to search or value on behalf of our clients. In essence, we are trying to buy a dollar for fifty cents.
- The stock market experienced a rally in the first half of the year but ended the third quarter with a decline of 3.3%.
- Large technology companies have been driving the performance of the market-cap weighted S&P 500 index.
- Small-cap value stocks are currently cheaper compared to large-cap growth stocks, presenting a potential opportunity for investors.
“I make no attempt to forecast the market – my efforts are devoted to finding undervalued securities.”
–Warren Buffet
A Look Back
By the end of July, the stock market (as measured by the S&P 500) had shrugged off a miniature banking crisis, a debt ceiling standoff, and a hawkish Federal Reserve to notch 5 consecutive months of gains, ultimately advancing over 20% on a year-to-date basis. But in August the rally ended when the S&P 500 ( SP500 , SPX ) fell 1.6%, followed in September by a 4.8% loss. The S&P 500 declined 3.3% for the 3 rd quarter.
Pinpointing the exact reason any stock market rally ends is virtually impossible, but various reasons have been cited for this selloff, including rising oil prices and the growing consensus that interest rates would not be declining any time soon. The S&P 500 ended the quarter selling for 17.8x (fwd.) earnings, a slightly elevated valuation by historical standards. (The 25-year average is 16.8x.) The current multiple is down from the 21.4x the index was selling for in early 2022 due, in part, to the ~11% decline in the S&P 500 since January of 2022. While 17.8x is an elevated multiple, back in March 2000 the S&P 500 traded for 25.2x (but the index then lost 49% of its value over the following 2 calendar years).
It is worth noting that the performance of the market-cap weighted S&P 500 index this year (+13.1% through Q3) has been driven primarily by large technology companies, including a resurgence of the “Magnificent Seven” (Apple, Microsoft, Alphabet, Amazon, Nvidia, Meta and Tesla). Returns for the remainder of the S&P 500 have been more modest, with the S&P 500 equal-weighted index advancing 1.3% and currently selling for a more reasonable 14.3x (fwd.) earnings. As of September 30, 2023, the top 10 stocks (as measured by market capitalization) in the S&P 500 were selling for 25.9x (down significantly from 29.3x earnings [fwd.] at the end of the previous quarter) earnings, compared with an average valuation of 20.2x since 1996. The weightings of the S&P 500’s top 10 stocks remain at multidecade highs. As of September 30, the S&P 500’s top 10 stocks accounted for 31.9% of the index, a figure that was only ~18% in 1996 (and that even at the peak of the dot-com bubble was roughly 27%).
Just two sectors advanced during the third quarter: Energy (+12.2%) and Communication Services (+3.1%). All other sectors were in the red, with Real Estate shares declining the most (-9.5%), followed by Utilities (-9.2%). Through the end of the third quarter, the best-performing sectors YTD were Communication Services (+40.4%), Technology (+34.7%), and Consumer Discretionary (+26.7%). By contrast, Utilities (-14.4%), Real Estate (-8.1%), and Consumer Staples (-4.8%) were the worst performers.
Source: JP Morgan Guide to the Markets
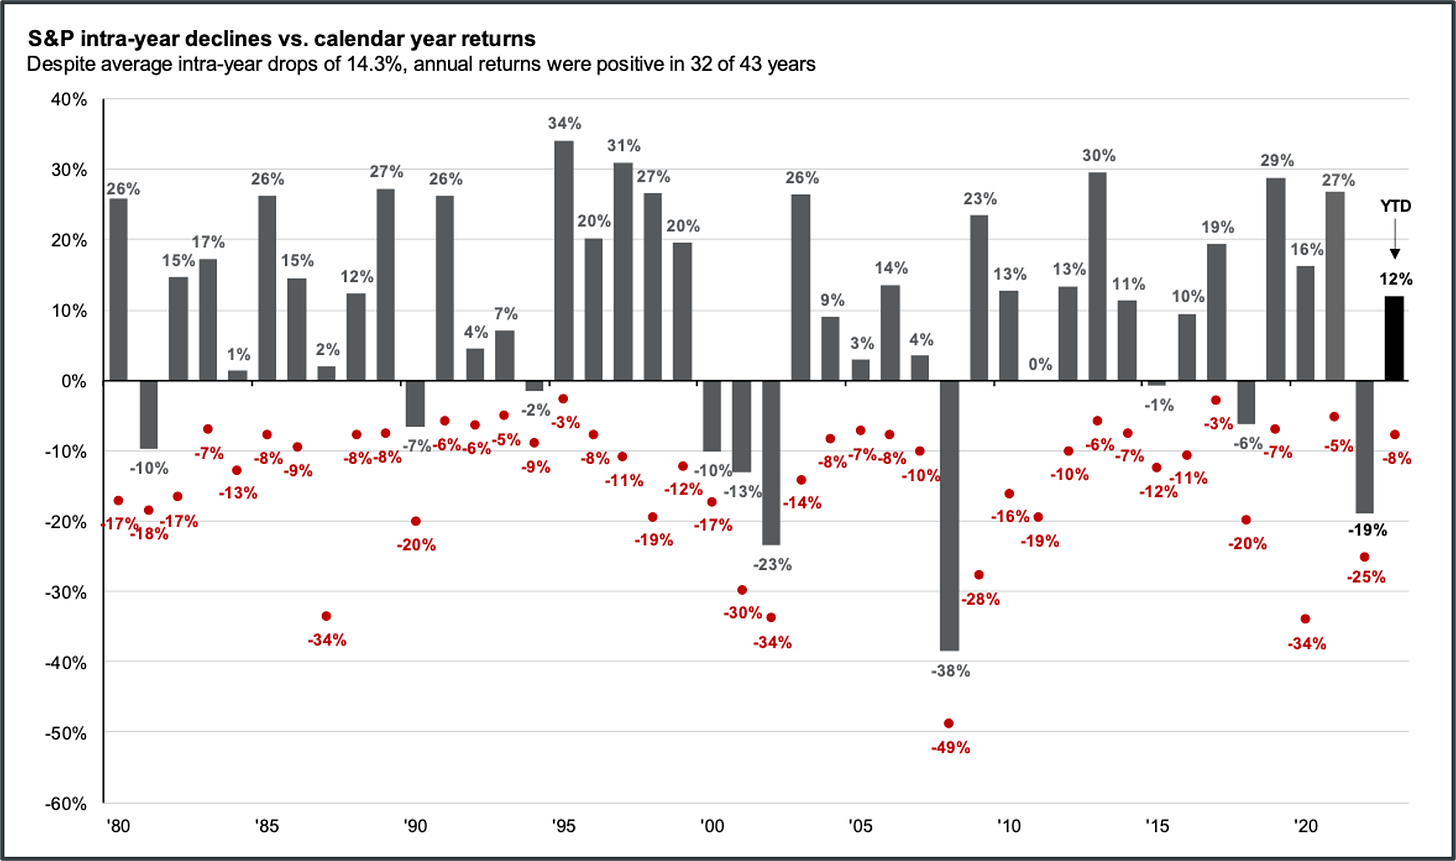
In volatile times like the current one, reacting to short-term swings can be costly. Instead, we invest with the long term in mind, remembering that history is on the side of those who do not panic during market corrections: despite average intrayear declines of 14.3%, annual returns were positive in 32 of the past 43 years.
Source: JP Morgan Guide to the Markets
Growth Investors Beware!
Even after a poor third quarter for high-flying growth stocks, whose ascent halted after a sudden rise in interest rates, growth stocks are still quite expensive. Currently the stocks in the Russell 1000 growth index are selling 3.6 P/E multiple points higher than their long-term average (dating back to 1997), with value shares (represented by the Russell 1000 value index) selling slightly less than their long-term average.
Source: JP Morgan Guide to the Markets
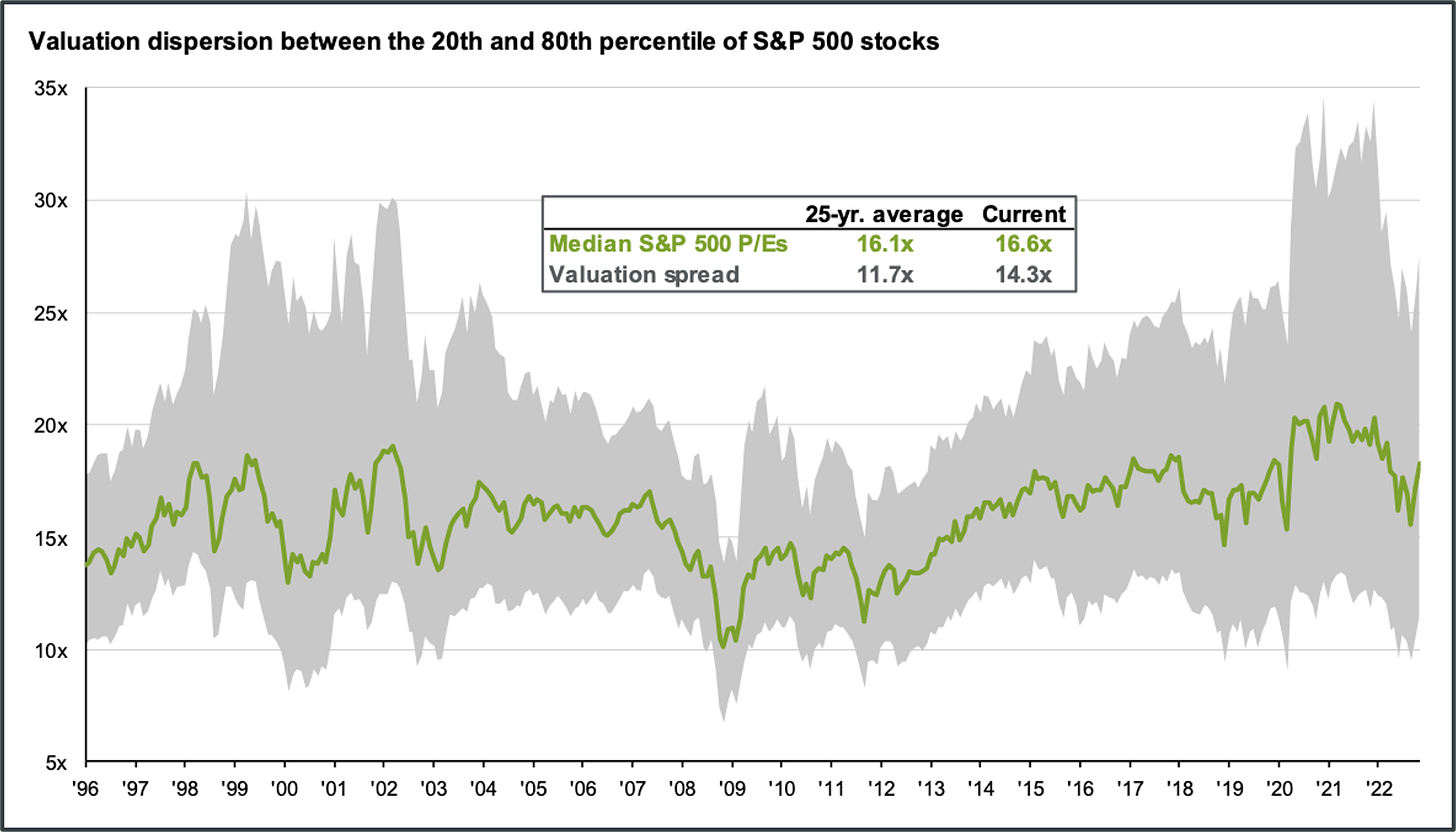
The gap between the S&P 500’s most and least expensive stocks is considerable. Over the past 25 years, the spread between the 80th and 20th percentiles (in terms of P/E ratios) has been 11.7x, but as of September 30 it was 14.3x. Investors are then faced with a dilemma: are the bottom 20 percentile screaming bargains, or are they value traps (when a seemingly undervalued stock remains stagnant or dips even lower)?
Small-Cap Opportunity?
We have repeatedly observed that small-cap value is the cheapest part of the market, and it continues to be. Small-cap value sells 16% below its 20-year average P/E multiple, while large-cap growth shares are trading at 30% above their 20-year average P/E multiple, according to data provided by JP Morgan. The Russell 2000, which is an index of smaller company stocks (by market capitalization), has been in a bear market since peaking in late 2021 (currently ~28% below its 2021 high) and has trailed the Russell 1000 (an index of larger companies’ shares) by ~13% in 2023, as Spencer Jakab pointed out on October 10 in the Wall Street Journal .
It makes sense that small-cap shares have performed poorly in a period of rising rates, as they typically have less ability to access the debt markets on favorable terms compared to larger companies. Constituents of the Russell 2000 index had a weighted average maturity of 4.8 years on their debt, versus 8.8 years for large companies as of late 2022 (meaning that small companies are more likely to have to refinance their debt during a period of elevated interest rates, thereby lacking larger companies’ luxury of time to be able to wait for a potentially lower interest rate environment to refinance their debt). In addition, a much higher percentage of smaller companies’ debt is floating-rate (where the amount owed in interest payments increases with interest rates). (According to data from Goldman Sachs, 30% of Russell 2000 companies’ debt is floating rate, compared with just 6% for the S&P 500 constituents.) As a result, reports Ned Davis Research, small companies’ bottom lines were pressured when interest expenses for the S&P 600 (another small-cap index) hit a record high during the second quarter. By contrast, rising interest rates are minting money for certain mega-capitalization stocks with cash heavy balance sheets: according to Ethan Wu writing for the Financial Times , during the 12 months ending in June, the “Magnificent Seven,” the high-flying technology stocks that are powering this year’s advance, recorded $13.3 billion in interest income while paying just $9.6 billion in interest expenses.
Smaller companies have historically done poorly during the periods leading up to a recession, which makes sense: because of their smaller size, they do not have the resources that their larger brethren use to ride out economic storms. However, warnings of a recession and a period of rising interest rates are near-term phenomena and do not explain why for 5 years and counting the Russell 2000 has underperformed the S&P 500 (which comprises the largest 500 publicly traded companies by ~47%).
Source: JP Morgan Guide to the Markets
The good news for small-cap investors, as Spencer Jakab points out, is that over the past 11 recessions, small-caps have beaten larger-caps by over 16% in the 12 months after the recession started and have done quite well in previous recoveries . For example, from 2001 through 2004 (the period following the dot-com bust), the S&P 500 lost about 2% but the Russell 2000 value gained 80%. The historical record supports small-cap value’s outperformance, with the annualized return of small-cap value more than 400 bps higher than that of larger-cap growth companies since 1926 (through July of 2023), according to data provided by Nobel Prize-winning economists Eugene Fama and Kenneth French.
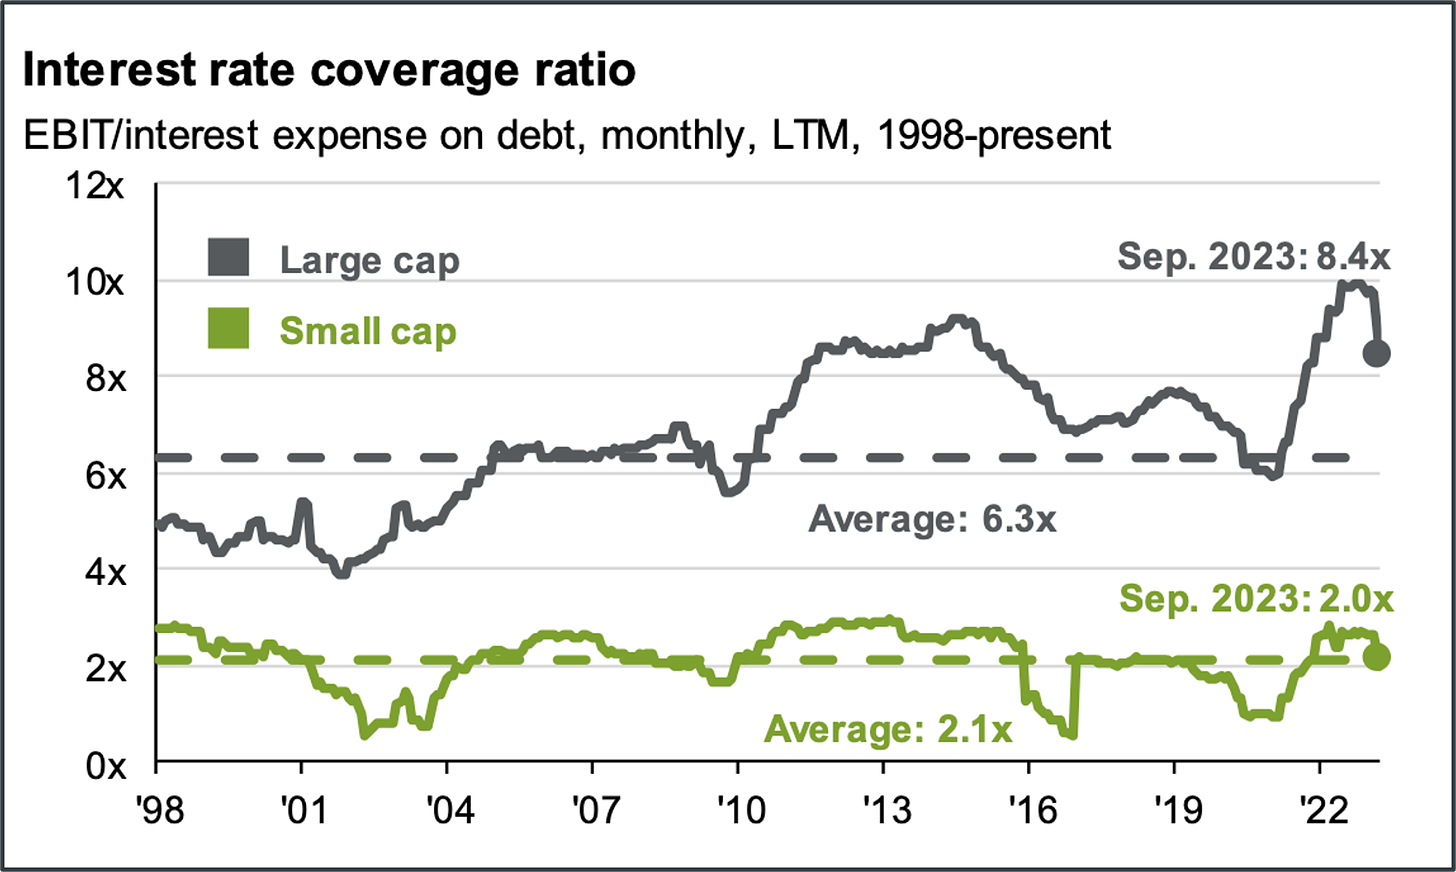
However, investors in small-cap companies should be especially wary (and this is why good stocking picking in this area of the market is so important) of potential minefields: 45.5% of the companies in the Russell 2000 are unprofitable, and their EBIT (earnings before interest and taxes) covers a much smaller percentage of their interest expense than among their large-cap brethren. (For further details, see the accompanying chart.)
Fixed-Income Investing
A swift selloff in bonds began last month (as rates increase, bond prices fall) after the Federal Reserve once again signaled that rates would remain higher for longer. Yields continued to rise as employment data remained strong, convincing investors that the Fed will be true to its word. A spike in rates was also attributed to U.S. government dysfunction and concerns over upcoming government plans for sizable spending. Via the futures market, investors are predicting two to three interest rate cuts by the end of next year (down from the four to five predicted as recently as early September), so it is worth remembering how wrong the “experts” (including the Fed chairman) have been at predicting the direction of interest rates throughout the pandemic recovery.
For quite some time we have warned of the dangers of fixed-income investing (admittedly we were early, but our warnings have been vindicated, with bonds on pace for a record 3 years of losses), but even we were somewhat surprised (but not shocked) by the magnitude of the losses suffered in these “safe” investments, which have begun to rival some of the largest meltdowns in U.S. financial history. According to Ye Xie, writing for Bloomberg , bonds maturing after 10 years or more have decreased by 46% since peaking in March 2020, and 30-year bonds have decreased by 53%. These declines eclipse the average bear market loss of 39% since the 1970s and nearly rival the peak-to-trough decline of the S&P 500 after the dot-com bust, which was ~44%, and the decline of ~54% seen during the 2008 financial crisis. While investors who hold these bonds will in all likelihood get their principal back at maturity, they have incurred a substantial opportunity cost by tying up their money for 10-30 years to gain a few measly additional basis points in yield.
With interest rates rising substantially, would-be high-yield borrowers are finding creative ways to decrease their borrowing costs. According to Harriet Clarfelt writing in the Financial Times , $70 billion of junk bonds issued in 2023 (almost two-thirds of the total supply) have been secured, with creditors designating assets that they may seize to get their money back in the event of a default. (Why this was not lenders’ policy in the first place is a whole separate matter involving loose lending standards.) According to PitchBook , a higher percentage of secured bonds was issued in 2023 than in any other year during its nearly two decades of records. The nearest contender was 2019, when a little over a third of junk bonds issued were secured. One worrying trend worth monitoring is the increase in high-yield defaults thus far in 2023, with $26 billion of defaulted debt through July, versus $18 billion in 2022. This is a textbook argument against loose lending standards, with investors having recovered just 35 cents on the dollar from senior unsecured bonds thus far in 2023.
Soft Landing?
Will we have a soft landing? Pundits have been debating this question for quite some time, with the consensus shifting 6 times in the past 15 months , as Mohamed El Erian notes in a Financial Times opinion piece. He observes that the recent spike in rates, the increasing price of oil, and the strengthening dollar have all pushed the consensus away from a soft landing. In our opinion, trying to figure out what type of landing the U.S. economy will have is an exercise in futility . Instead, investors should be focusing on the individual companies they own and considering how those companies will fare in both calm and stormy seas.
Bears argue that a hard landing will come in part from the significant increase in the price of oil this year. As of October 17, Brent crude oil was $91 per barrel, up 12% since the start of 2023, interestingly however gasoline prices according to AAA are less expensive now than they were last year at this time. Because the U.S. is a consumer-driven economy, the increase in the price of oil is raising questions about how much consumer spending for other items will decrease, but as David Uberti of the Wall Street Journal points out on September 25, efficiency gains have made American businesses and consumers less sensitive to oil price shocks than they were decades ago.
The U.S. housing market is another cause for concern. Due to rising mortgage rates (at the beginning of the year, mortgage rates were around 6%, but according to Mortgage News Daily they were 8% by mid-October the highest level since mid-2000), home buying is less affordable than it has been in decades. The median existing-home price rose 3.9% in August to $407,000, up from $266,300 in January of 2020 prior to the pandemic. As Diana Olick of CNBC explains, the payments for a borrower purchasing a $400,000 home with a 20% down payment on a 30-year fixed mortgage are now $930 more per month than when rates were 3%, during the height of the pandemic. What’s more, $400,000 buys a far less high-quality home than it did just a few years ago. Not surprisingly, increasing prices have significantly decreased demand, pushing home sales down to their lowest levels since the subprime crisis.
The rise in interest rates is impacting not only the once hot housing market but also the car market. According to Claire Bushey of the Financial Times , 1 in 5 U.S. consumers who borrowed money to buy a new car owe at least $1,000 per month. Interest rates on car loans averaged 7.4% in the third quarter, the highest level since 2007. High car payments have significantly negatively impacted demand, with car dealers having a 40-day supply of cars costing $50,000 or more, versus a 28-day supply in August 2021.
After reaching 40-year lows, household debt is starting to increase. It is not high from a historical perspective, but we plan to keep an eye on it nonetheless while also monitoring early delinquency for both automobile and credit card loans.
At 4.2%, the personal savings rate is significantly below the long-term average of 8.6%. Though so low a number is concerning from a historical perspective, it can be explained by the massive amount of excess savings accumulated during the pandemic due to government support programs and reduced consumer spending during the early part of the pandemic. We are more worried about the increase in consumer borrowing, although even that is now only back to a more normalized level relative to the 8 or so years prior to the pandemic.
Source: JP Morgan Guide to the Markets
The Wisdom of Taking a Long-Term View
We’ve said it before, and we’ll say it again: individual investors stack the odds of investment success in their favor when they stay the course and take a long-term view. Yet data from Dalbar tell us that over the past 20 years, when the S&P 500 averaged a 9.8% annual advance, the average investor gained a mere 3.1%. Why such a degree of underperformance? Partly because investors tend to let their emotions get the better of them and chase the latest investment fad (or pile into equities at market peaks and sell out at market troughs)—and partly because they sell for nonfundamental reasons, such as a rise in a company’s share price (or in an index).
Source: JP Morgan Guide to the Markets
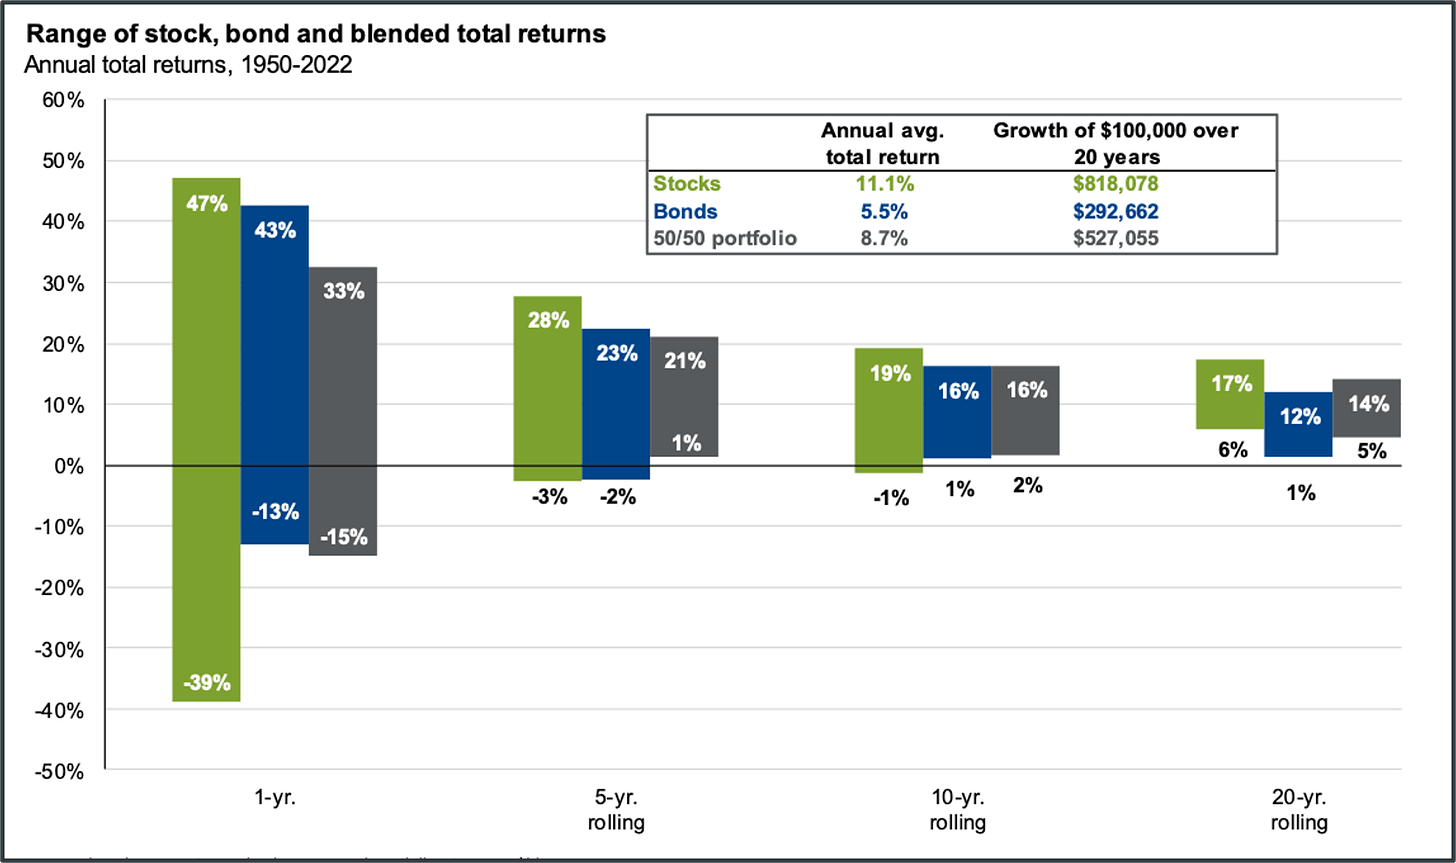
But history tells us that taking a multiyear view instead would tilt the odds of success in investors’ favor. According to data from JP Morgan, since 1950 annual S&P 500 returns have ranged from +47% to -39%. For any given 5-year period, however, that range narrows to +28% to -3%—and for any given 20-year period, it is +17% to +6%. In short, since 1950, there has never been a 20-year period when investors did not average a gain of at least 6% per year in the stock market.
Past performance is certainly no guarantee of future returns, but history does show that the longer a time frame you give yourself, the better your chances become of earning a satisfactory return.
As always, we’re available to answer any questions you might have. In addition, you can reach us at Info@boyarvaluegroup.com or (212) 995-8300.
Best Regards,
Mark A. Boyar, Jonathan I. Boyar
| Important Disclaimer: Important Disclosures. The information herein is provided by Boyar’s Intrinsic Value Research LLC (“Boyar Research”) and: (a) is for general, informational purposes only; (b) is not tailored to the specific invest-ment needs of any specific person or entity; and (c) should not be construed as investment advice. Boyar Research does not offer investment advisory services and is not an investment adviser registered with the U.S. Securities and Exchange Commission (“SEC”) or any other regulatory body. Any opinions expressed herein represent current opinions of Boyar Research only, and no representation is made with respect to the accuracy, completeness or timeliness of the information herein. Boyar Research assumes no obligation to update or revise such information. In addition, certain information herein has been provided by and/or is based on third party sources, and, although Boyar Research believes this information to be reliable, Boyar Research has not independently verified such information and is not responsible for third-party errors. You should not assume that any investment discussed herein will be profitable or that any investment decisions in the future will be profitable. Investing in securities involves risk, including the possible loss of princi-pal. Important Information: Past performance does not guarantee future results. Any companies mentioned in this are for informational purposes only and the performance of the stock selected is not indicative of the performance of the stocks profiled in Boyar Research, the performance of the stocks selected, and the per-formance of Boyar Research may in fact diverge materially.This information is not a recommendation, or an offer to sell, or a solicitation of any offer to buy, an interest in any security, including an interest in any investment vehicle managed or advised by affiliates of Boyar Research. Any information that may be considered advice concerning a federal tax issue is not intended to be used, and cannot be used, for the purposes of (i) avoiding penalties imposed under the United States Internal Revenue Code or (ii) promoting, marketing or recommending to another party any transaction or matter discussed herein. |
Editor's Note: The summary bullets for this article were chosen by Seeking Alpha editors.
For further details see:
The Boyar Value Group's Q2 2023 Client Letter