GUSH - The Effect Of Technical Analysis On ETF Investing
2023-08-10 13:59:03 ET
Summary
- I explain the methodology for choosing which ETFs to invest in, using a combination of technical and fundamental analysis to identify the best sectors and trends.
- I suggest that ETFs are not less than stocks but are used to diversify the portfolio and can be used as a good alternative investment to stocks.
- I conclude that investing in ETFs is an excellent method of investing exclusively or in tandem with a stock portfolio, and using technical analysis when monitoring the entire portfolio is worthwhile for all investors.
Not long ago, I wrote three articles, part 1 , part 2 , and part 3 , on my process for isolating a watch list for stocks that pose a good chance of advancing in the market. I want to thank those who read them, especially those who commented. Today I would like to explain my methodology for choosing which ETFs I invest in as well.
I see ETFs as good alternative investments to stocks, and as places to put funds awaiting a good stock choice. ETFs are not less than stocks but are used to diversify the portfolio. Similar to mutual funds, these instruments are very good tools to modify the portfolio with other sectors or strategies, without going into lengthy analysis or with excessive funding. One can improve his or her results by isolating the better ETFs among the many available and isolating the best ones at that moment.
There are many criteria available to the investor to accomplish this task. Technical and fundamental analysis comes to mind immediately. Most investors will use some combination of both of these most of the time, and I am no different. My process goes something like this:
First, I look at the market as a whole. Is it advancing or declining? I tend not to invest against the trend, regardless. How old is the current trend? Is the current trend about to reverse? Most intermediate trends last anywhere from 30 to 60 days, so I use that as a general guide, though trends can last many months.
What sectors are the strongest? Weakest? I rank the sectors by strength over the last 20 to 50 days using RS (last close divided by the close so many days back). I vary the number of days because if the trend hasn't existed for very long, I will shorten the timeframe. Then I rank them from one to (in my case) 19 and concentrate on the top ETFs. Currently, I have 19 ETFs that I watch and add only when I think that another one deserves to be included. These 19 cover most sectors and I keep track of them all going back to January 2018. I also refer to the industry sectors on another spreadsheet using those found on Seeking Alpha , and rank those too. Observing the charts and trends, I look at the best ones to decide which ones to buy. I try various timeframes to isolate the best of the best and sometimes compare them to historical patterns. The spreadsheet tells me what I need to know.
Over the years, I discovered a few important attributes of ETFs in general. Certain sectors stand out as having superior probabilities over others, so I mainly concentrate on these. The most profitable sectors are:
- Economic ( WANT , Consumer Discretionary).
- Communications ( XLC ).
- Gas and Oil Production ( GUSH / DRIP ).
- Energy ( ERX / ERY ).
- Homebuilders ( NAIL ).
These sectors are the best ones over time. To go long on a sector, I either buy the positive version, but if I want to go short, I would either sell the long version or buy the negative version. DRIP and ERY are negative versions of GUSH and ERX, respectively. I am quick to go short if the chart demands it. Other sectors I watch are the Financials (FAS/FAZ), Stock Market (QLD/QID, SPXL/SPXS), Bonds (TMF/TMV), Hi-Tech (TECL/TECS), Health (LABU/LABD), and euros (ULE/EUO). One can choose a pair of ETFs in a sector and just keep switching between long and short versions depending on the trend in that sector. The five top sectors are the most profitable groups. The choice of sectors would be determined by which trends are strongest at any one time.
Please note that some of these ETFs are leveraged products unsuitable for most investors. Investing in these types of exchange-traded products (ETPs) involves heightened risks, including higher margin requirements, leverage, derivatives, and complex investment strategies. The investor should be aware of these increased risks and realize that swings in price can be exaggerated when compared to other securities. These securities are intended to be used as short-term investments. For these reasons, I have recommended paying close attention to movements in the prices of these securities. I recommend reading the descriptions on your brokerage site before investing in them.
When to Buy
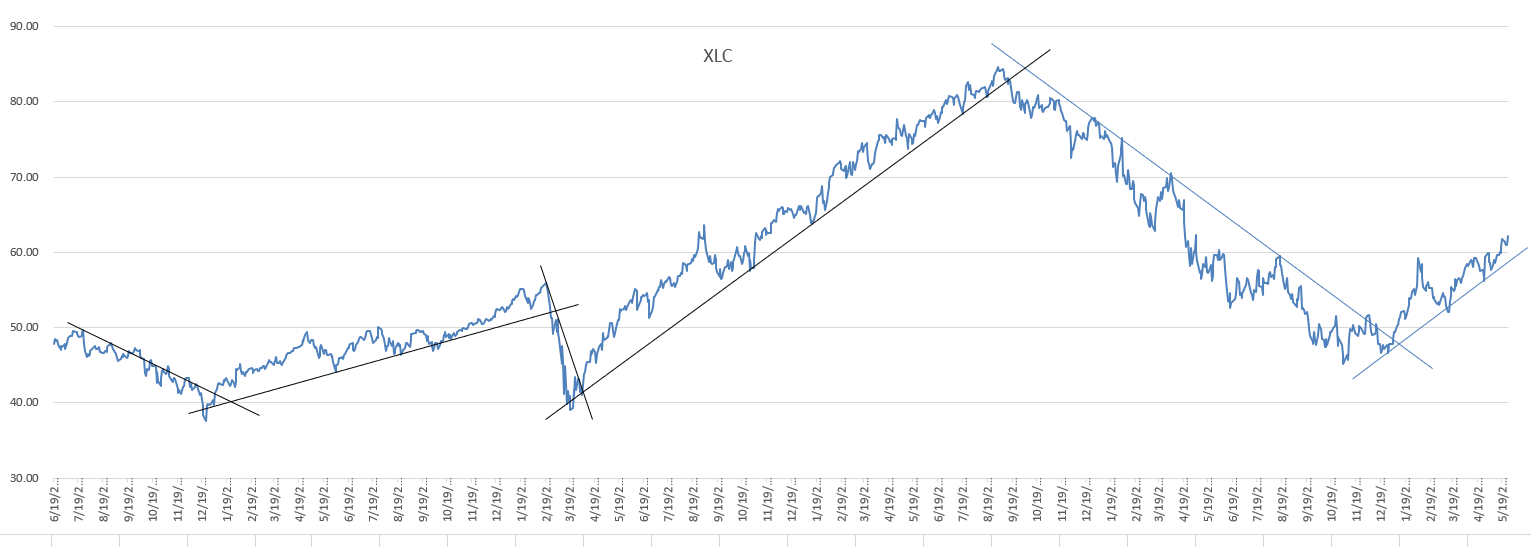
Now the question becomes when to buy. For me, as a technician, this is an easy question. The chart will always tell me all. Once the rankings are in, I draw trend lines (either support or resistance) on the chart, and a break in the trend gives me the signal. This is the most basic technical study to make, and it turns out to be one, if not the best, study. Going back to the beginning of the data, this simple procedure rarely fails to give the best signals. Granted, I have been drawing trend lines now for 45 years+, and I'm pretty good at it, but with just a little practice, anyone can master the technique. My general guideline is to ensure the line hits at least three points on the graph (the line can violate some close points on the price line). The more times it hits the price, the better. Drawing the lines is an art, and it takes practice. Also, the trend line may not just hit the lowest points on the price line but may connect to other points. It takes judgment on the part of the one drawing the line. There may also be several trend lines in the same direction. The chart below shows the price history from 2018 to the present, with trend lines to illustrate significant turning points.
3-Year Chart XLC (Excel Chart Using Yahoo! data)
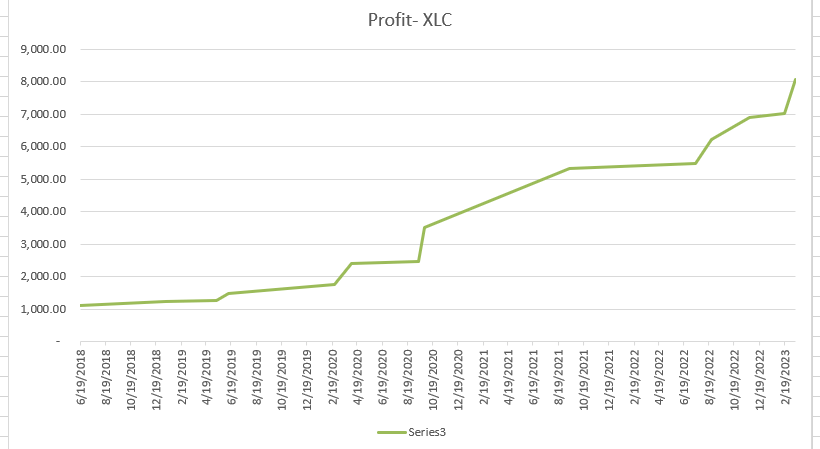
To show the profit curve of this strategy, see the chart below starting with $1000:
Profit Chart Results (Excel Chart using Yahoo! data)
Obviously, this does not show the day-to-day movements but shows buys and switches only for simplicity's sake. Using the trend lines shows longer-term intermediate changes in trend. This is for the investor that desires the simplest method to improve the results.
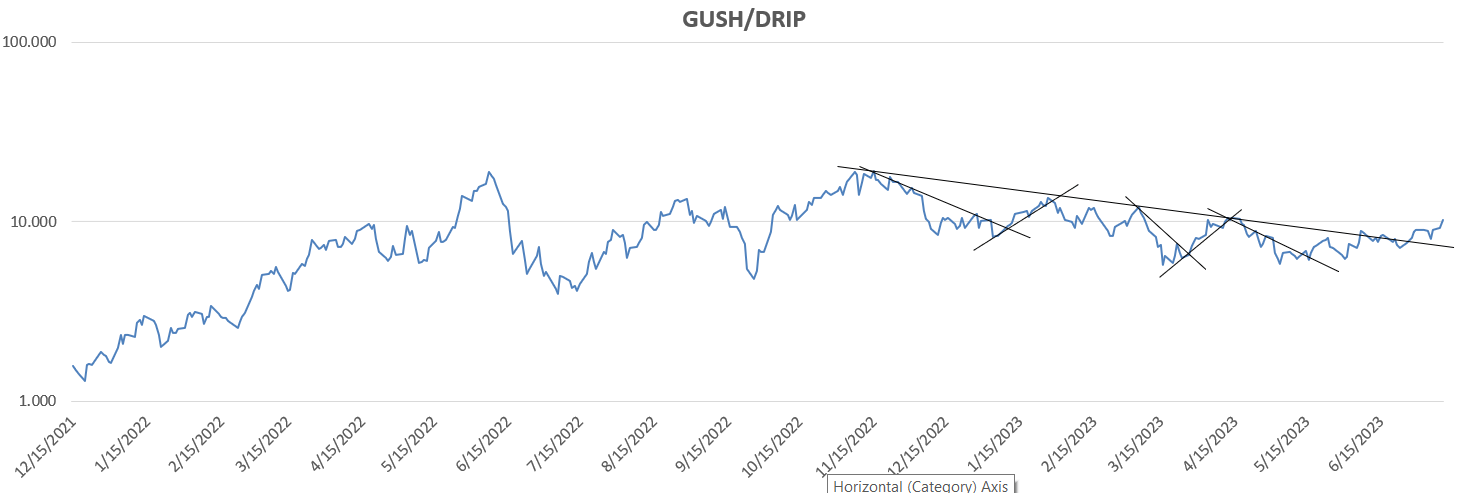
Another tool I've used but don't anymore is the spread between the long and short versions of the ETF. For example, I divide the GUSH by DRIP and get a line that exaggerates the changes in trend. When the trend of one is up then the other must be down. This spread exaggerates the differences and should show me an enhanced view of the trend changes. An example of this is shown below:
Spread Chart - GUSH/DRIP (Excel chart using Yahoo! data)
I finally decided that even though this method worked well, using a chart of just the long side ((GUSH)) was sufficient. The turning points were the same, so using them was less beneficial than I thought it would be. The reader might have a different opinion, so it may be beneficial to try them anyway.
The question often arises as to why one does not just buy and hold a good position for years if fundamental analysis shows that the position will be profitable over time. I see this all the time. I have two answers to this question.
First, fundamentals change, and if one finds that a fundamental quality does change and uses that to make decisions to buy, sell, or liquidate, that is timing just as much as trend lines. You're just using different signals. You are also assuming that you always have all the relevant information. Even then, maybe you do, but anticipation also moves the market. If enough traders anticipate a change, the market will change. The price does not necessarily have to accurately reflect the real, fundamental situation.
Secondly, these instruments are usually intended to be for short-term positions. They are meant to be used to take advantage of diversification and hedging. They are like mutual funds that can be liquidated at any moment. As with most financial instruments, they are a tool investors use to grow their wealth. As with any investment, one should never fall in love with any investment vehicle.
Buy and Hold vs. Occasional Position Reversing
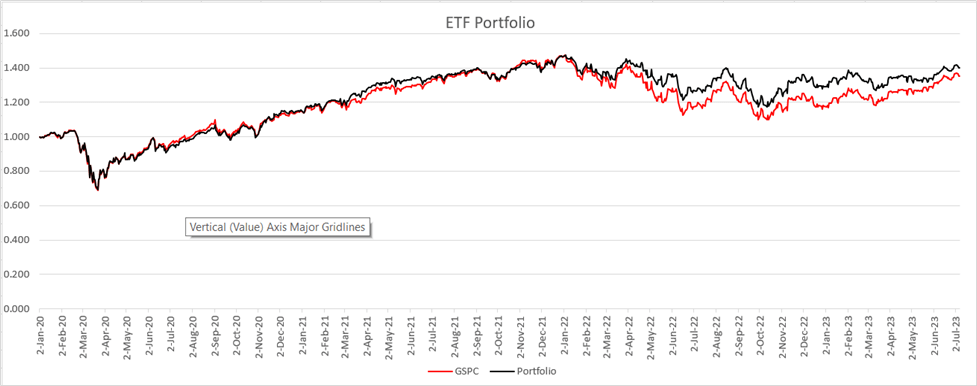
Recently I ran across an article that promoted a portfolio of four ETFs that returned dividends to the investor at a good rate. Out of curiosity, I downloaded the data for these ETFs going back to January 2020 to see how they performed relative to the S&P 500. The ETFs performed quite well and gave the investor a decent return. But true to my nature, I decided to play with the data and see what would happen if I changed it slightly to include some trend line changes. The four recommended ETFs were VIG, SCHD, QQQ, and SPHD. The chart below compares the total portfolio (in black) with the S&P 500 (in red):
Comparison of Portfolio and SP500 (Excel using Yahoo data)
As the reader can see, the results of the portfolio (assuming an even distribution) do quite well when compared to the S&P. Realizing that 90% of mutual funds cannot outperform the S&P, this is an excellent alternative strategy to mutual funds. The price in the line includes the dividends paid.
Then I tried some engineering on the portfolio. I decided to make one slight change to see what would happen if I switched from QQQ to SPXS when the S&P violated the current trend line. In other words, if the S&P is in an uptrend, I would buy the original four ETFs. If the S&P were to change the intermediate trend (violate the trend line) to negative, I would sell the QQQ and buy the SPXS, a negatively leveraged S&P ETF. When the S&P is declining, SPXS advances. That being the only change, the chart below shows what happened:
Comparison of Altered Portfolio and S&P (Excel chart using Yahoo data)
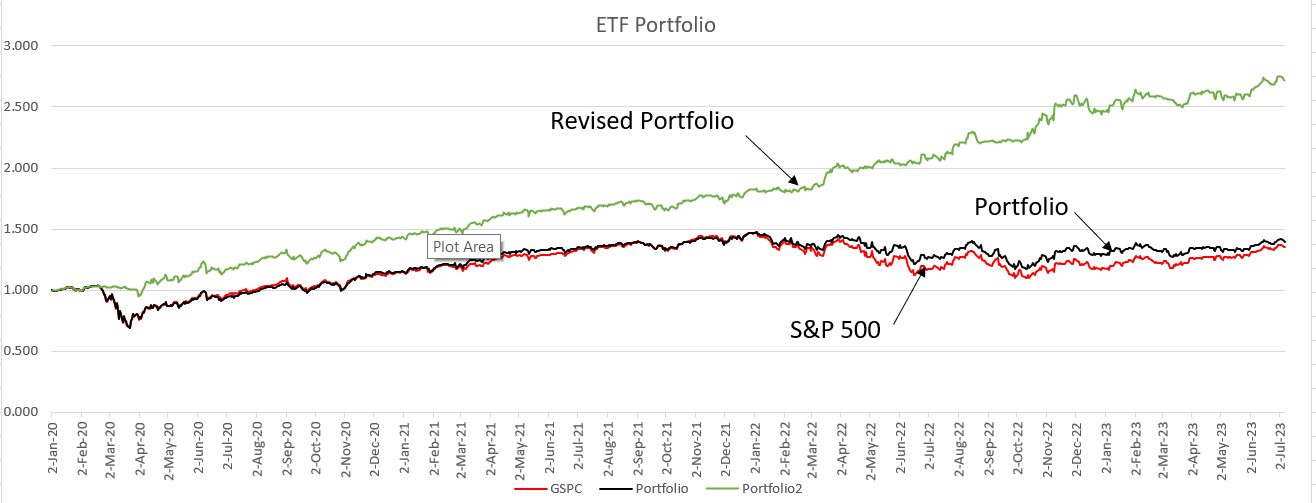
As is obvious, the major declines of the original portfolio were eliminated, and a greatly improved result occurred. In terms of implied annual percentage rate return, the original portfolio returned 10.0% compared to the S&P 500's return of 8.9%. The return of the revised portfolio was 32.9%, more than three times as much for only making ten short-term changes over three and a half years, and the drawdown was reduced to a minimum. It takes minutes a week to identify the changes in trend.
Conclusion
Investing in ETFs is an excellent method of investing exclusively or in tandem with a stock portfolio. Personally, I use these as an adjunct to my regular portfolio because my method of determining the best stocks works well. I recommend that the reader consider these valuable vehicles when deciding which investments to make. Using technical analysis when monitoring each investment in the portfolio is worthwhile for all investors. Even using the most basic form of technical analysis is usually far more profitable than "buy and hold." I do not recommend reversing for every short-term change in trend, but only for the intermediate term, which generally lasts four to ten weeks. The nice thing about timing is that the chart will tell you when to make the change, and if you turn out to be wrong, you can reverse it quickly. This happens occasionally, but the results prove the exercise to be worthwhile.
For further details see:
The Effect Of Technical Analysis On ETF Investing