SNPMF - The Largest Global Energy Companies Ranked By Quality
2023-03-30 10:20:12 ET
Summary
- The eight largest energy companies in the world were evaluated for relative quality.
- Based on this analysis, ConocoPhillips appears to be the best prospect by a very thin margin.
- China Petroleum & Chemical Corporation and BP p.l.c. rank lowest for relative quality and may be over-valued.
- Investors are advised to consider this analysis as only a starting point for their own due diligence.
Background
I feel like it is appropriate to begin with a couple of disclosures. I have been an energy sector bull since way back. Perhaps I am most proud of dragging my wife away from the hotel pool and taking her with to visit the Ocean Star Offshore Drilling Rig & Museum while on vacation in Galveston, Texas. I have closely followed the energy sector including its largest companies for several years.
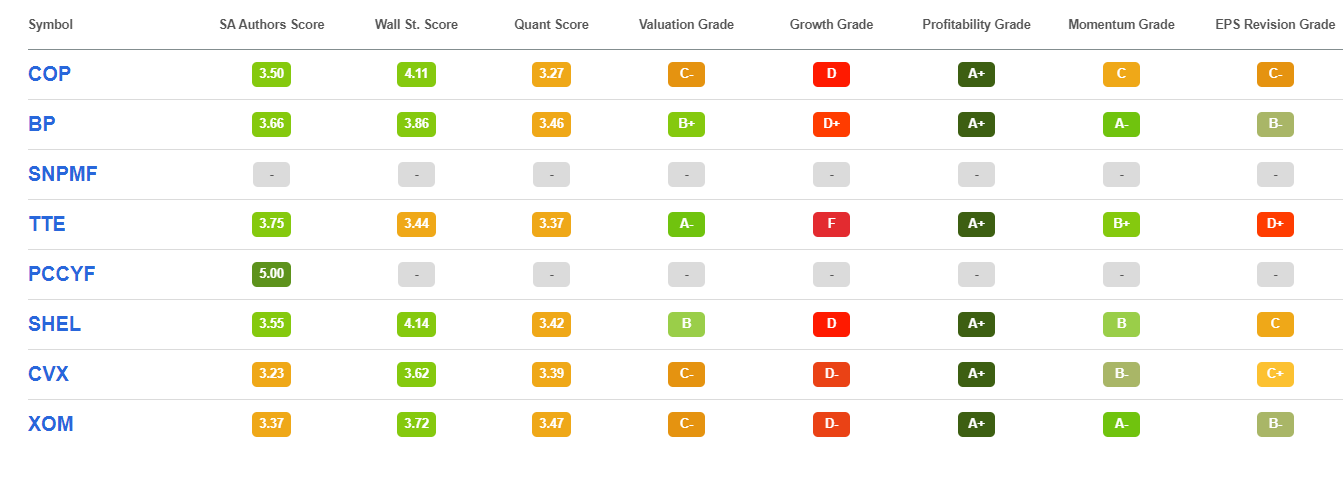
The eight energy companies evaluated below are the largest energy companies by market cap. As such, with exceptions, they receive more than adequate analyst attention. The exceptions are PetroChina Company Limited ( PCCYF ) and China Petroleum & Chemical Corporation ( SNPMF ).
Largest Global Energy Companies Ratings
PCCYF and SNPMF are not covered by Seeking Alpha's Quant Rankings or Wall Street analysts. PCCYF was last covered by a Seeking Alpha author on January 24th while SNPMF has never been covered by Seeking Alpha authors.
Relative Quality Evaluation
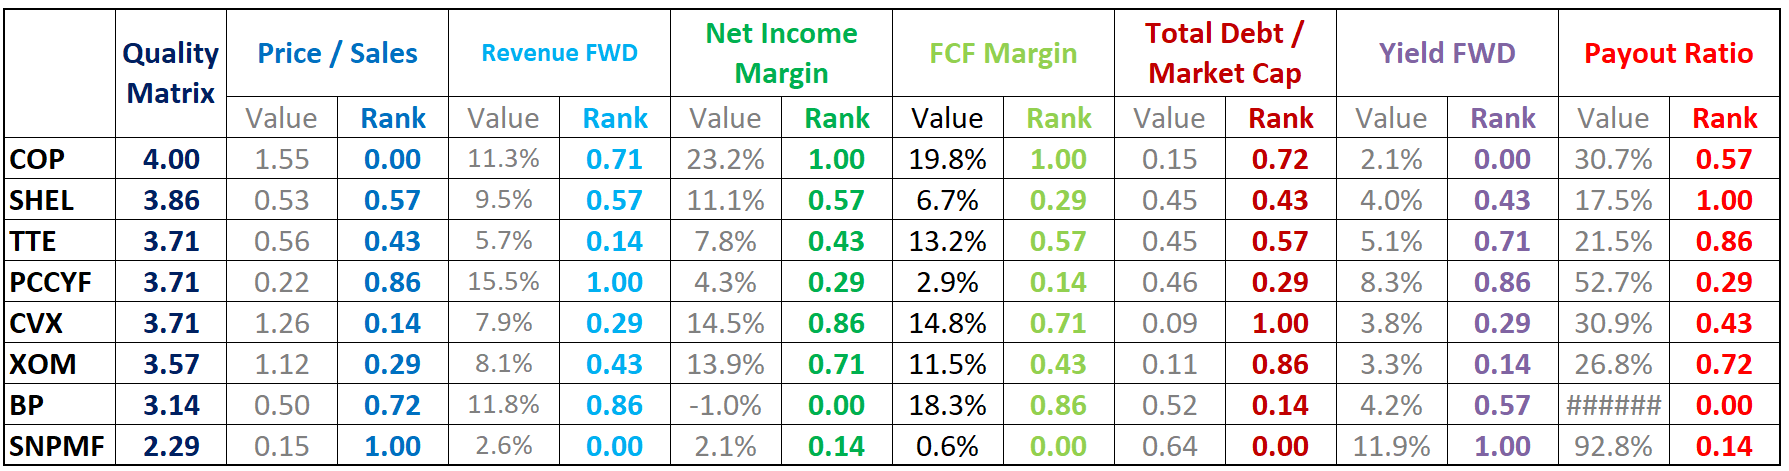
These eight largest energy companies by market cap were evaluated using a quality matrix with factors including Price/Sales, Net Income Margin, Free Cash Flow Margin, Total Debt/Market Cap, Forward Yield, and Payout Ratio. The values for each company's factors were normalized by means of statistical percent ranking with relation to the group. The quality matrix was calculated as the sum of the percent ranks of the factors.
Quality Matrix Chart
The above chart is sorted in descending order of the best quality (highest matrix score) to the poorest quality (lowest matrix score).
Quality Matrix Plot
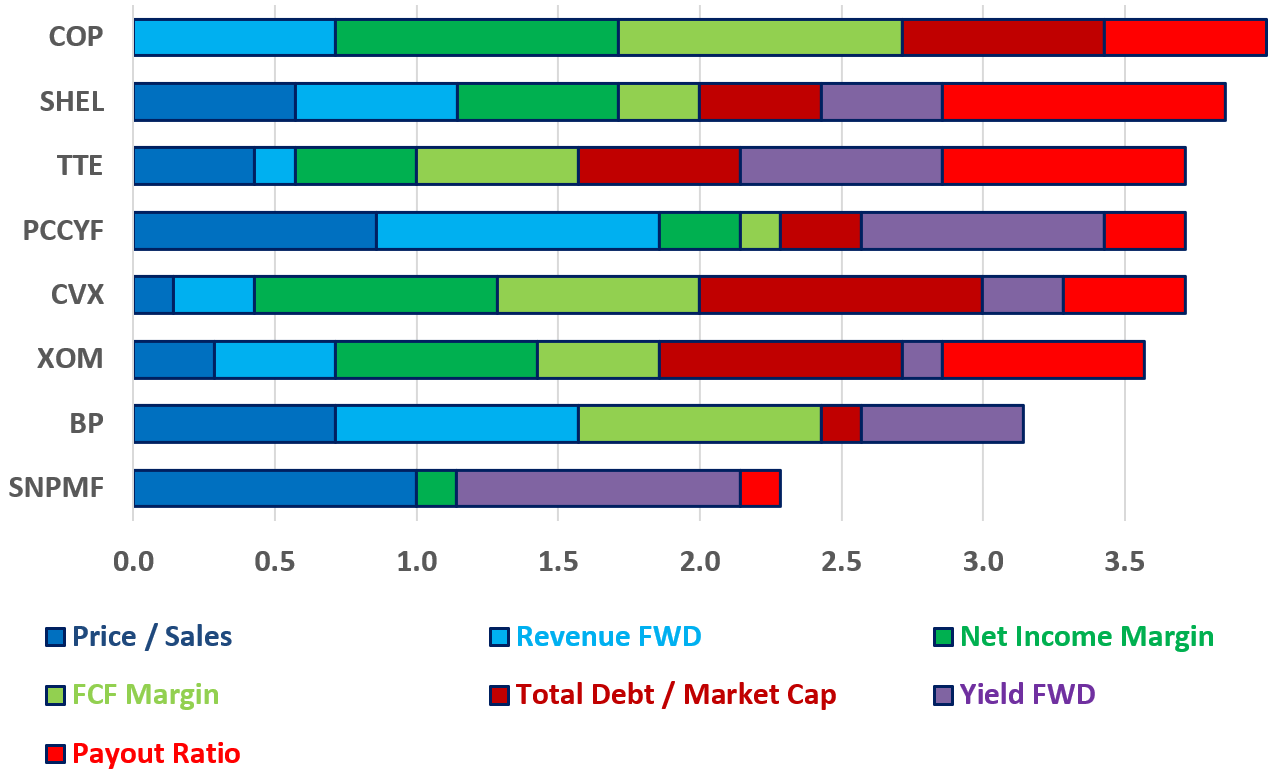
The quality matrix is presented graphically in the stacked bar chart above with cumulative inputs for each factor. Based on this analysis, ConocoPhillips ( COP ) and Shell plc ( SHEL ) rank first and second respectively. TotalEnergies SE ( TTE ), PetroChina Company Limited, and Chevron Corporation ( CVX ) are exactly tied for third place followed closely by Exxon Mobil Corporation ( XOM ).
Based on this analysis, China Petroleum & Chemical Corporation ranks dead last despite having the most favorable Price/Sales ratio and the highest forward yield. BP p.l.c. ( BP ) ranks second to last and recently reported full year losses in a year where many energy companies reported record profits.
PCCYF recently reported record full year earnings but, based on a preliminary review of PCCYF's most recent investor presentation, I do not expect its ranking to change.
Screening and Quality Matrix Limitations
Investors should consider the quality matrix a screen only. The matrix and its factors, normalization method, and weights could all be adjusted and yield different results. Further, the matrix is based on the most readily available and common metrics. These metrics can change rapidly with share price or as new company reports are released. It does not include company-specific data available in quarterly reports and presentations. Every investment decision regarding an individual equity should be based on comprehensive analysis of that equity.
Conclusions and Recommendations
Although relative quality rankings are very close for the highest ranked energy companies, COP appears to be the best prospect. SNPMF and BP appear to be overvalued relative to their large global energy peers. However, individual investors are advised to consider this analysis as only starting point for their own due diligence
Information is a source of learning. But unless it is organized, processed, and available to the right people in a format for decision making, it is a burden, not a benefit. - William Pollard (Physicist and Theologian)
For further details see:
The Largest Global Energy Companies Ranked By Quality