SCHI - The Next Default Cycle Has Started And It Will Likely Crack Interest Rates
2023-12-03 06:42:06 ET
Summary
- Rising delinquencies signal the U.S. entered the next default cycle.
- Stress emerging from several credit sectors.
- Mass debt maturity wall threatens to escalate the defaults.
- Higher for longer has consequences.
Debt structure - leverage
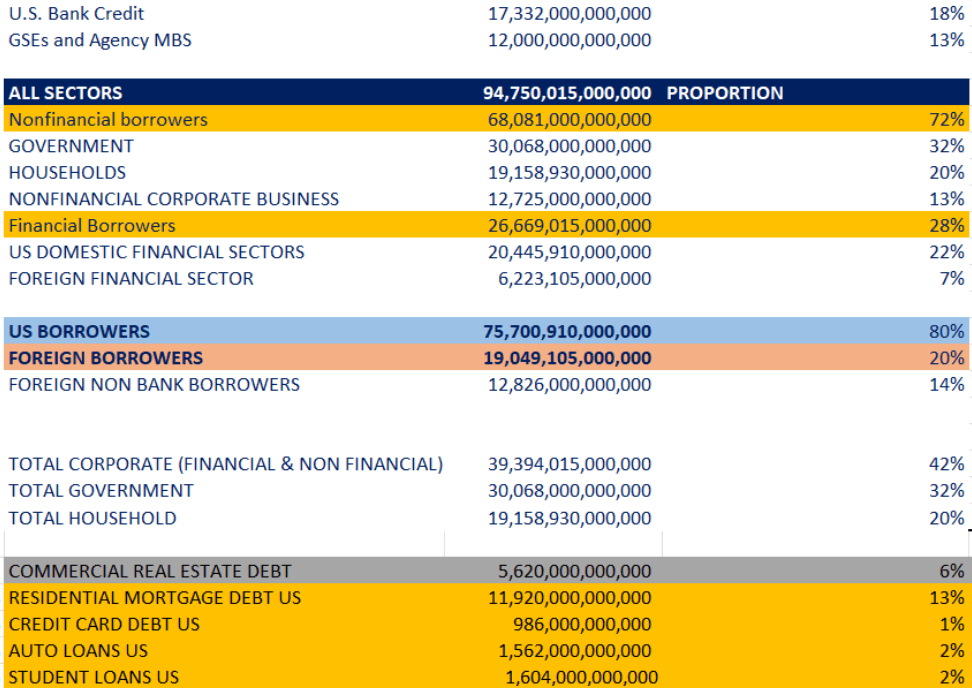
The current recorded on-balance sheet dollar liabilities are $94,75 Trillion. See the breakdown below:
TOTAL DOLLAR LIABILITIES (FRED, BIS)
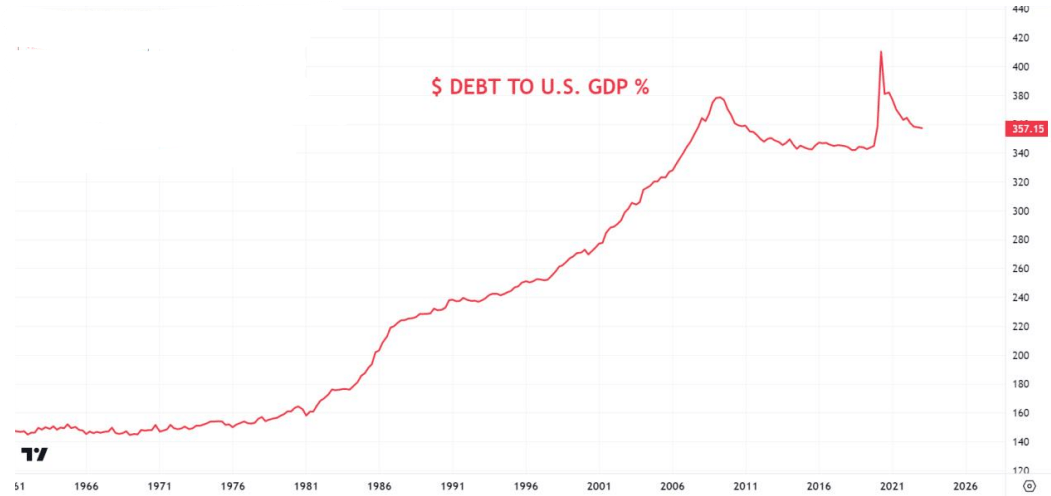
Current dollar liabilities is 357% of U.S. GDP currently (recorded $94 T., not included $80T FX Swaps, other offshore bilateral repo transactions). After the GFC dollar leverage (recorded on balance sheet) structurally decreased from 380% of GDP to 340% by the end of 2019. In a response to COVID debt to GDP jumped to 410%, since than moderated to 357%.
U.S. Debt to GDP (TRADINGVIEW)
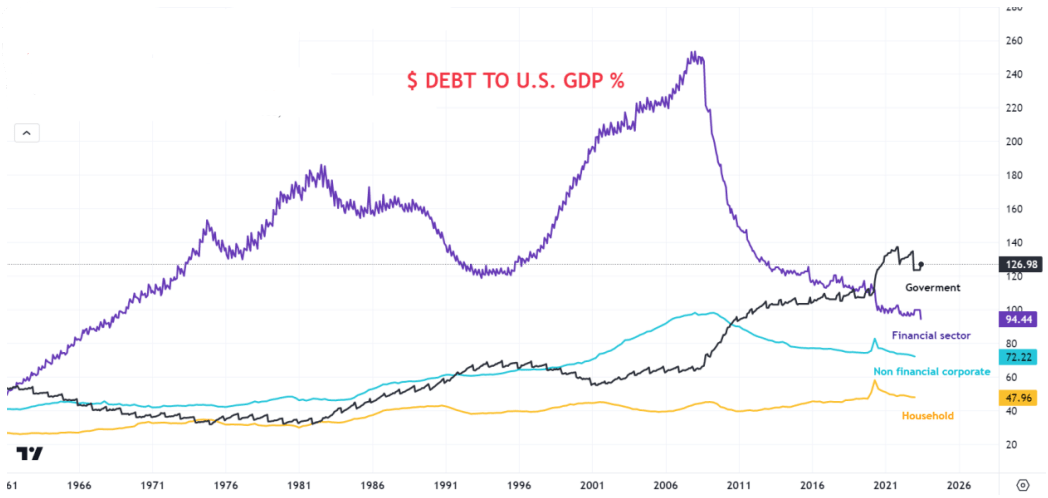
To break down the dollar leverage, we can observe that after GFC the non-financial corporate sector has deleveraged (from 100% to 72 % of GDP), while the household sector leverage remained mostly unchanged. 14 On the surface financial sector leverage has fallen of the cliff (from 260% to 95% of GDP) while the government leverage has doubled from 65 % to 127 %.
SECTOR DEBT TO GDP (TRADINGVIEW)
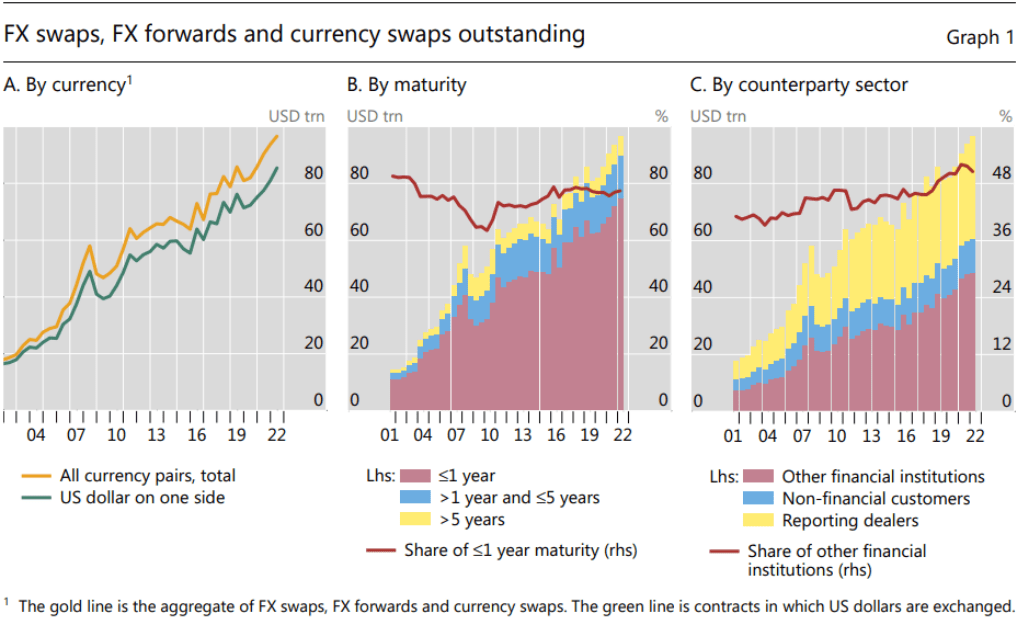
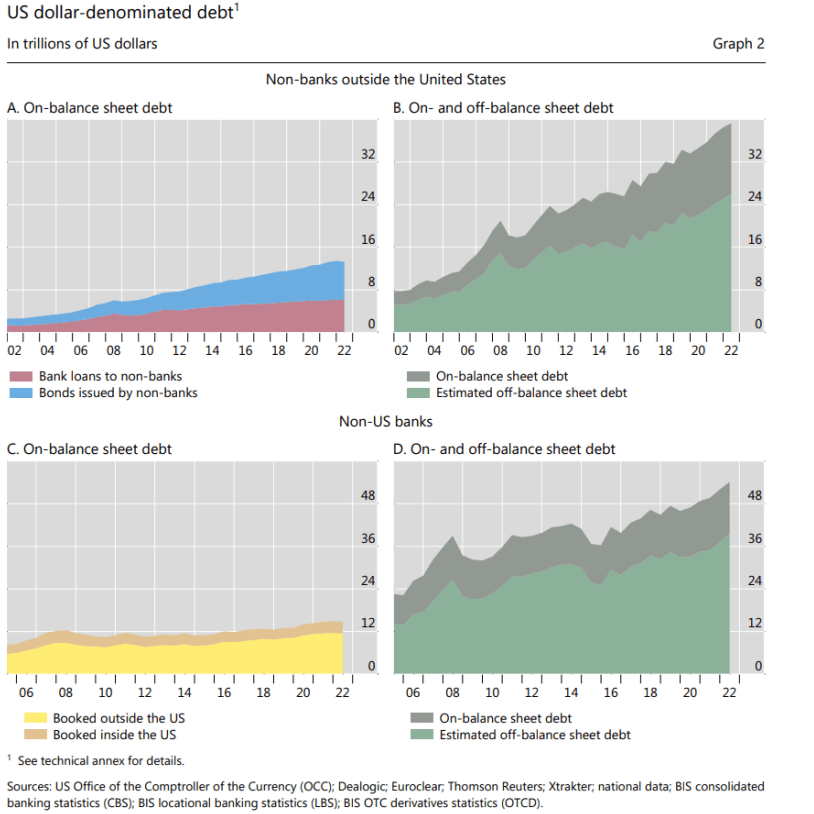
Financial sector leverage worth further explanation. On one hand, regulation got much tougher with large regulatory transformations, such as Basel II. and III. , Dodd - Frank etc. Banks were forced out from proprietary trading, leverage ratios had to go down and so on. A lot's of risk taking were transferred to non -bank financial institutions (hedge funds, private credit etc.) However, due to the excessive regulatory burden a growing volume of debt obligations were transferred from on balance sheet to off balance sheet in the form of FX Swaps and forwards. According to the BIS financial institutions (reporting dealers and other financial institutions ) have around 75 Trillion $ value of FX Swaps and forwards , from which 80% is a dollar obligation, that accounts for 64 Trillion $ off balance sheet financial sector dollar liability. That is around 256% of U.S. GDP off balance sheet financial sector leverage. By comparison, this was 36 Trillion $ in 2008. If you add on and off balance sheet liabilities financial sector dollar leverage decreased from 380 % to 368 % of U.S. GDP since 2008. Suddenly we have a dramatically different leverage picture of the financial sector. If we include non-financial off balance sheet dollar liabilities as well, total dollar leverage changed from 677% at GFC to 705 % of U.S. GDP currently. (from 105 Trillion total credit to 180 Trillion.) What has really happened is the financial system transferred its obligation from on balance sheet to off balance sheet due to the excessive regulatory burden, which makes global leverage looks like decreased since GFC and much less for what it really is.
FX SWAPS OUTSTANDING (BIS) FX DERIVATIVES STATISTICS (BIS)
Borrower: Government
As discussed in the previous section, the U.S. government debt to GDP has doubled since GFC. The government debt grew by 240% since 2008, meanwhile US GDP only grew by 76 % in the same period. Federal debt reached the economic output in 2012 and surpassed it by almost 6 trillion $ since.
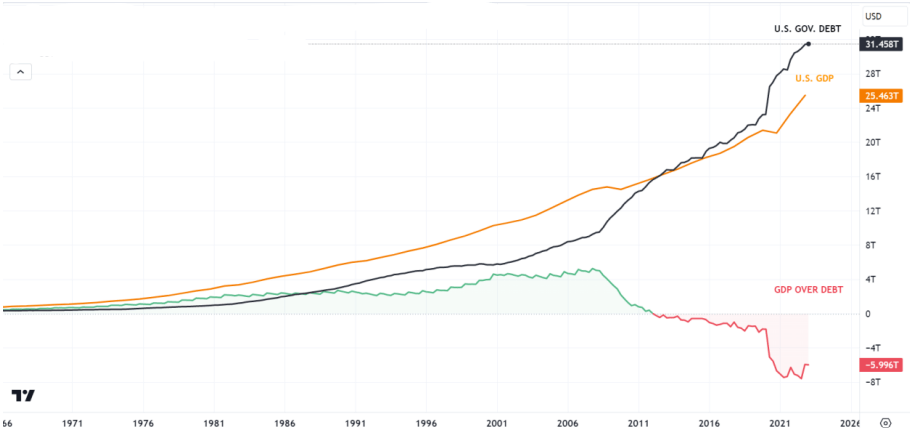
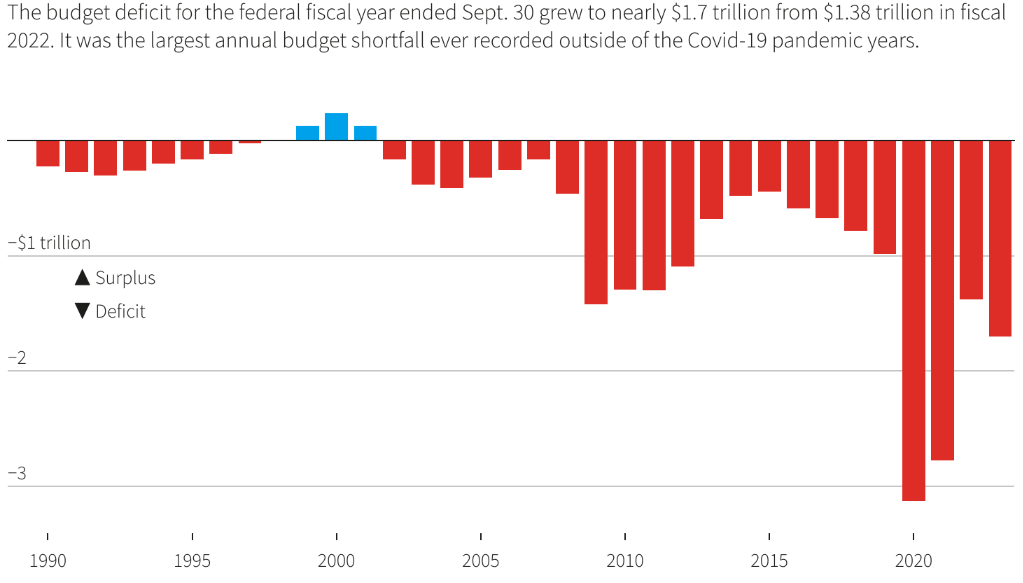
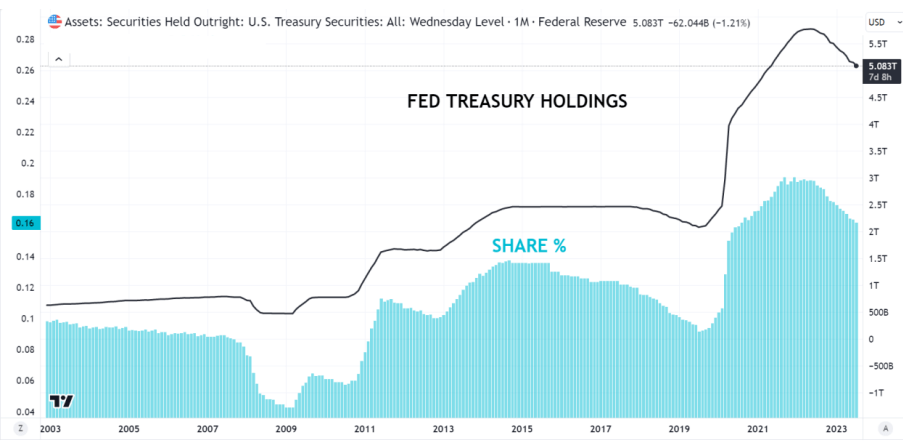
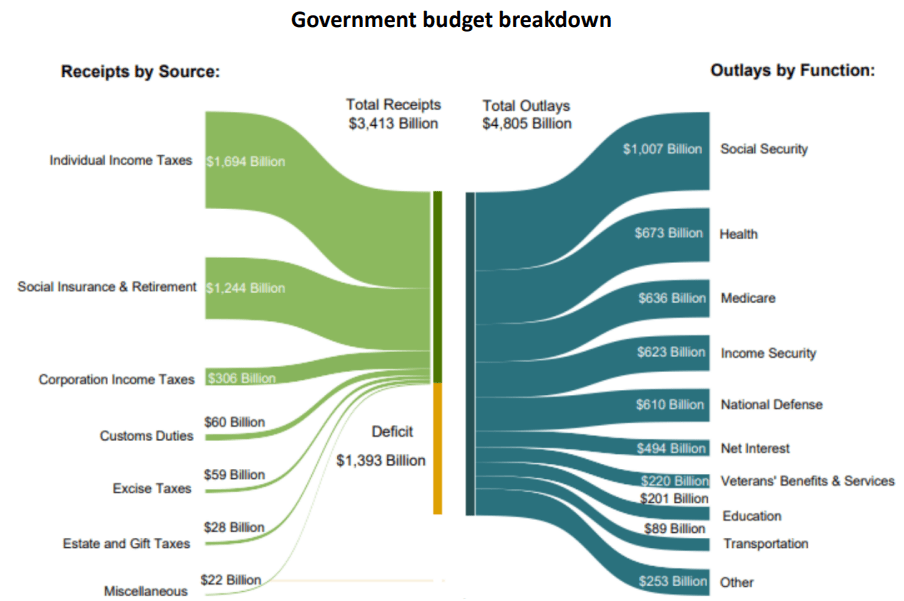
Part of the reason is the federal government ballooning budget deficit. Since GFC the U.S. Government ran an ever deepening budget deficit (except 2013). Another aspect is, that at each downturn in the past 15 years, the government responded by adding more debt which mostly ends up in the central banks' balance sheet. The Federal Reserve is currently holding 16% of US Government debt, however it has reached 20% in 2021. The FED is currently in the process of running down its balance sheet, doing it by letting the bonds mature and not bidding for new securities in the same quantity.
U.S. BUDGET DEFICIT (REUTERS) FED TREASURY HOLDINGS (TRADINGVIEW)
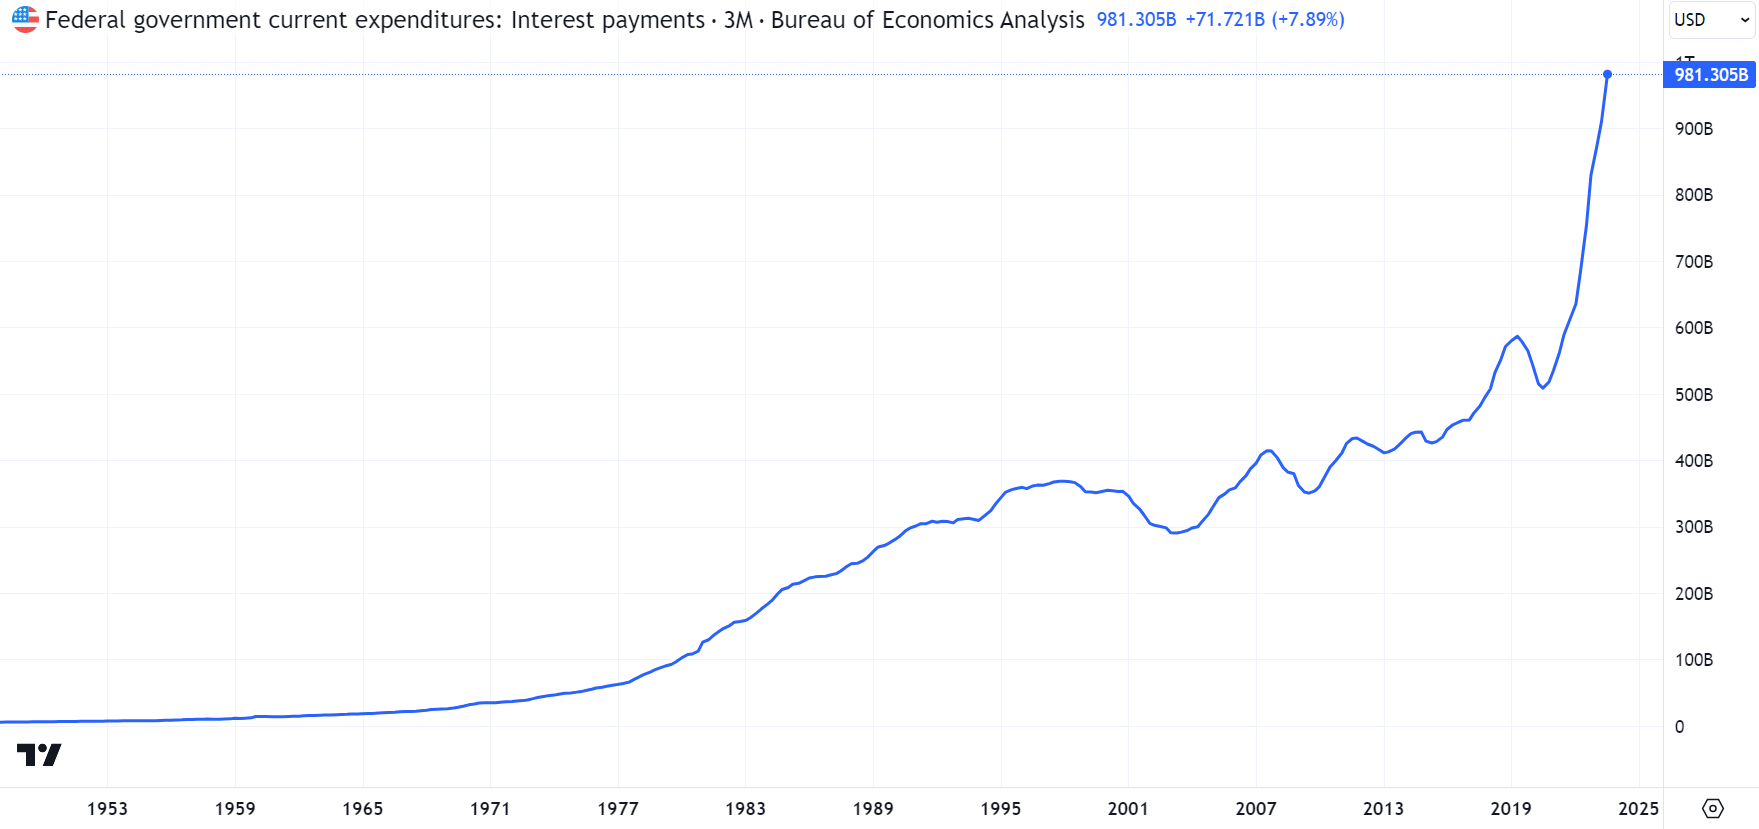
As we can observe, currently the Federal Government interest expenditures has skyrocketed due to the fight against inflation. However, as we noted in a previous study , the FED interest rate policy has yet to fully effect the U.S. Government debt load. At the end of 2023 the projected yield on U.S. Government debt will be at 2.8 %, far below current market rates or FED fund rate. If the FED keeps rates higher for longer, and if market rates unchanged, the Government debt will be yielding 3.5 % by the end of 2027. That is 59 % increase of yield from current levels. Currently, net interest outlay is 494 billion $, if debt level unchanged (hypothetical) by 2027 the net interest outlay would be 785 billion $ due to yield gradual increase on debt load. That would mean the interest expense is the second largest expenditure of the federal government. Based on simple math, if the federal government keeps on adding 7% of debt annually and it borrows at 4.45% (current 10 year yield), by the end of 2027 it would pay $525 billion interest on the debt added from 2023-2027. That would total $1.3 Trillion of interest expenditure , which is larger than any other expenditure category of current budget. Beware that leverage since GFC has been transferred from private sector to government sector, which increases the risk of a government debt crisis. The united states treasuries are the primary type of collateral in the global financial system, therefore any U.S. government budget crisis would have likely result in the complete meltdown of the global financial system. Yes, the United States can always print dollars, however there is probably a tipping point of budget deficit and leverage when markets would lose faith in treasuries and in the dollar. Also watch out for the growing polarization of U.S. political parties, which increases the risk of a debt cycling crisis.
GOVERNMENT INTEREST EXPENSE (TRADINGVIEW)
Borrower: Corporate and Business
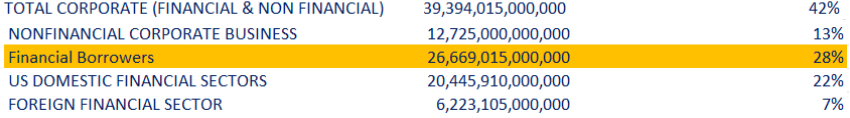
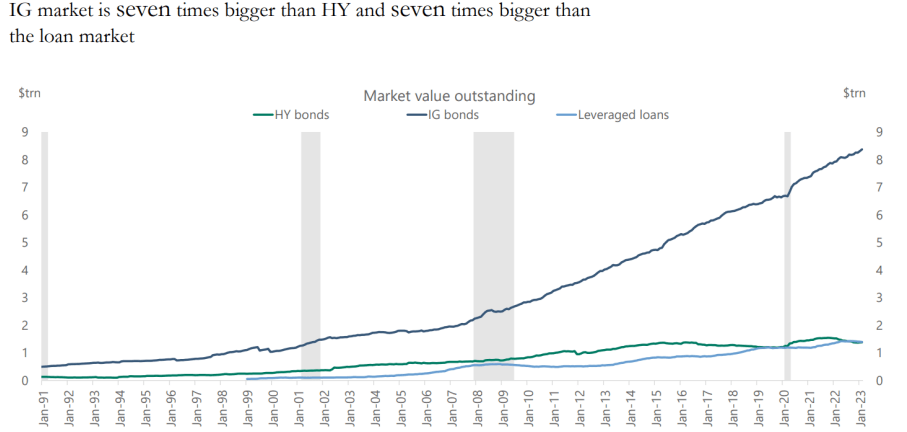
The corporate dollar liabilities accounts for 42% of total on-balance sheet dollar debt. It currently stands at $39,3 trillion. It consist of investment grade and high yield bonds, as well as bank loans and of course inter financial sector liabilities (secured & unsecured).
LIABILITY BREAKDOWN (FRED, BIS) BOND MARKET SIZE (APOLLO) C&I AND CRE LOANS (TRADINGVIEW)
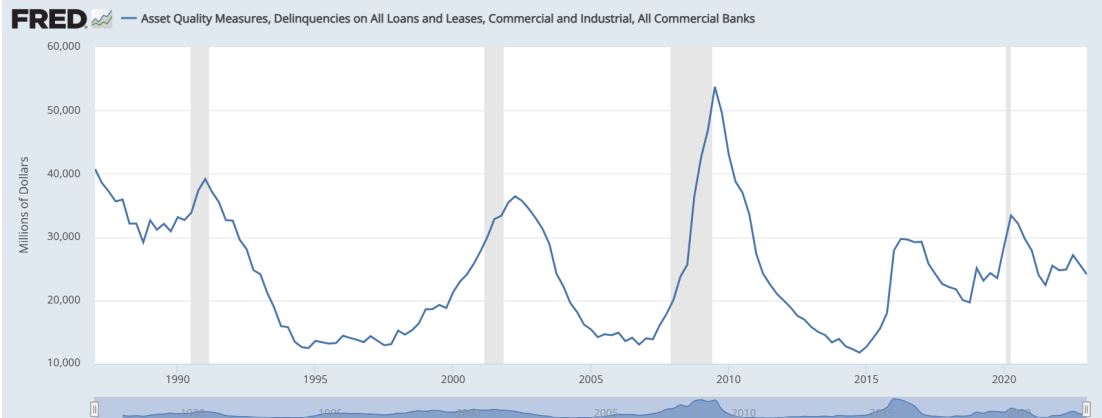
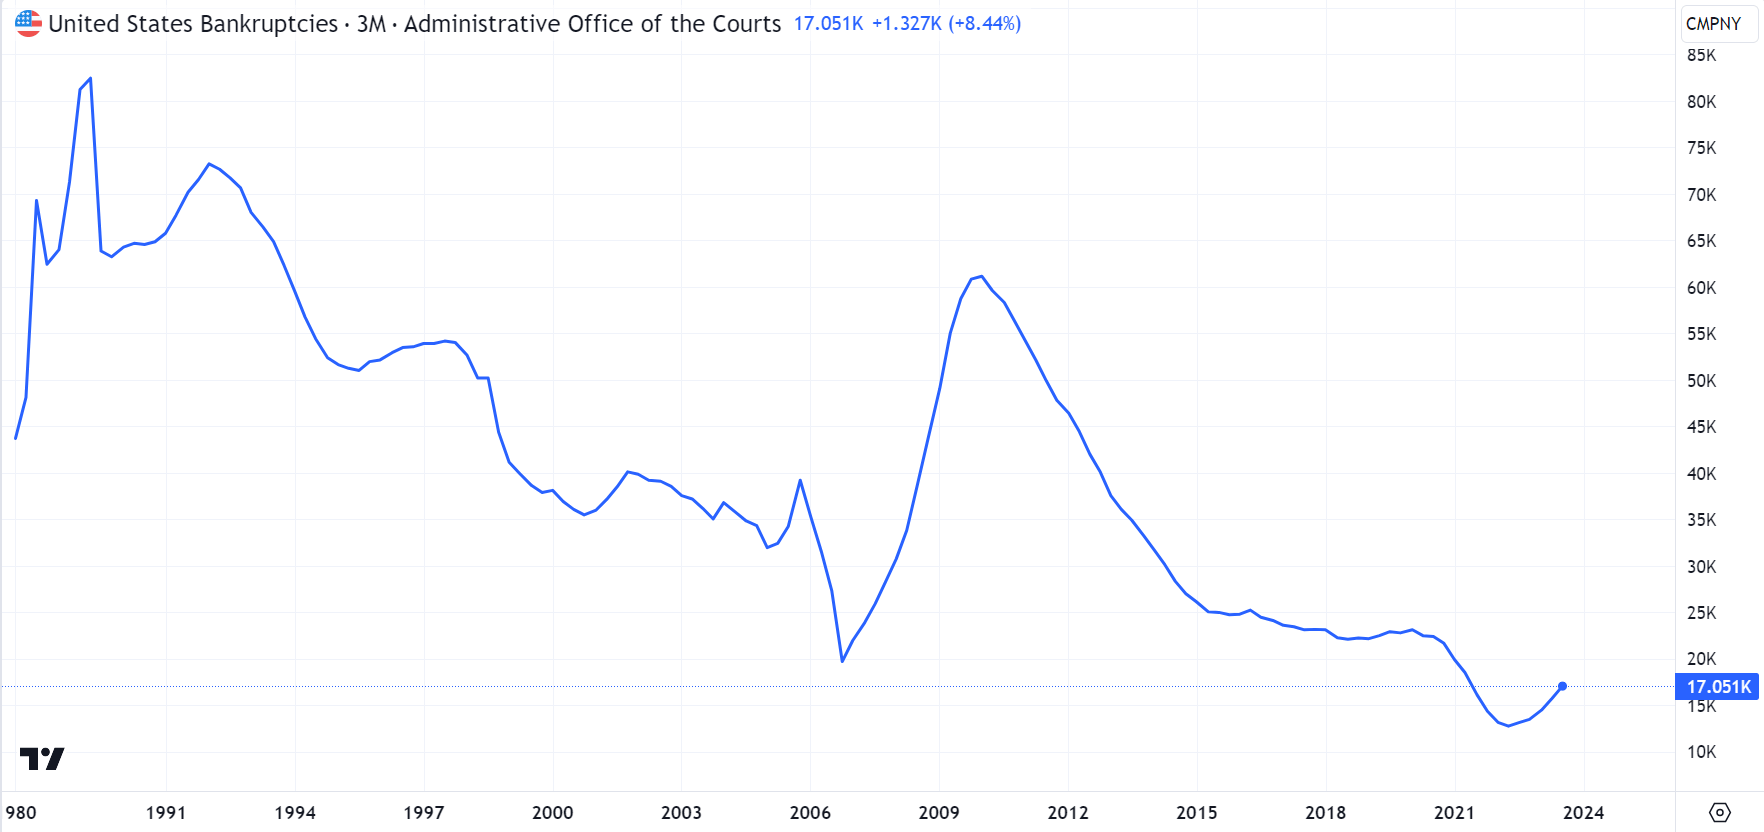
When it comes to the delinquencies at a bank loan level, we are in a longer term secular increase since the 2015 lows, the most recent peak was during the 2020 pandemic. If we look at the short term cycle, C&I loan delinquencies were on the rise by 20% from since the beginning of 2022, however it has cooled down somewhat and the increase hasn't continued in 2023 so far. U.S. bankruptcies are still low but they are on the rise with a 13% increase since cycle low 2022 Q1.
C&I LOANS DELINQUENCIES (FRED) U.S. BANKRUPTCIES (TRADINGVIEW)
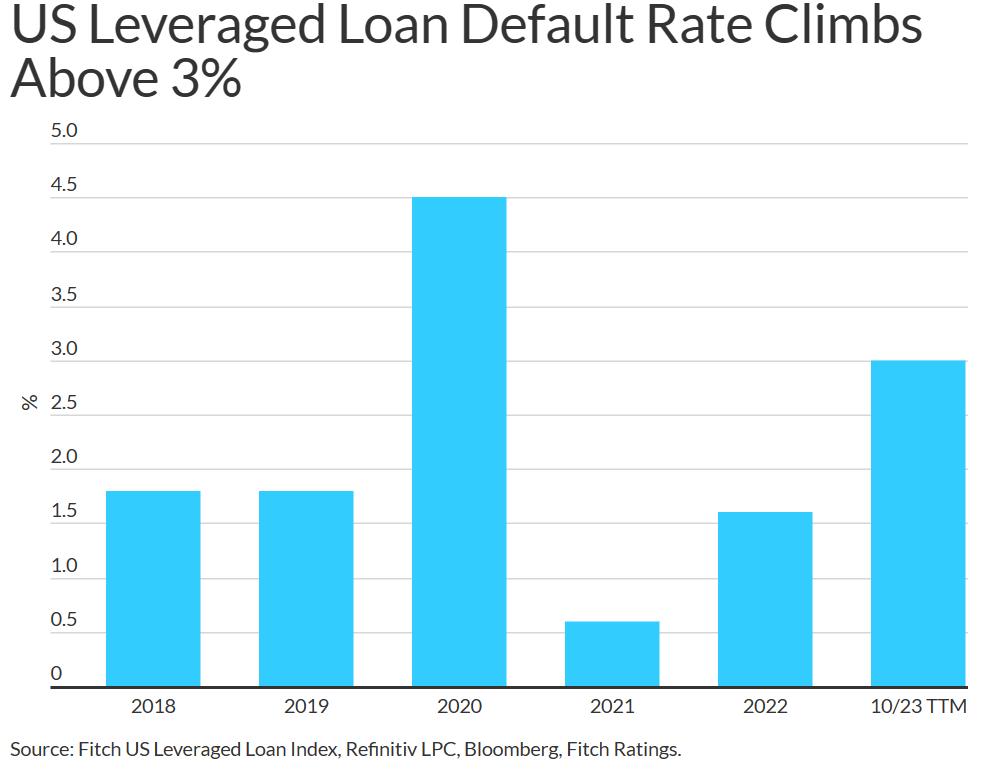
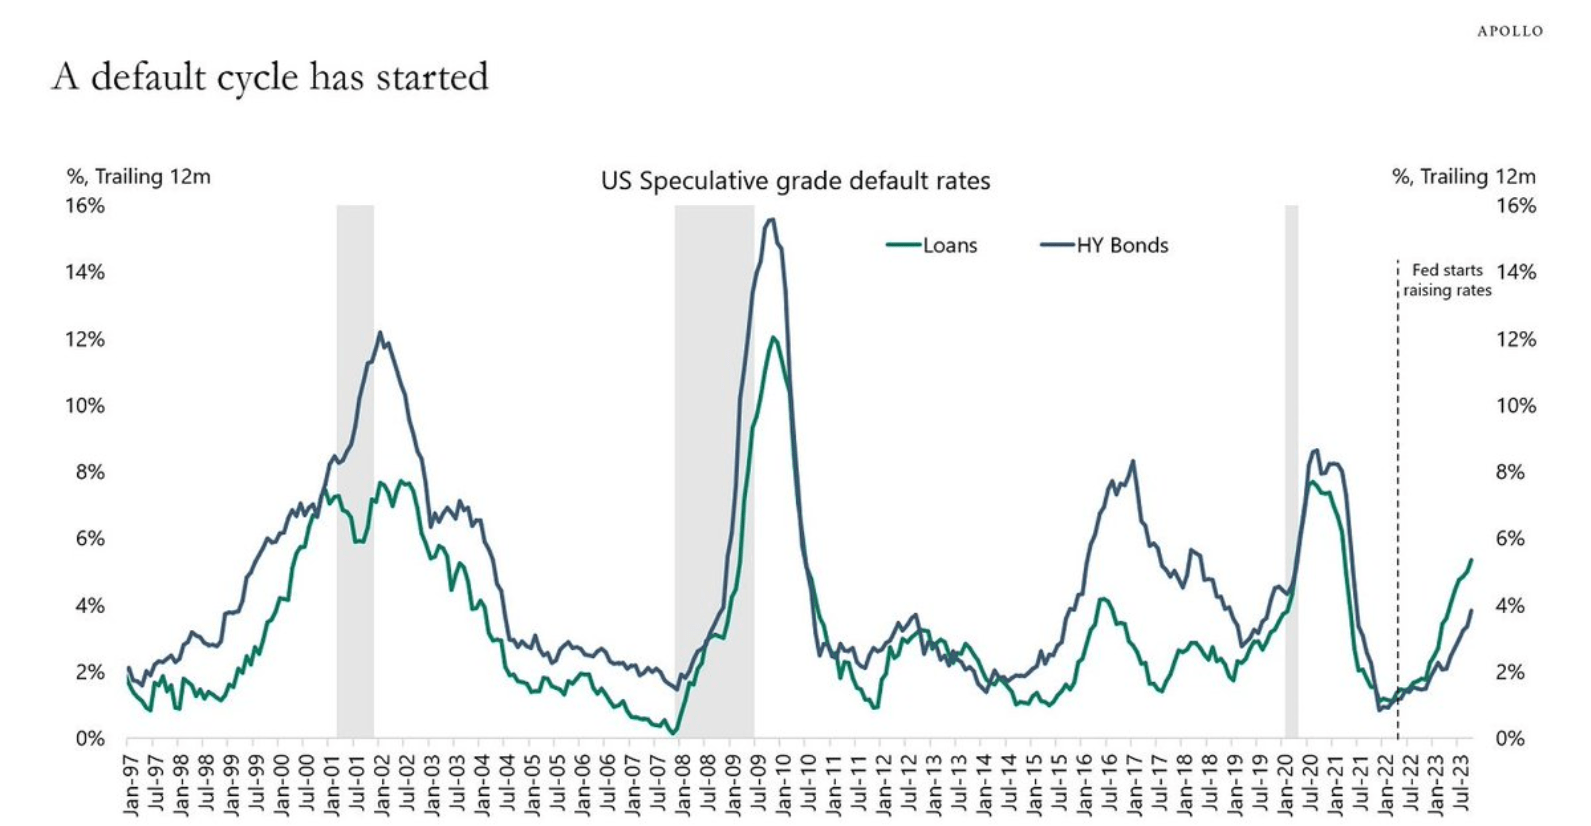
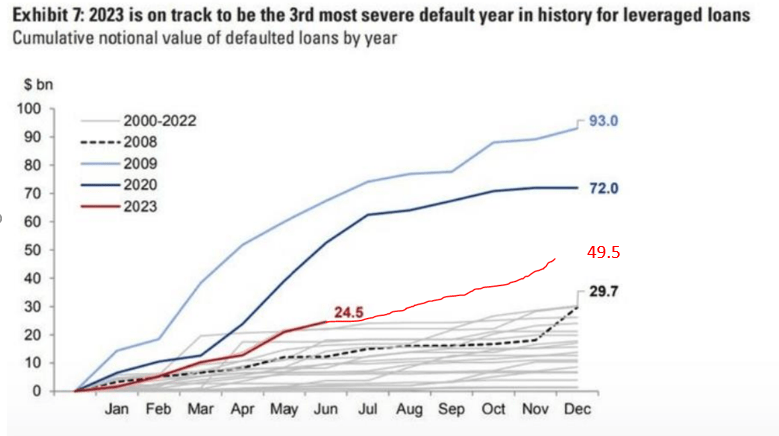
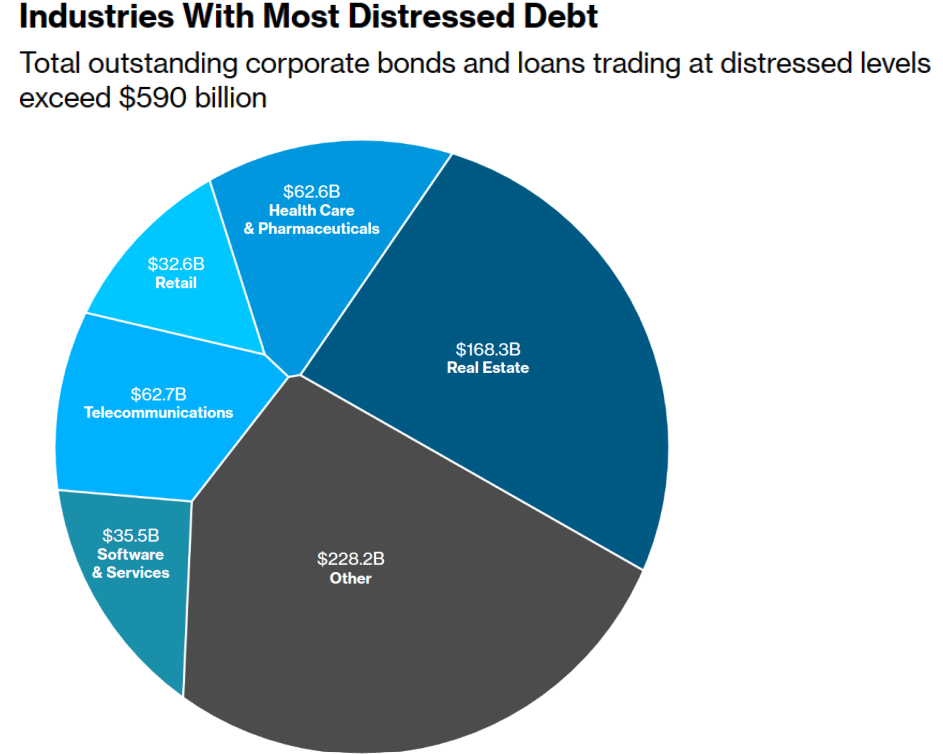
When it comes to leverage loans, they are on the rise too as the default rates climbed to 3% TTM in October. The speculative grade loans and high yield bond defaults are increasing as well, with loans default rate is close to 6%, the 4th largest in the past 20 years after 2001, 2009 and 2020. High yield bond default rate is lagging behind at 4%, which is lower than the 2016 -2017 period. The volume of defaulted loans in 2023 is concerning ($49.5 billion), as only 2020 and 2009 saw more defaults in the first 11 months of the year. This is not the case with high yield bonds, where the defaults ticked up since cycle low 2021 but stagnating since at relatively low levels. The volume of distressed nonfinancial corporate loans and bonds are currently at $590 billion which is around 3.43% of total outstanding. Most of the distressed debt comes from real estate, telecommunications and healthcare.
LEVERAGED LOAN DEFAULT RATE (FITCH) LOAN AND HY DEFAULTS (APOLLO) LEVERAGED LOAN DEFAULTS (APOLLO) DISTRESSED DEBT COMPOSITION (APOLLO)
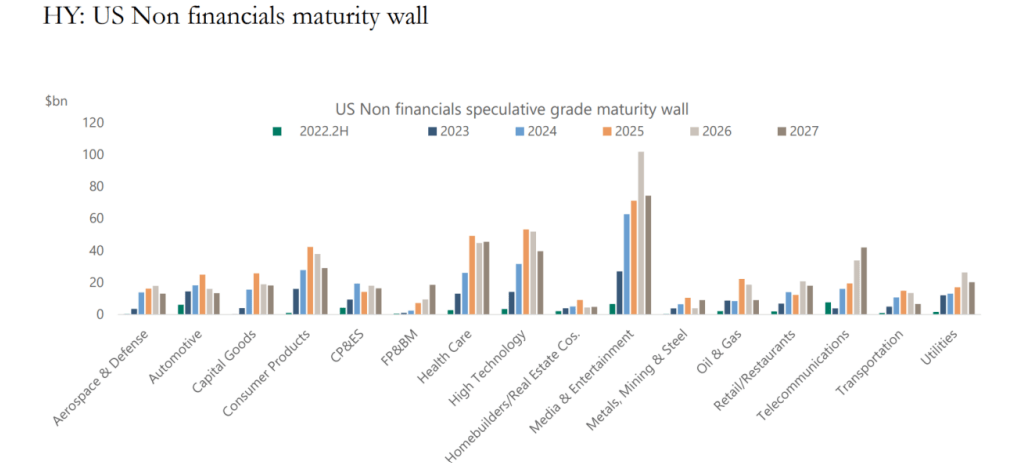
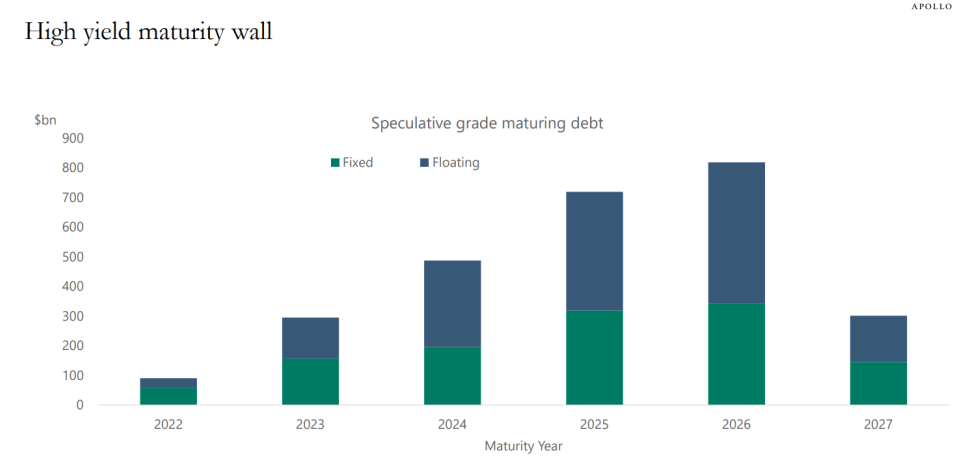
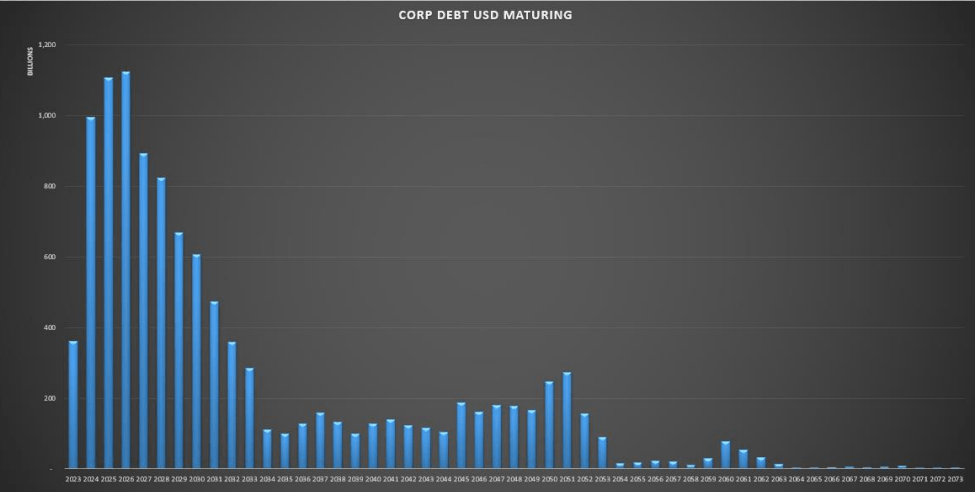
Maturity wall : The answer for the difference of high yield bond and leverage loan defaults probably lies in the maturity wall. Leverage loans are usually floating rate , however half of outstanding high yield bonds are fixed rates and we just entered the 2023-2027 maturity wall. The liquidity and other aspects of refinancing and maturities are discussed in the previous study . It is a high probability assumption that high yield bond defaults would follow leverage loan defaults once refinancing will be in full force and principle payments are due.
HY NON US FINANCIALS MATURITY WALL (APOLLO) HIGH YIELD MATURITY WALL (APOLLO) CORPORATE DEBT MATURING (APOLLO)
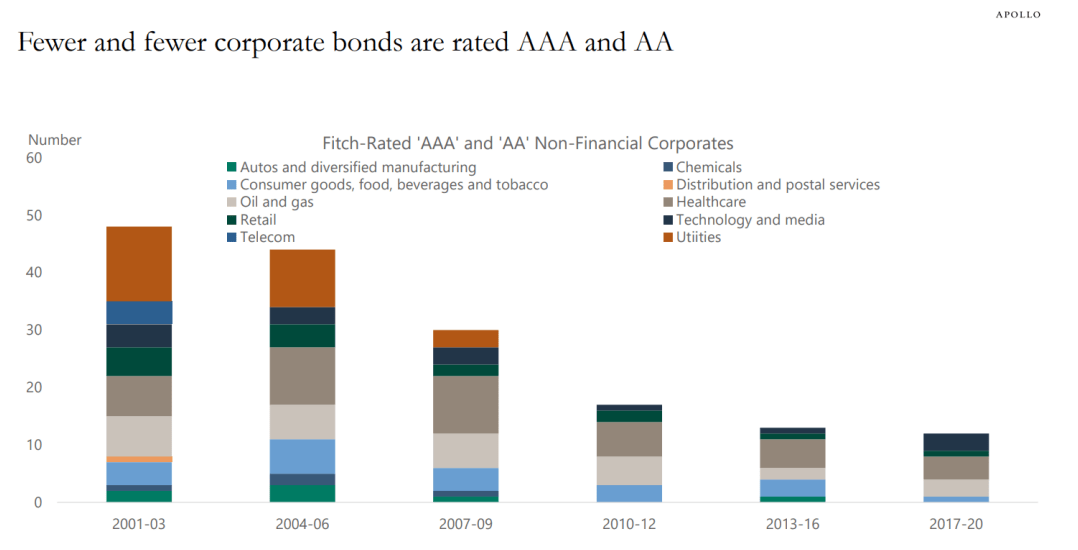
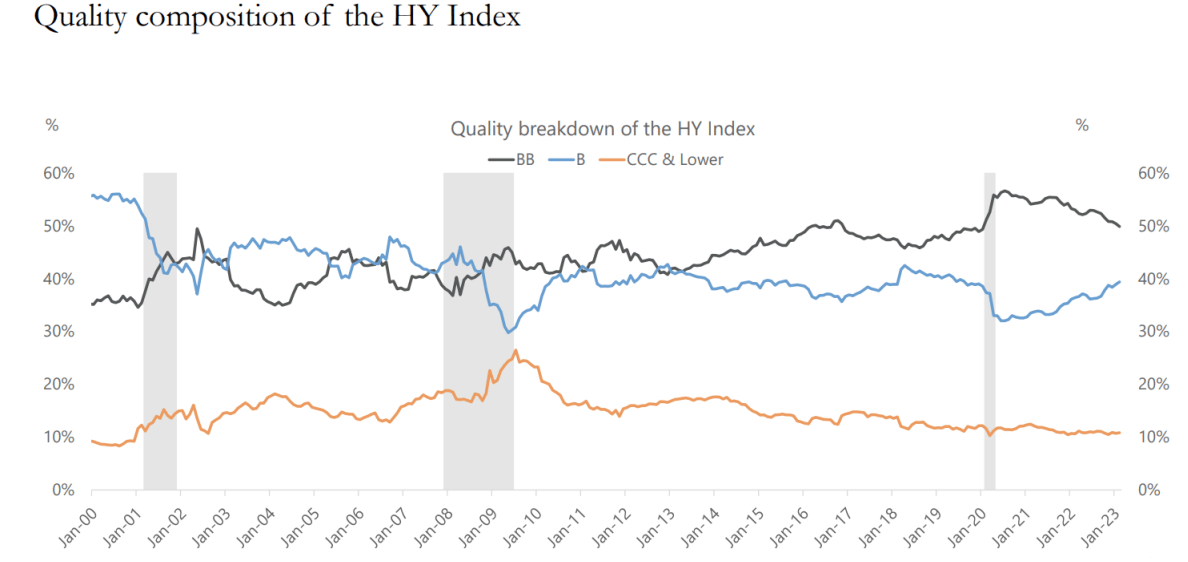
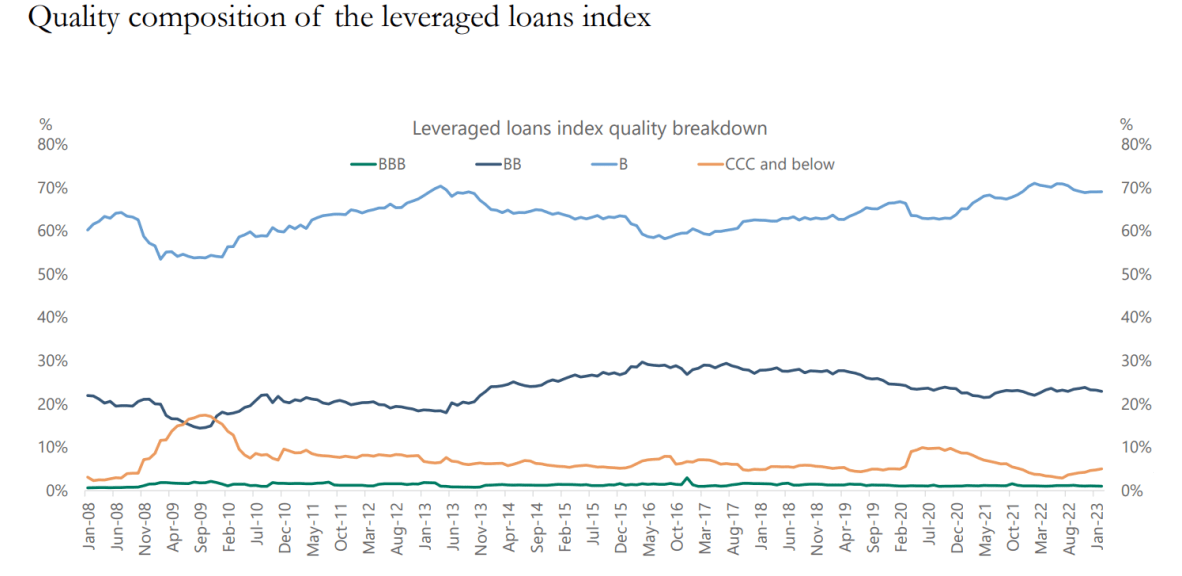
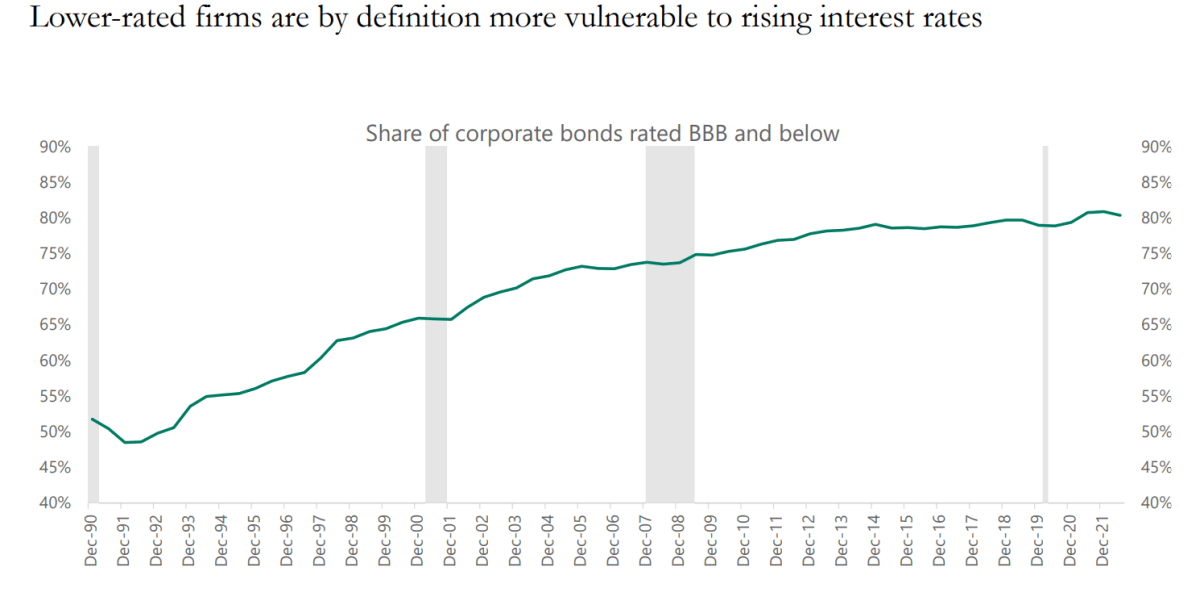
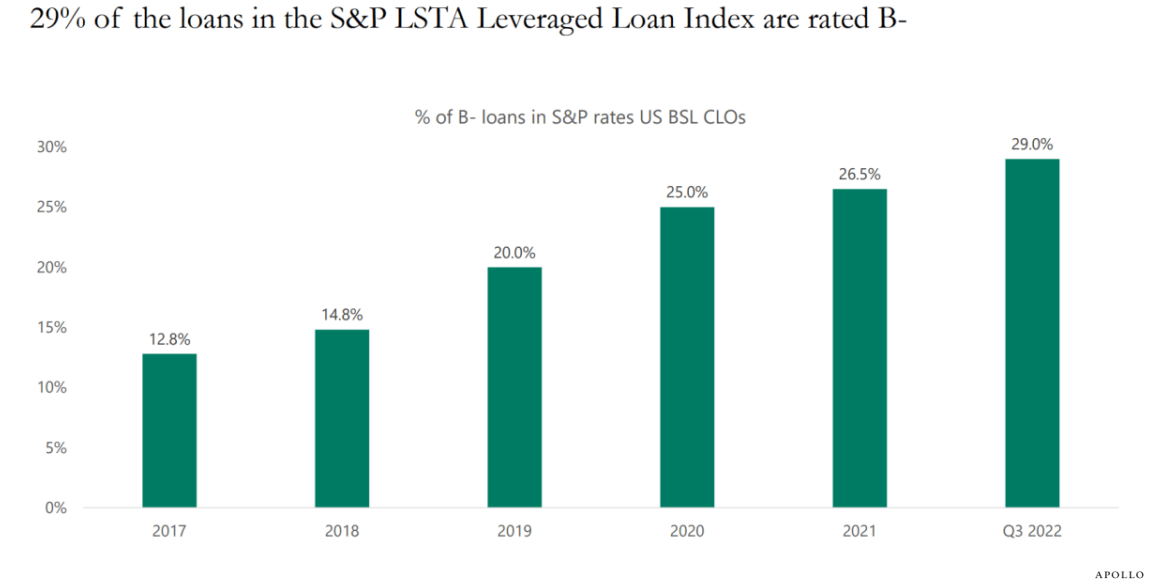
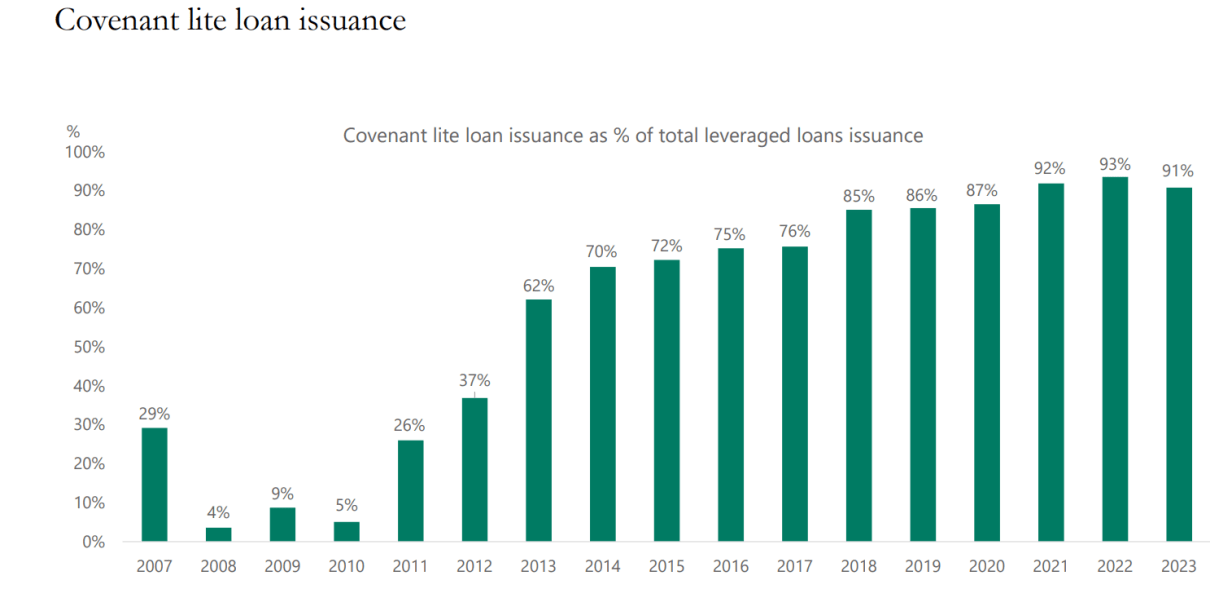
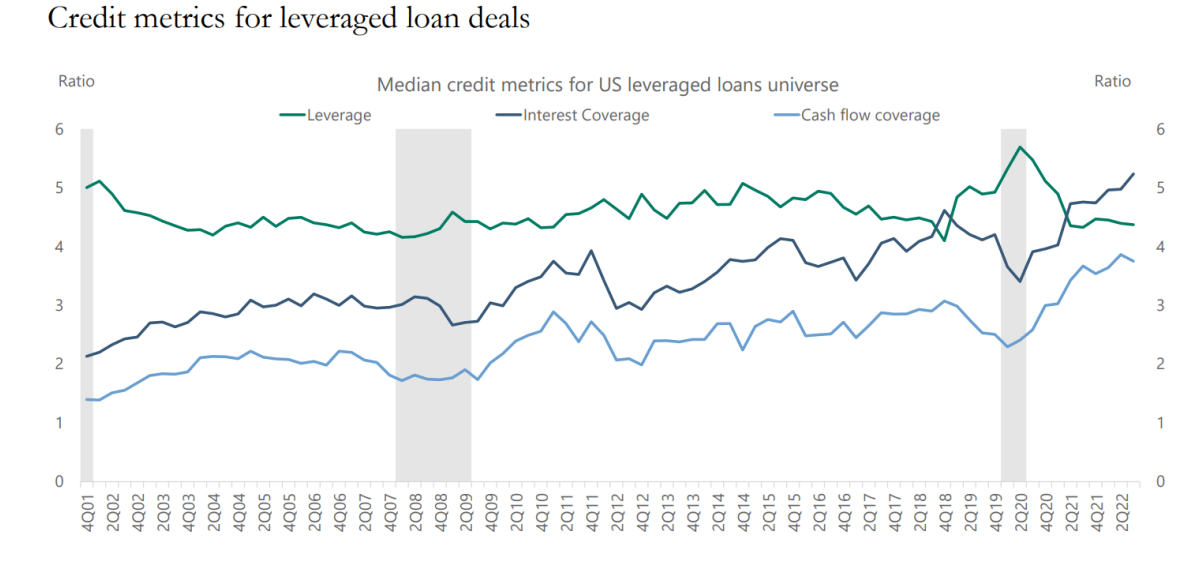
Ratings and issuances: We can observe that the highest (AAA and AA) rated corporate bonds are structurally decreasing. This is either due to stricter credit ratings or deteriorating debtor conditions. Consequently, the share of BBB or below rated corporate bonds has been on the rise since the 1990s, and now accounts for 80 % + of the outstanding universe. If credit rating standards has not gotten stricter in the same proportion, than the quality of the corporate bond universe is declining and the space has gotten more vulnerable. Similarly, in the leverage loan space the share of loans rated B- has been on the rise for a couple of years, now reaching 29% (highest at least since 2017). Two contradictory data point for leveraged loans are that the share of covenant lite issuances has risen dramatically in the past 15 years, now standing above 90%. Covenants are supposed to act a backstop protecting the lender, so leverage loan issuances has less and less backstops. On the other hand, cash flow and interest coverage has been on the rise since GFC while leverage went down somewhat. This is especially true since the pandemic, probably as a result of stimulus payments and other bankruptcy protections. A recent study from the San Francisco Fed states that the effect of stimulus payments will be ceased by the end of 2023, therefore we must keep an eye of how the interest coverage and cash flow coverage will change 2024. Note that both metrics started to decline materially in 2018Q4 until the government and central bank hasn't intervene, while leverage hit an all-time high during Covid. This might be indicating that due to the federal interventions the leverage loan space appears to be in a better shape than it's true condition without the effects of federal stimulus. If this is the case, than interest and cash flow coverage would probably start a sharp decline in 2024, while more than 90% of the issuances are covenant lite. This is consistent with the defaults ticking up and accelerating. As far as issuances, both corporate bonds and leverage loan issuances fallen off the cliff in 2022 alongside deal making in general, however the economy needs credit growth to grow, therefore debt issuances has to reaccelerate over time but those would happen at a much higher rates than before. Halted issuance is another reason why the interest rate environment had a very limited effect on corporate borrowers. When high yield bonds start to mature in great quantities, issuances has to tick up as there will great demand for refinancing during 2023-2027.
AAA and AA RATINGS SHARE (APOLLO) QUALITY COMPOSITION OF HY INDEX (APOLLO) LEVERAGED LOAN INDEX COMPOSITION (APOLLO) SHARE OF BBB CORPORATE BONDS (APOLLO) LEVERAGE LOAN INDEX COMPOSITION (APOLLO) COVENANT LITE LOAN ISSUANCE (APOLLO) CREDIT QUALITY LEVERAGE LOANS (APOLLO)
Ownership structure:
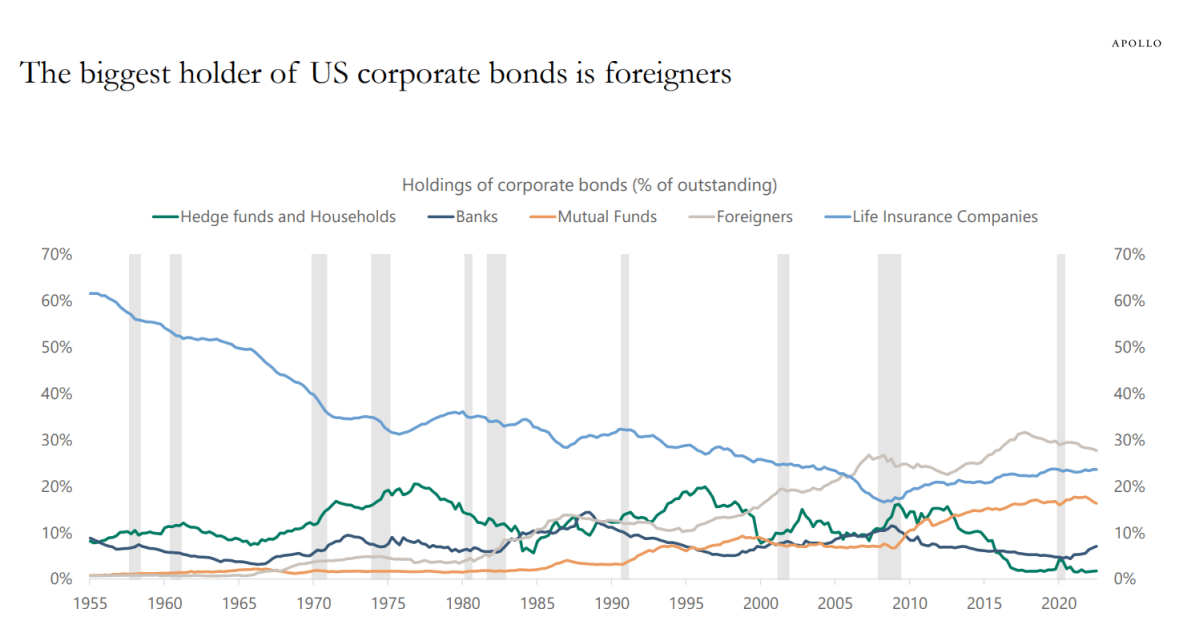
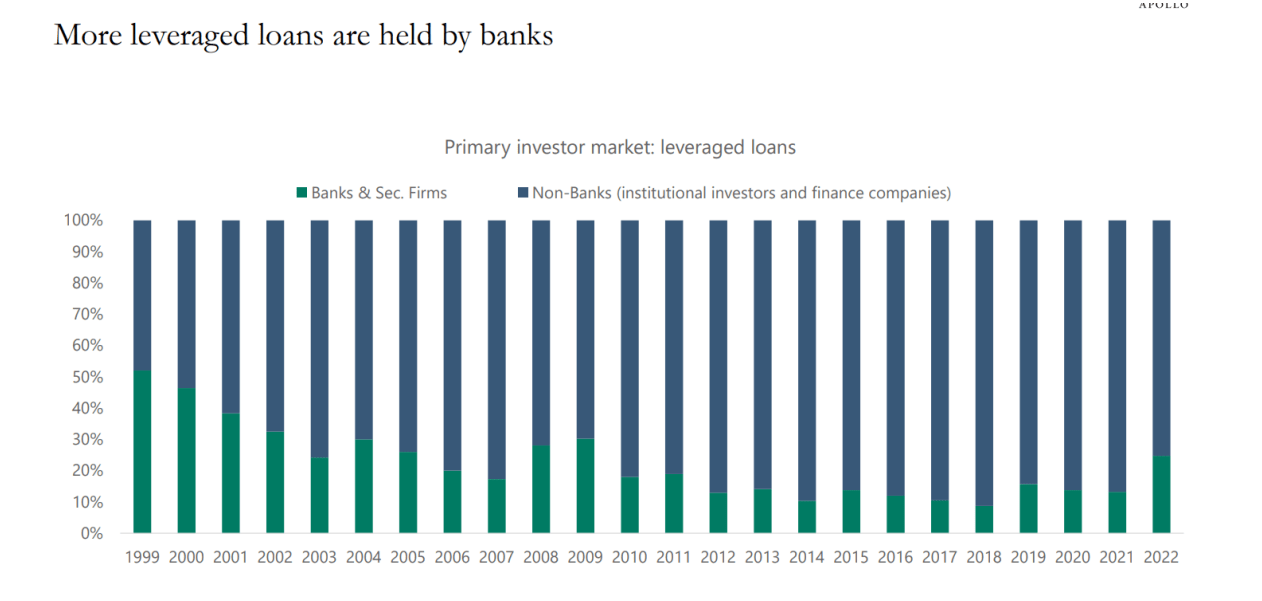
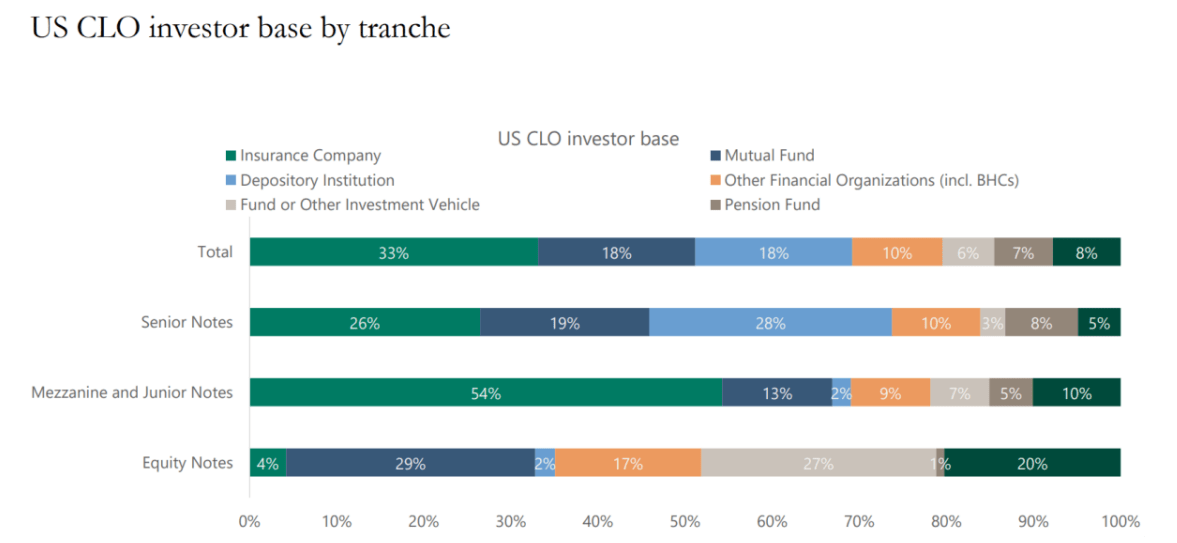
We can observe that the corporate bond space ownership structure has been reorganized since the GFC. Largest stakeholders now are foreigners, while life insurance companies and mutual funds have the most domestic share. Their ownership has been on the rise since GFC while hedge funds/ households are declining. Note that banks are stagnating around 5-10% since 1970, however their ownership has been on the rise since the pandemic. In terms of leverage loans, banks decreased their share of ownership since the GFC, however in 2022 there was a sharp jump to around 20%, the highest level since 2009. The largest holders of leverage loans are insurance companies, banks and mutual funds. Banks mostly own the senior tranches compared to insurance companies who holds over 50% of the more junior tranches, meanwhile mutual funds are major investors in the equity tranches. Overall, banks has increased their exposure to both the corporate bond space and the leverage loan space since Covid, however mutual funds and insurance companies are much more exposed to the space both in terms of ownership share and the quality of leverage loan tranches. Should something go wrong in the CLO- Leverage loan / High yield space, insurance companies and mutual funds would be the most exposed. Note that banks had problems with unrealized losses on debt securities and deposit outflows, which makes them especially vulnerable to credit losses in the corporate bond/loan space, given that they have increased their exposure recently.
US CORPORATE BOND HOLDERS (APOLLO) PRIMARY INVESTOR BY MARKET - LEVERAGED LOANS (APOLLO) US CLO INVESTOR BASE (APOLLO)
Commercial real estate:
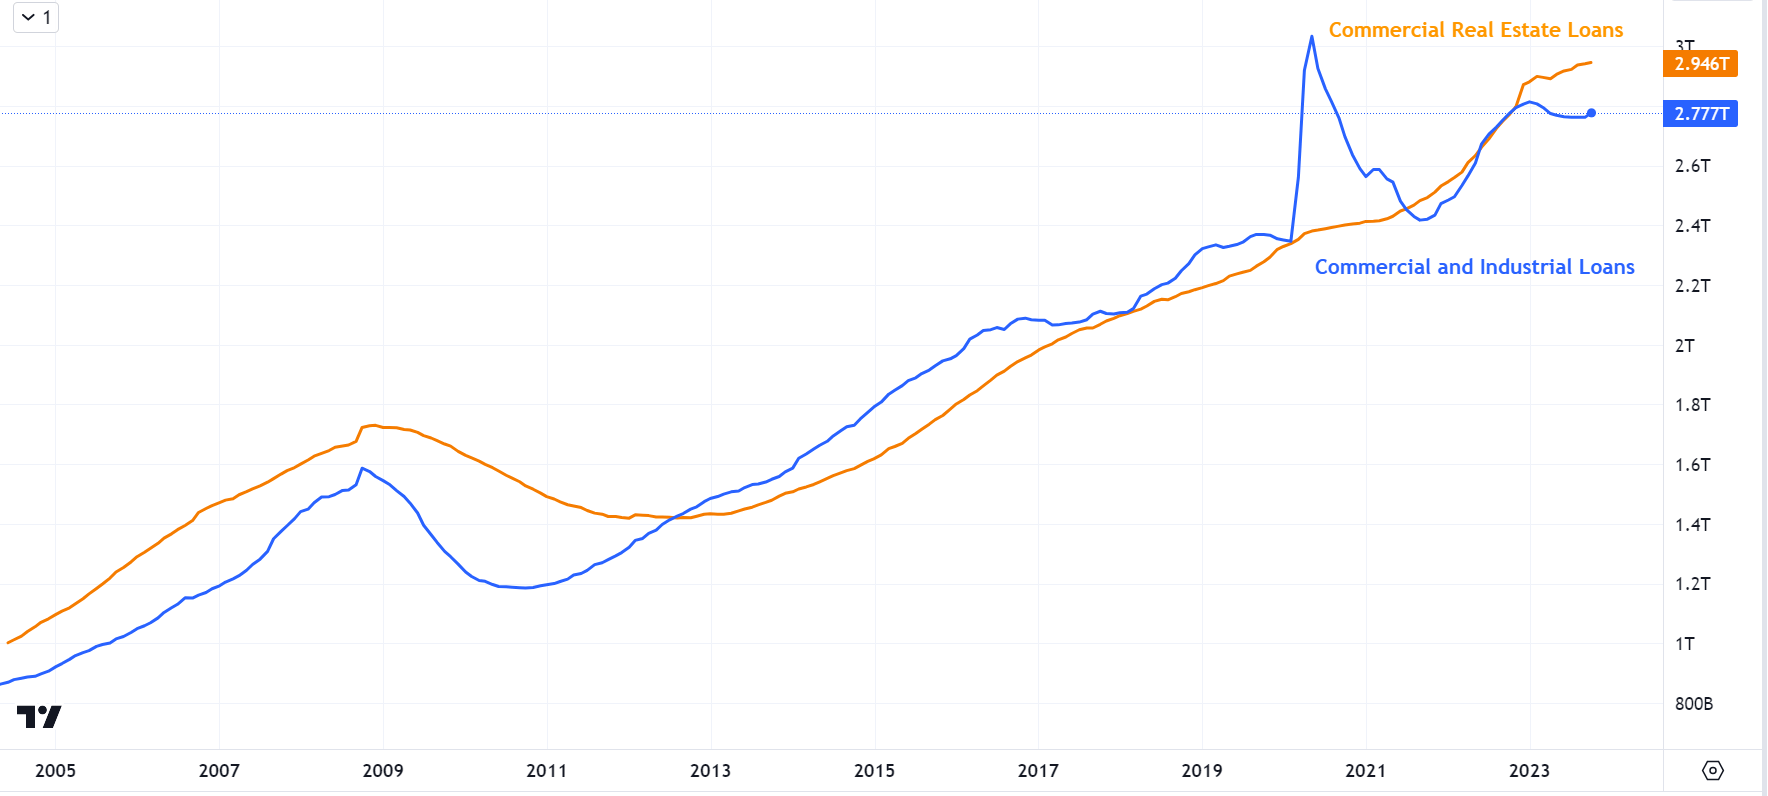
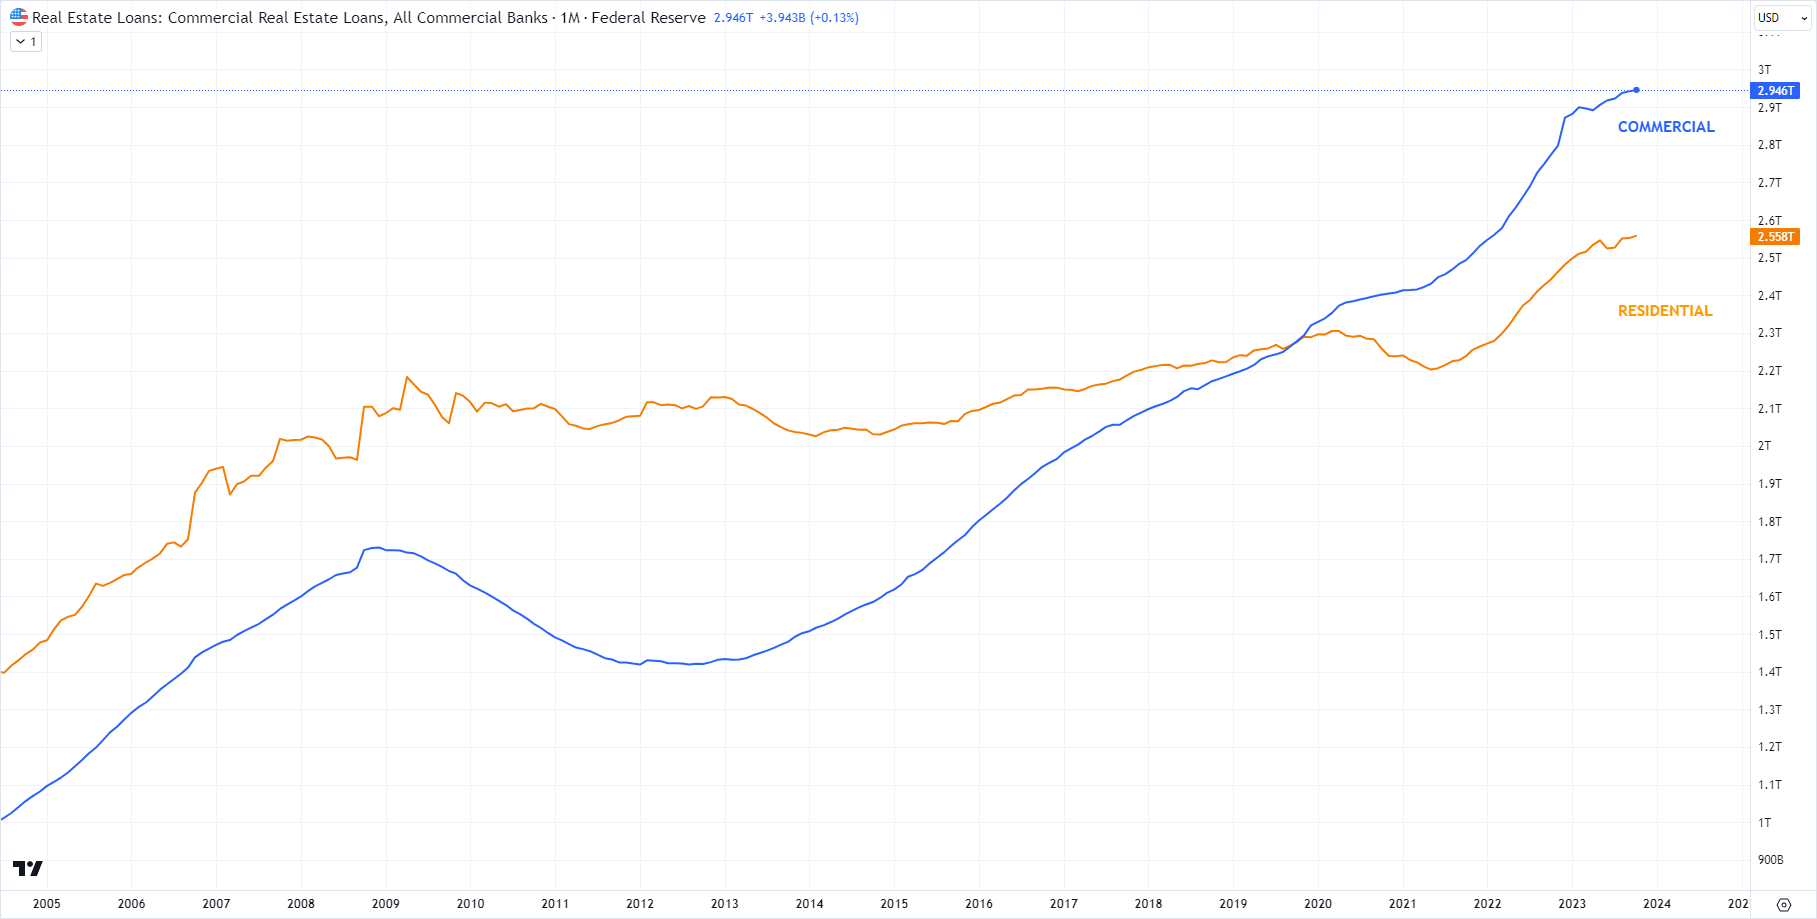
The Commercial Real Estate ((CRE)) loan market size in the U.S. is $5,6 trillion, with $2.95 trillion worth CRE loan is sitting in commercial banks balance sheet. In addition to this, CRE loans are the biggest asset class on regional banks balance sheet. Office is a subcategory of CRE and office debt represents 20- 30% of the book of small & regional banks. CRE accounts for 40% of smaller banks lending compared to 13% of larger banks. Other than banks, direct lenders ("shadow lenders") are involved of financing CRE (private credit funds, etc., significantly less regulatory oversight). Typical loan to value is between 65%-80% which equals 20-35% equity. Some claim that with refinancing equity is constantly being pulled out from the structure. If prices fall, equity suffers the first loss. Office equity experienced a large decrease in the USA (0-15% remains) and CRE equity is already underwater in EU (-3% - 12% remains). In case of office debt, significant amount of the equity is underwater, as even high quality office prices are down 25% in the U.S. Looking forward $2.2 Trillion of CRE loans are maturing from 2023-2027, from which $250 billion maturing in 2023. The refinancing dynamics will be key to watch to assess how much small and regional banks are willing to originate new CRE loans, or will other agents have to step in like private credit funds or larger banks to replace SRB lending.
RESIDENTIAL & COMMERCIAL REAL ESTATE LOANS -ALL COMMERCIAL BANKS (TRADINGVIEW)
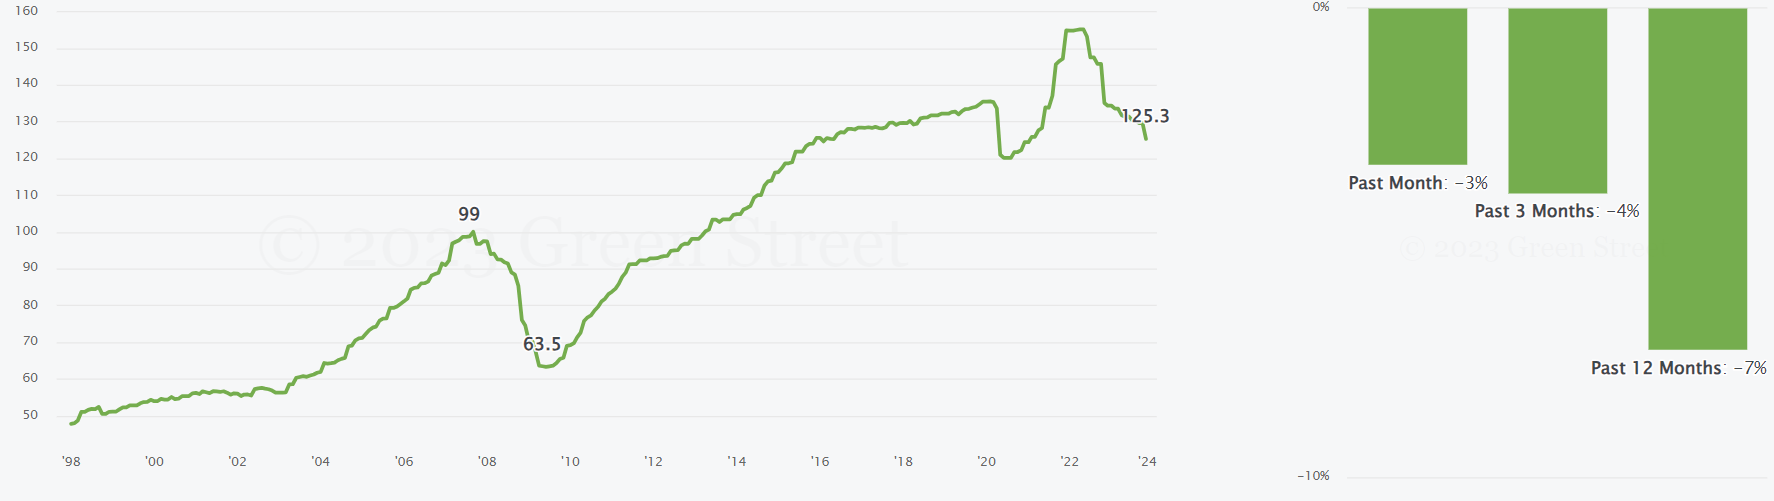
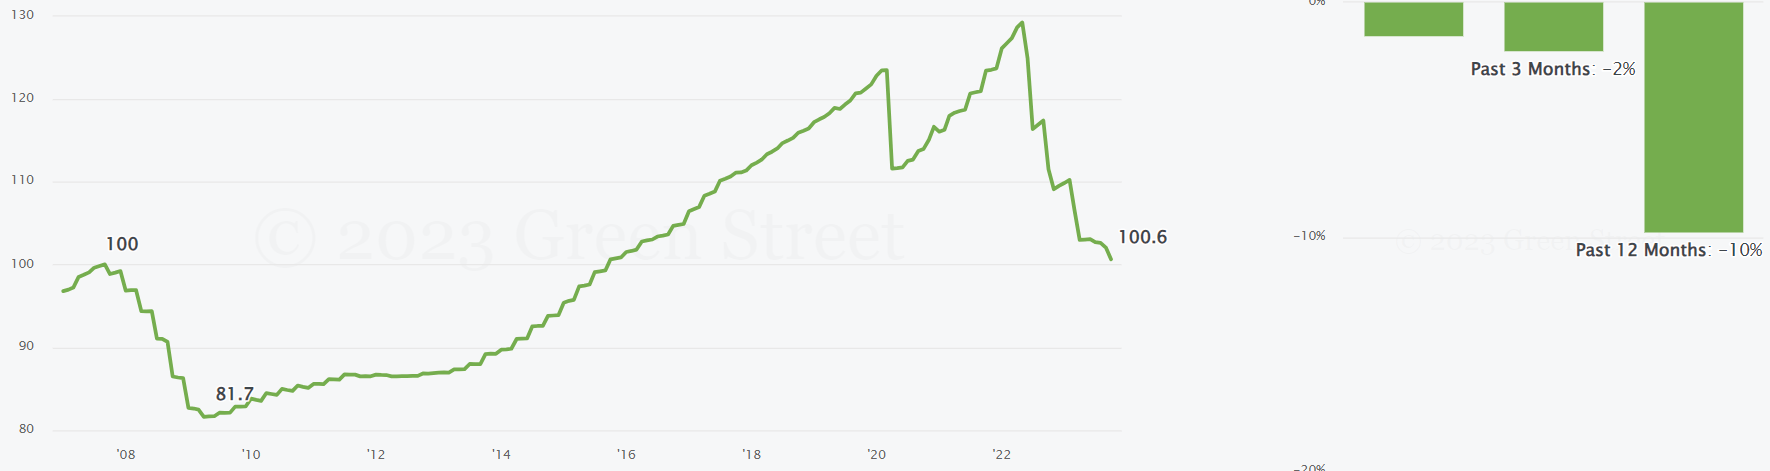
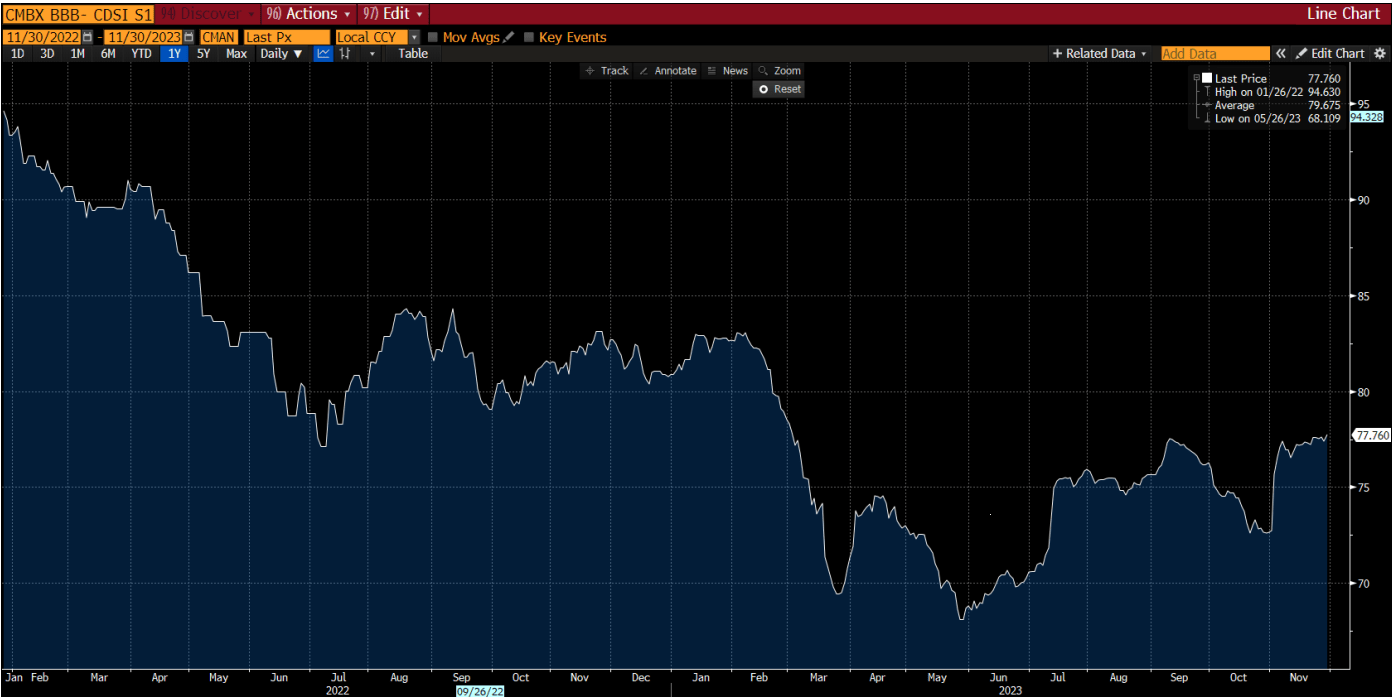
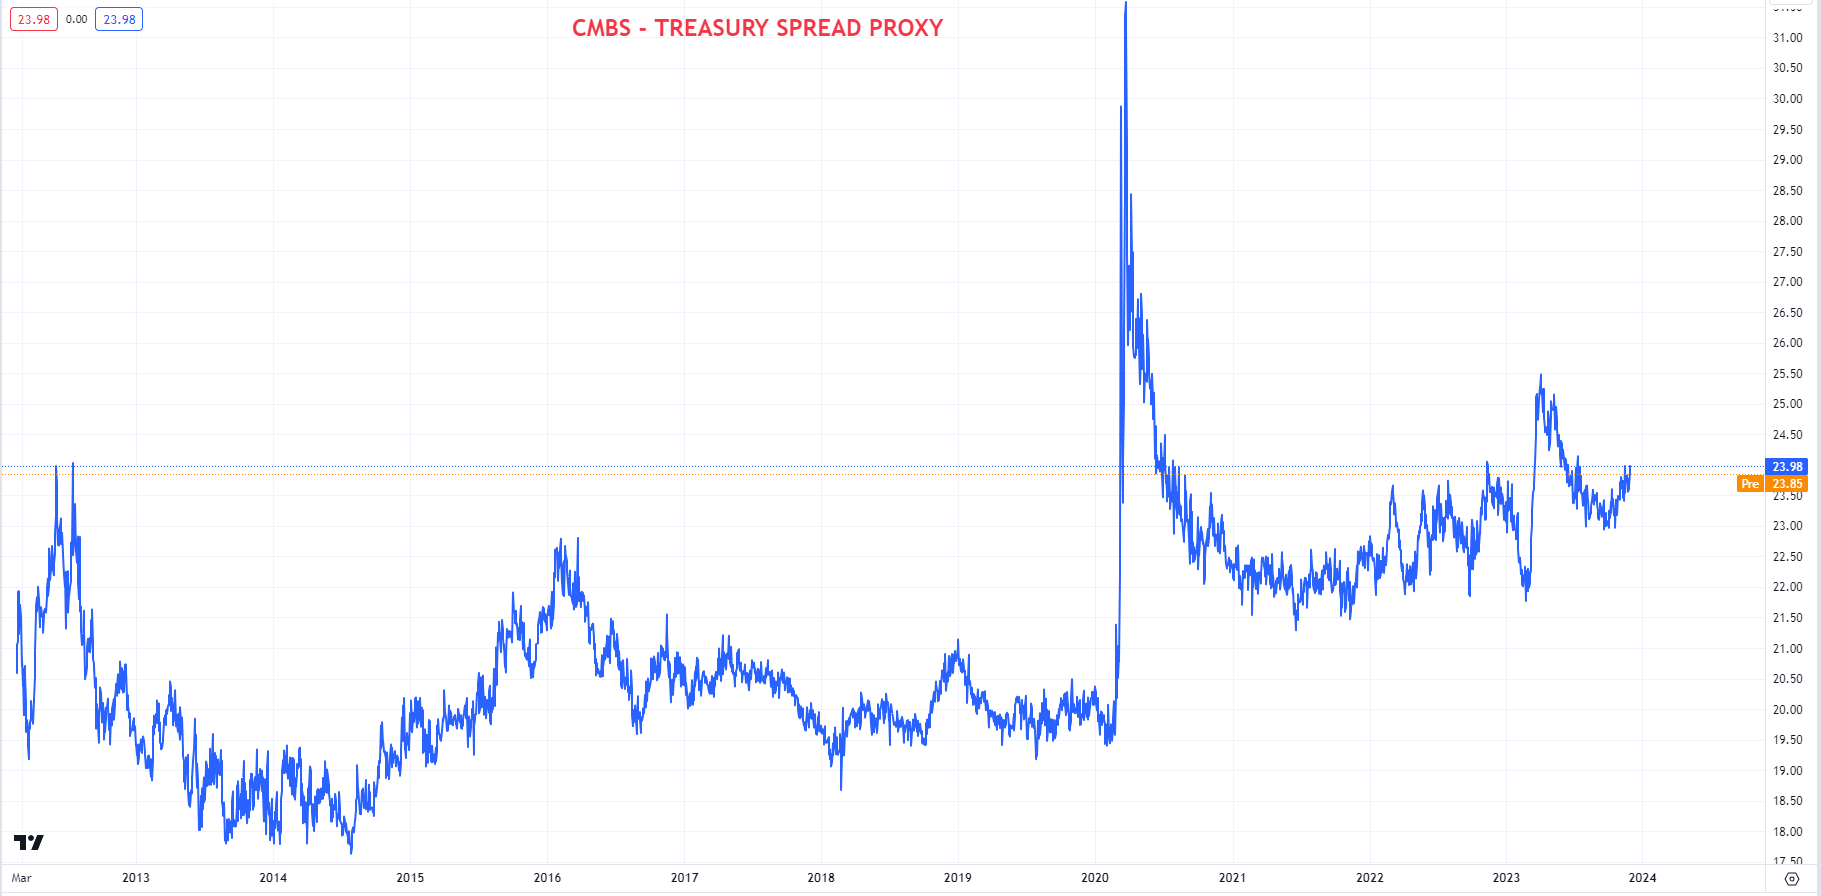
The way the office business model works, the landlord rents out the building ,and from the proceedings the due of the bank loan is being paid. When the loan matures, the landlord refinance it. With vacancy rates around 20-30%, and rental prices down 10%, the landlord's income should be down around 35% (estimation) when the current leases expire and new lease contracts will be signed. When the landlord has to refinance, the expense side is up several hundreds of percent. In many cases, the business model no longer works, and the landlord gives back the building to the lender. Larger real estate companies (e.g.: Brookfield) typically structure the buildings as an individual legal entity, therefore a default would not affect the parent company. Typically, lenders would be less willing to originate if the underlying secondary market is less liquid. Therefore it is important to observe that the price of insuring against a credit default has been structurally rising. This is consistent for the credit spread proxy of CMBS compared to treasuries, which has been structurally rising since 2013 and exploded higher after the 2023 march banking crisis, although it has moderated somewhat since to still elevated levels. It appears that the secondary debt market believes there are structural problems and high default risk in the space. As a consequence financial institutions will be probably much more risk averse to any dealings in the CRE & CMBS space. Should SRE banks pull back from lending & refinancing and other agents be less willing to step in, defaults can rise substantially. If prices would be to crash significantly from current levels, it would potentially directly hurt the CRE liabilities as there isn't much equity remaining to backstop it.
US CRE PRICE INDEX (GREENSTREET) EU CRE PRICE INDEX (GREENSTREET) CMBX - CMBS SYNTETHIC CDS (BLOOMBERG) CMBS - TREASURY SPREAD PROXY (TRADINGVIEW)
Delinquencies:
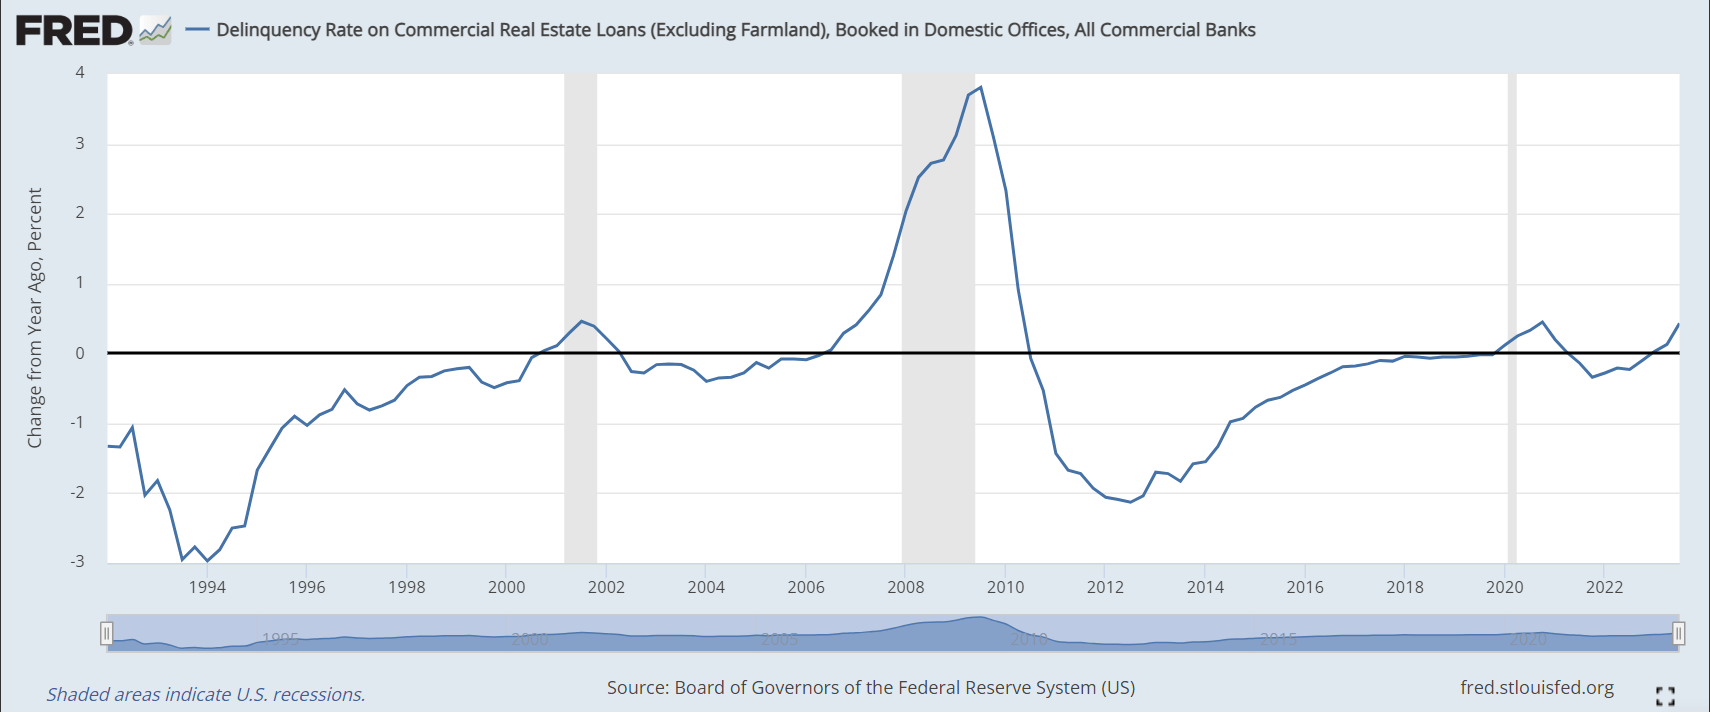
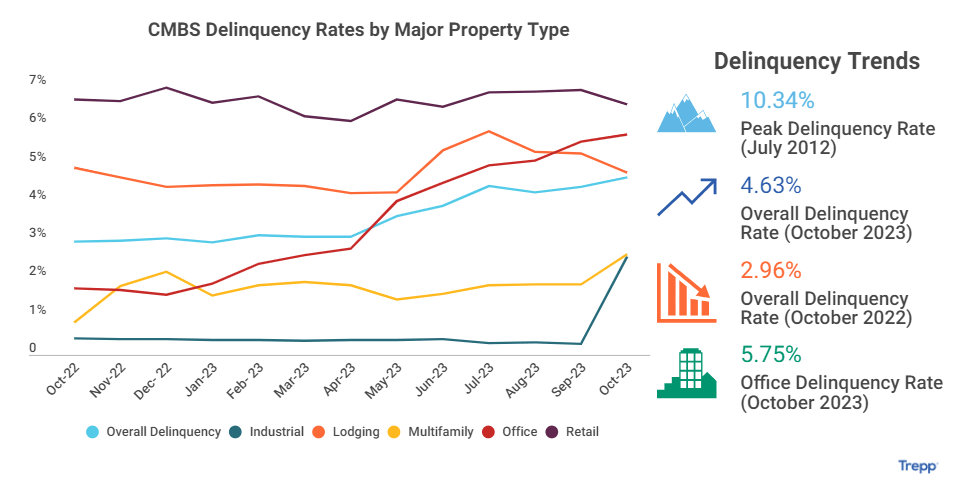
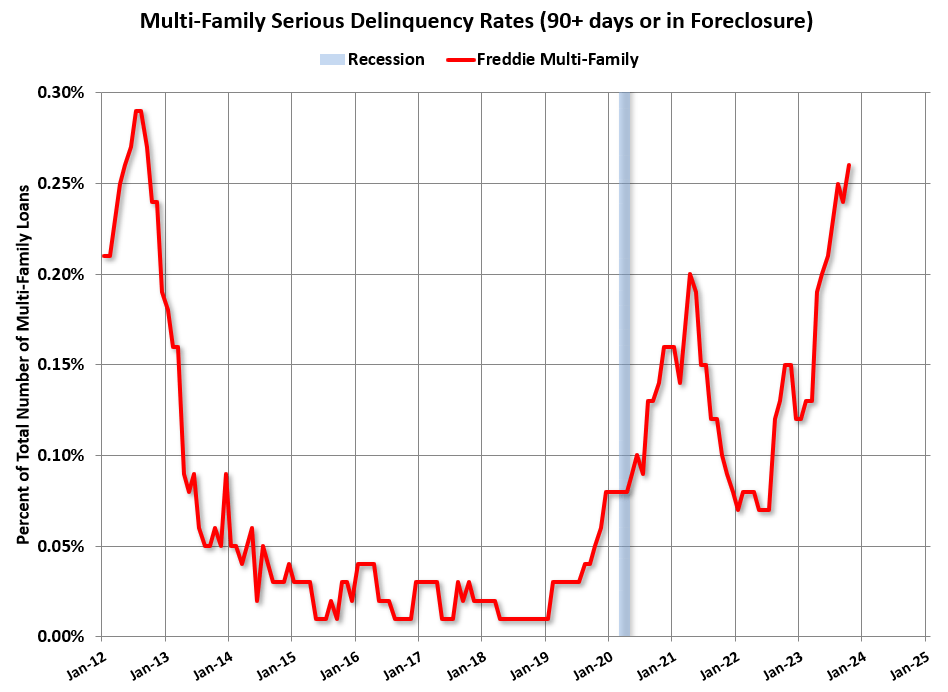
Delinquency rates are still at relatively low levels for commercial real estate loans at US commercial banks, however there is clearly and acceleration in delinquency rates. As mass refinancing continue and interest rates remain higher, it will be key to watch the borrower performance going forward. However CMBS delinquency rate was 4.63% for June of 2023, up sharply from the 3% level of 2022. The most problematic sector is office, where delinquency rates are currently up to 5.75% from 1.5% of end of 2022. Delinquency rates for lodging is also up sharply from May 2022. Most recently, industrial loan delinquencies shoot up to 2% from 0.5% since September 2023. The serious delinquency rate (90+ days) at Freddie Mac Multi-Family units reached 0.26%, the highest level since 2012 (peak CRE Delinquencies). Overall, the delinquency outlook for commercial real estate and CMBS is negative, considering the mass refinancing of 2023-2027 period and the already concerning trends.
CRE LOAN DELIQUENCY RATE (FRED)
CMBS DELINQUENCY RATE (TREPP) MULTI FAMILY 90+ DELIQUENCY RATE (BLOOMBERG)
Borrower: Consumer and Household
Debt structure
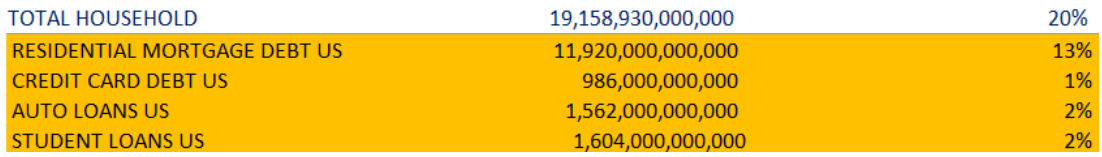
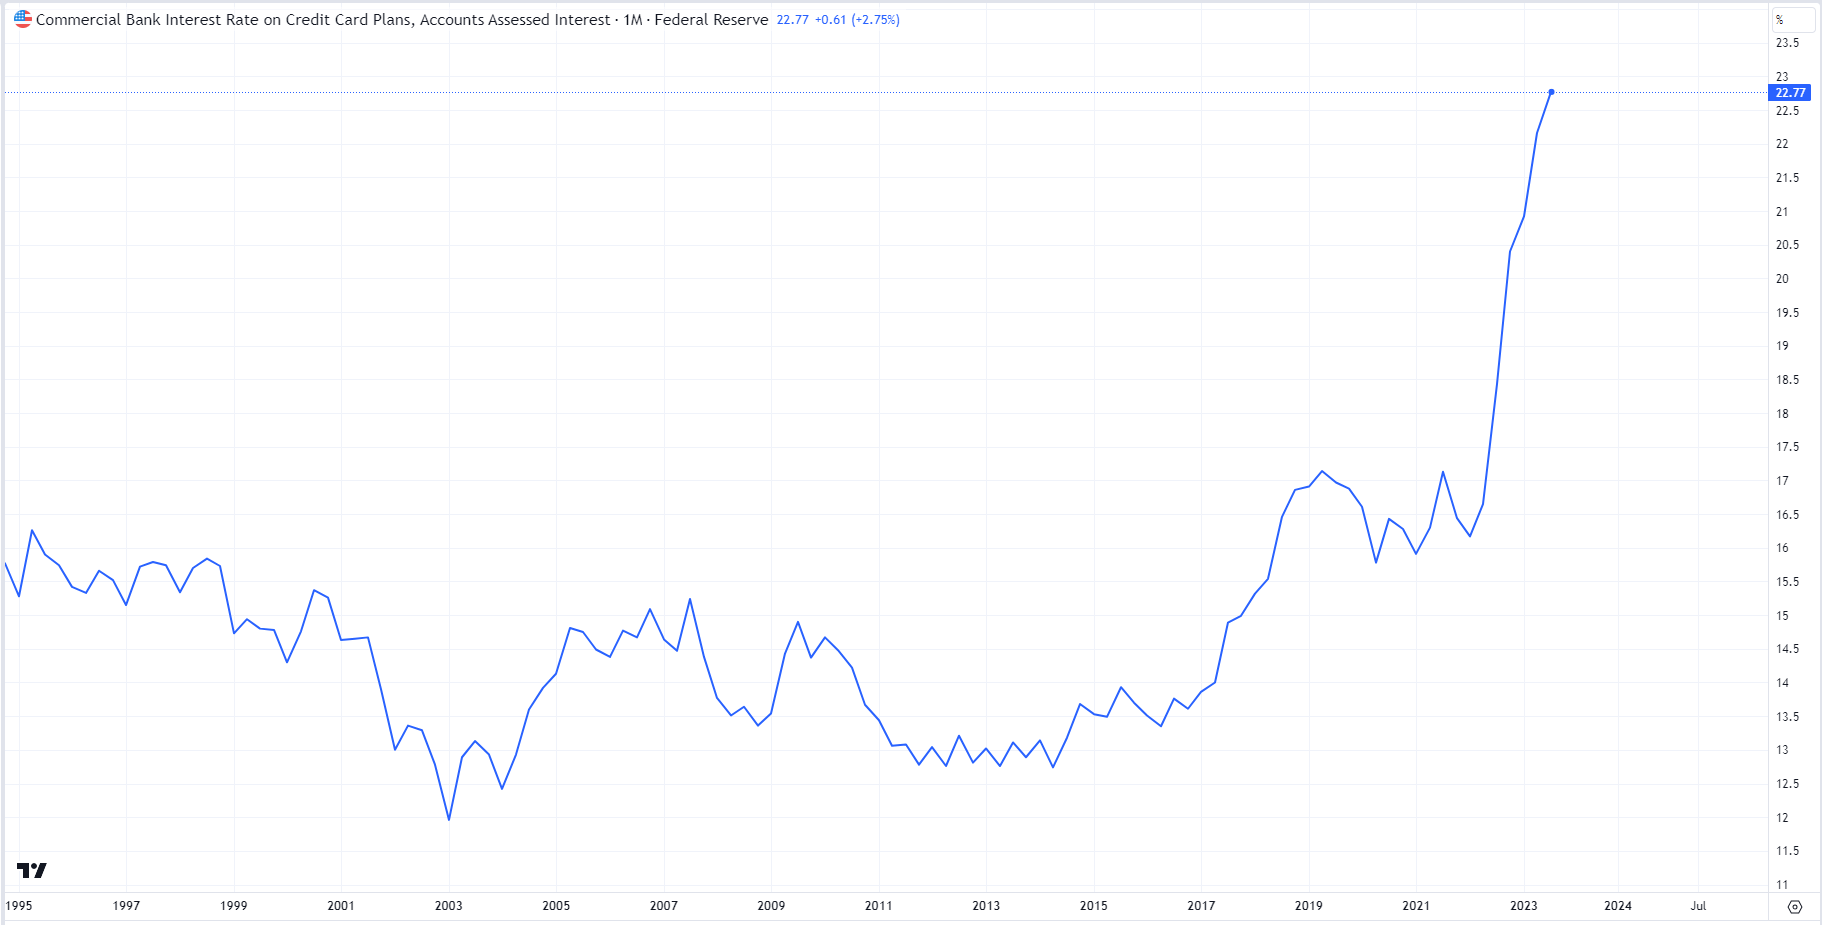
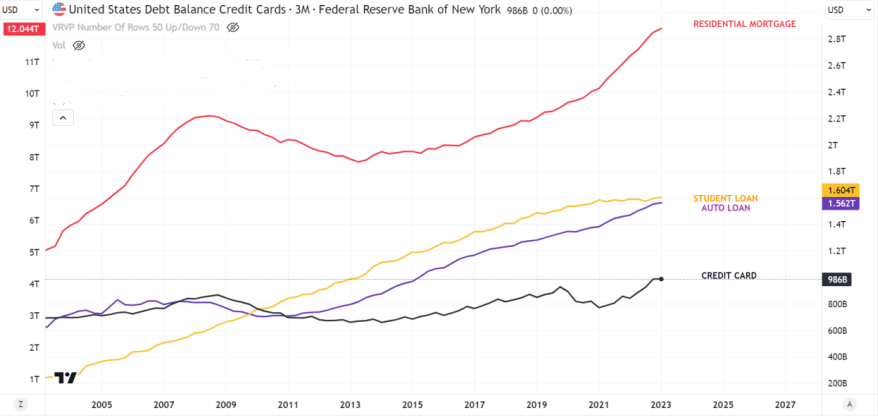
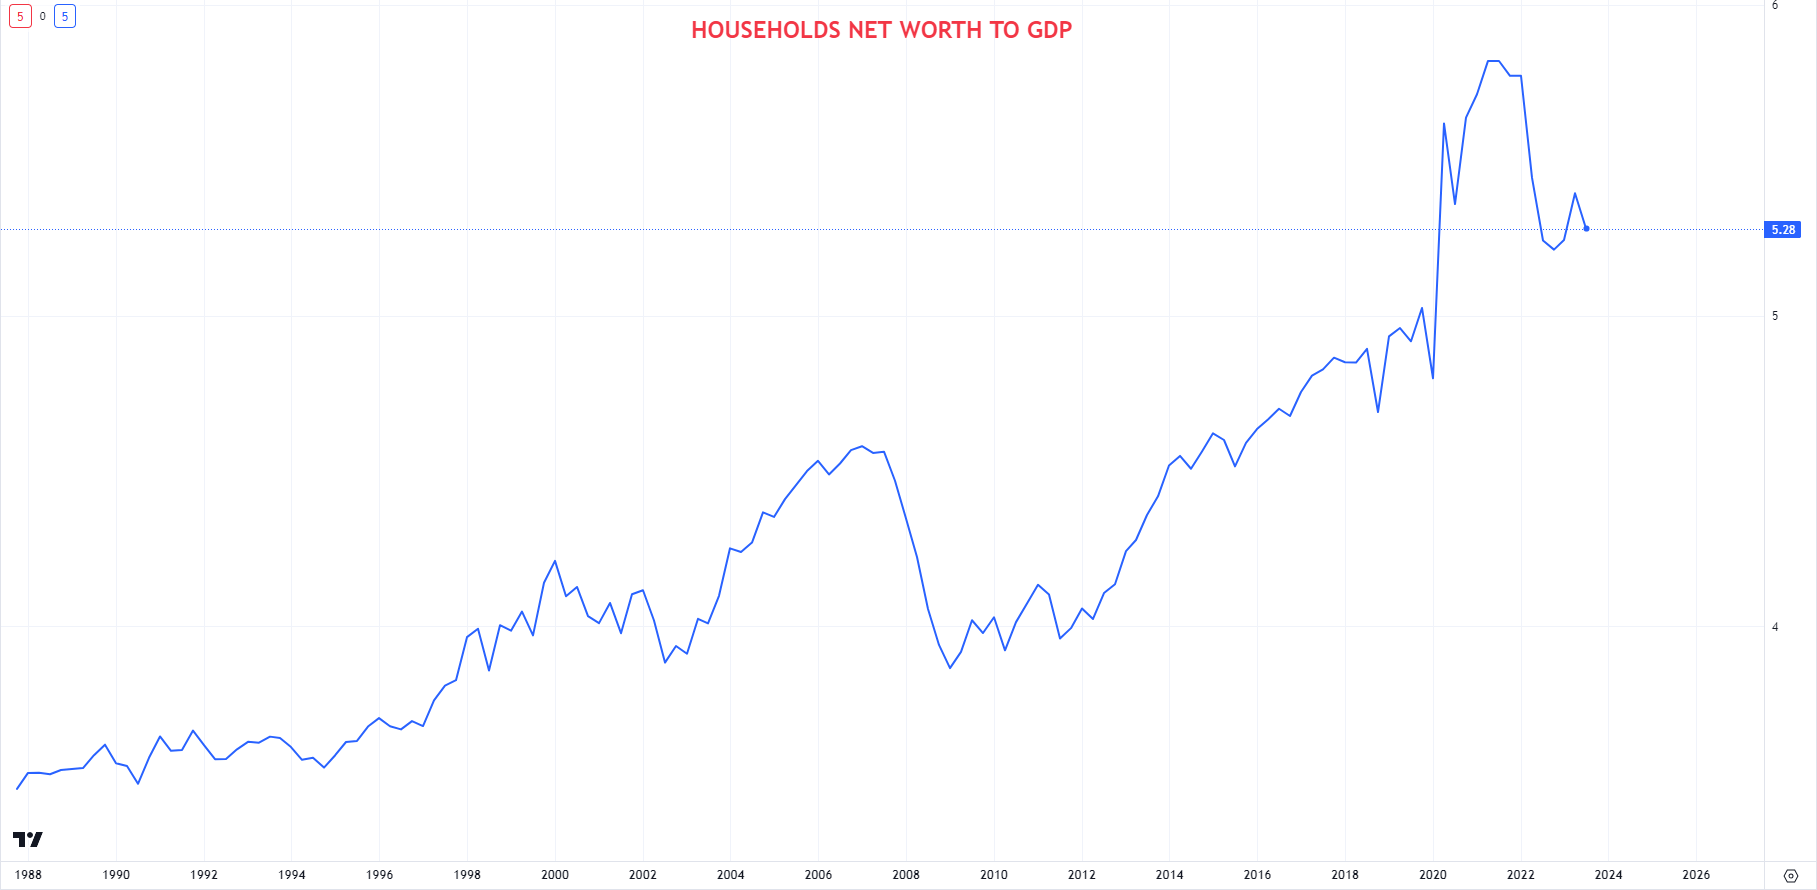
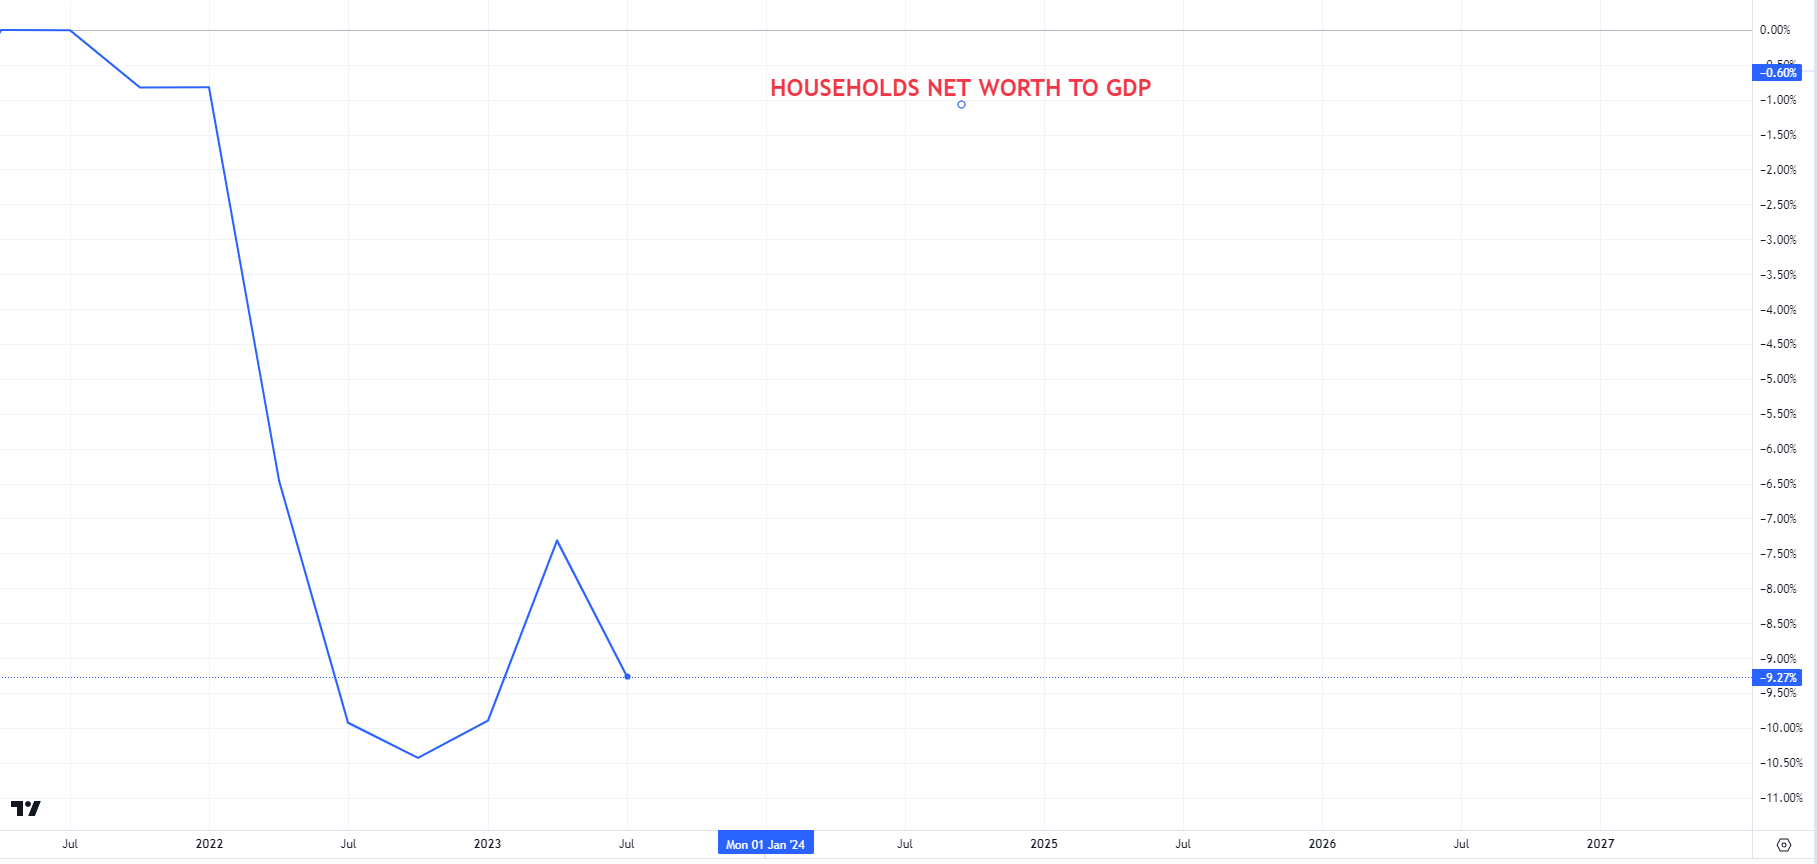
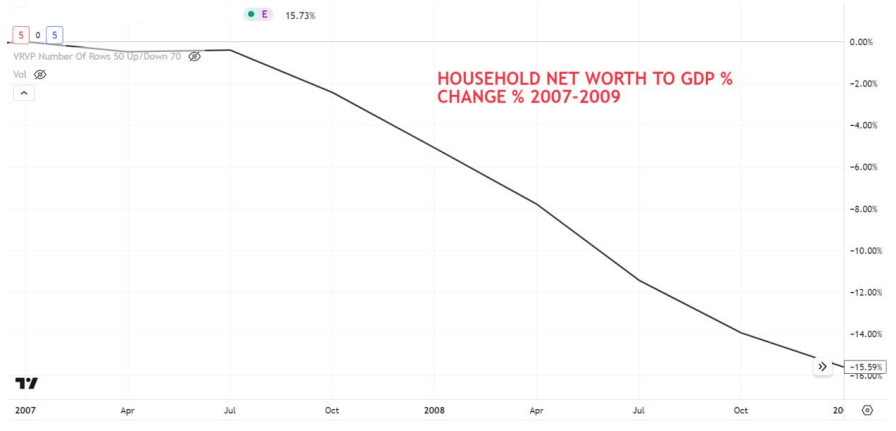
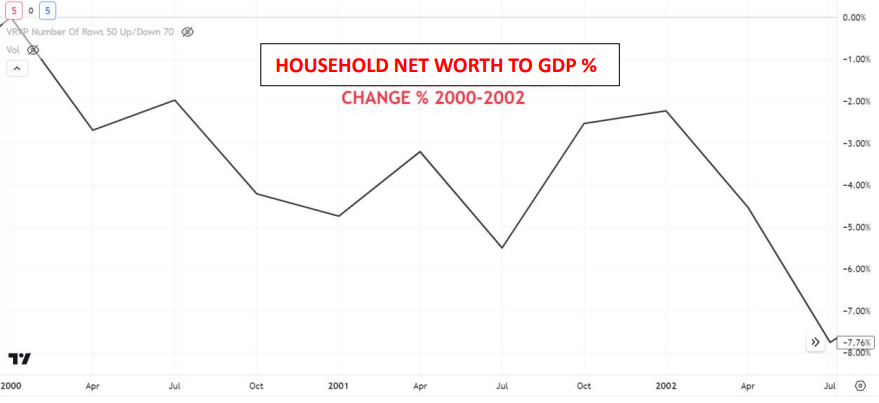
Household debt represents 20% of the total on balance sheet dollar liabilities, accounting for 19 Trillion dollars. The major household debt types are residential mortgage, auto loans, student loans and credit card debt, with residential mortgage only by itself is almost $12 trillion, or 13% of total on balance sheet dollar liabilities. Credit card debt is floating rate and it is skyrocketed to 22.16%, auto loan debt is fixed rate and is projected to yield 6.6% by the end of this year, reaching near peak yield of 7.73% by the end of 2024 due to the 2.5 years average lifecycle. Most residential mortgages are 30 year fixed term since the GFC, however has an average lifecycle of 5.5 years due to the refinancing. It is quite uncertain if the refinancing will continue in this speed or at all, as it depends mostly on the households projection of interest rate environment or individual deal characteristics. If the lifecycle remains 5.5 years, than the debt yield is projected to reach 3.97% by the end of this year, peaking by the end of 2026 at 6.5%.Student loan debt is special and it is not subject of this research, however by the 3rd quarter debtors will have to 44 start paying the obligations, as the relief program expires. That would probably put pressure on the consumers and households. Credit card debt and residential mortgage debt went through a 5 year deleveraging after 2008, however they have been on the sharp rise since 2013 together with the ever rising student loan and auto loan debt. Overall household leverage is rising ,currently at 48% of U.S. GDP, steadily up from 2010-40% levels, and it is currently higher than in 2007-2008. Household net worth to GDP is in a structural uptrend, as asset prices are growing faster than the economy, thanks to the economical behavior of mercantilist nations like China. It has recently fallen from the peak 5.8% of GDP level of 2021, to 5.3% as of today. The magnitude is the decline is outstanding as it is nearly 10%, comparable with the 2007-2009 period decline of -15.5% and larger than the 2000-2002 period decline of 7.8%.
LIABILITY BREAKDOWN (FRED) COMMERCIAL BANK CREDIT CARD RATE (TRADINGVIEW) DEBT TYPE BALANCE (TRADINGVIEW) HOUSEHOLD NET WORTH TO GDP (TRADINGVIEW) HOUSEHOLD NET WORTH TO GDP % 2021-2023 (TRADINGVIEW) HOUSEHOLD NET WORTH TO GDP % 2007-2009 (TRADINGVIEW) HOUSEHOLD NET WORTH TO GDP % 2000-2003 (TRADINGVIEW)
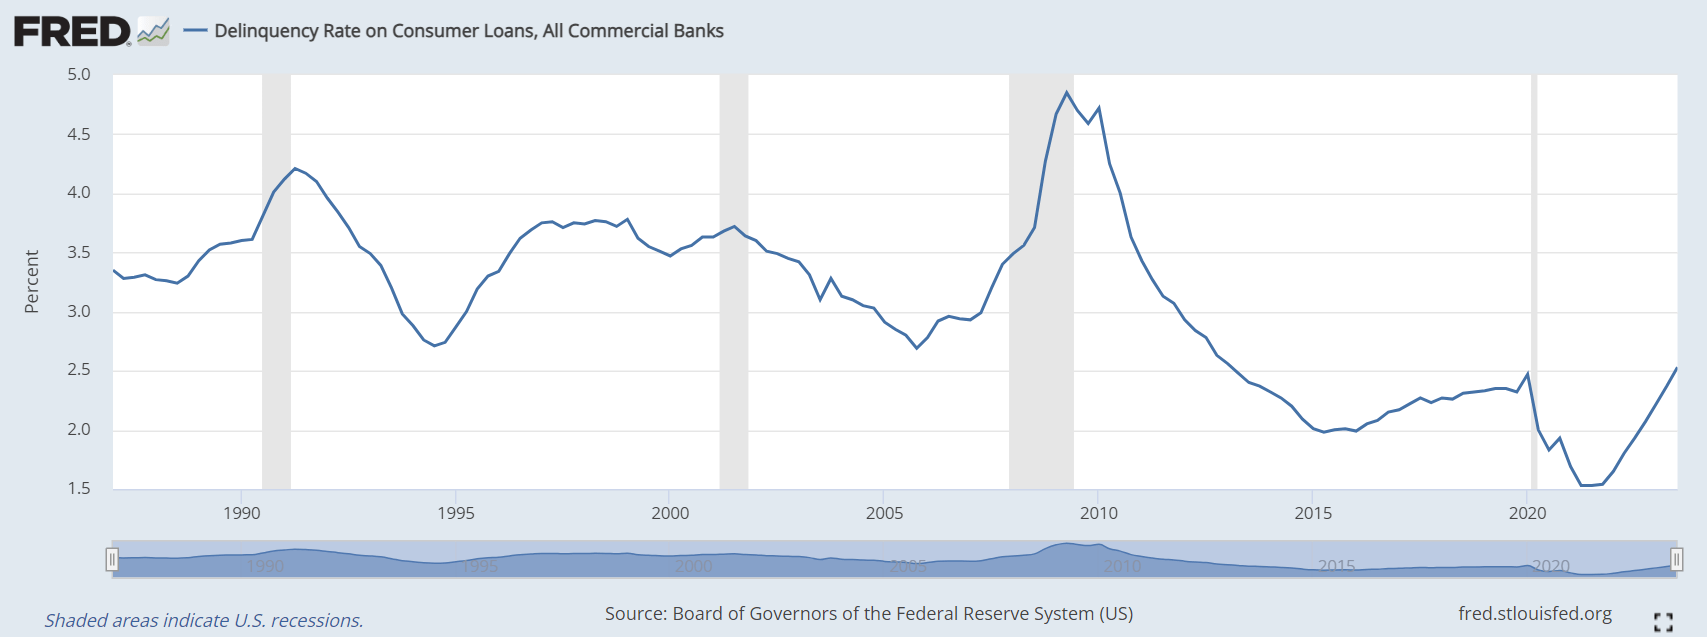
Delinquencies
Delinquencies on consumer loans has been on a sharp rise since record low levels after the pandemic due to government stimulus and relief programs. However, according to the San Francisco Fed, the effect of those programs will expire by the end of this year. This is consistent with the sharp rise from 2021 levels and indicating that delinquencies can rise further in 2024 without any government support. We can observe that consumer debt delinquencies were steadily increasing after the post GFC deleveraging. After the pandemic government support made delinquency rates collapse to a new all-time low. As the government support expires we are getting back to pre-Covid levels, where we already had troubling development in the financial system, around 2018- 2019. But the more important question is, where consumer delinquencies will be during the 2024-2027 period.
DELINQUENCY RATE FOR CONSUMER LOANS (FRED)
Auto Loans & ABS
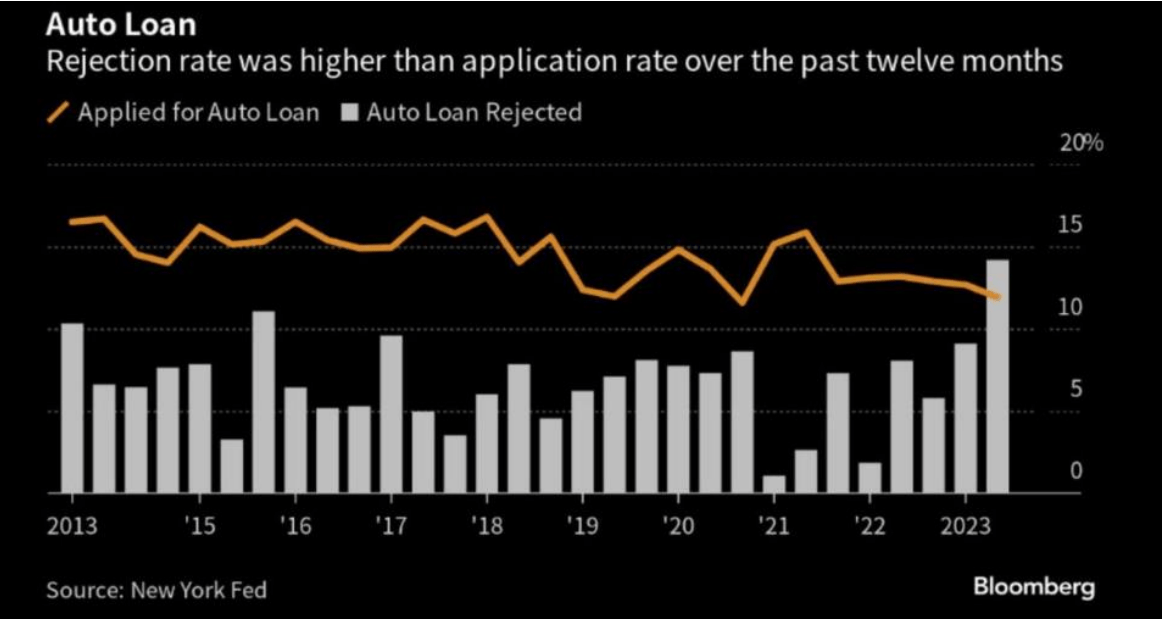
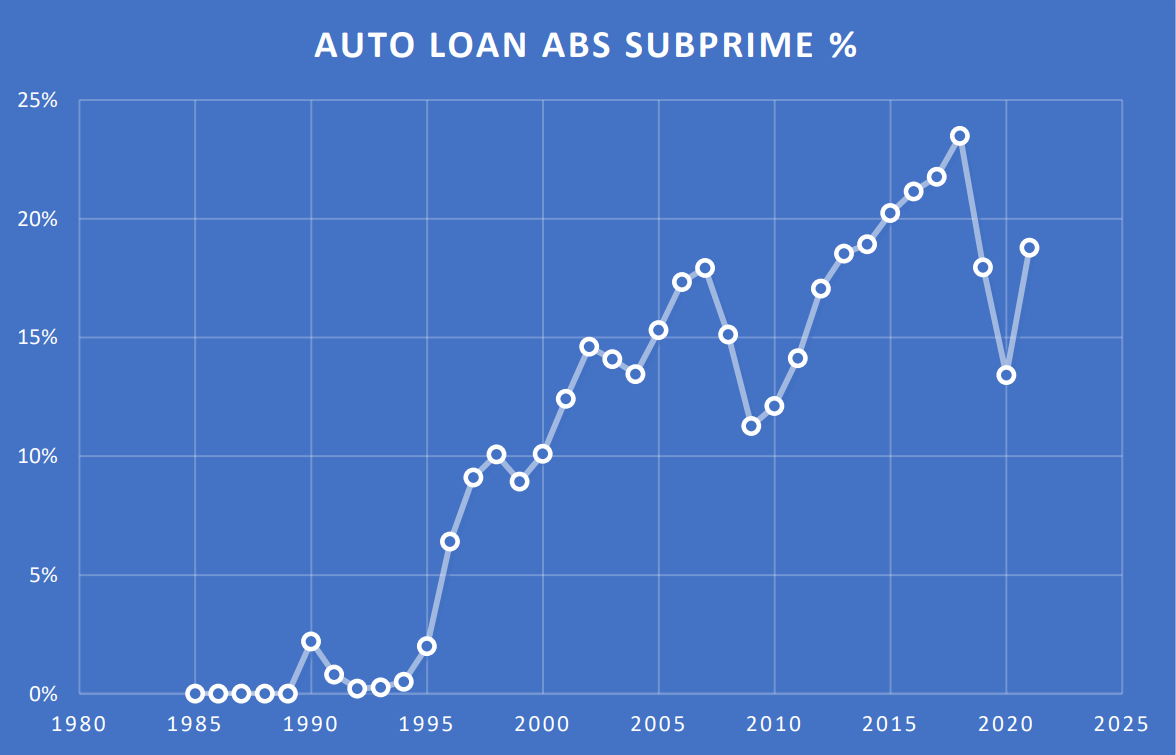
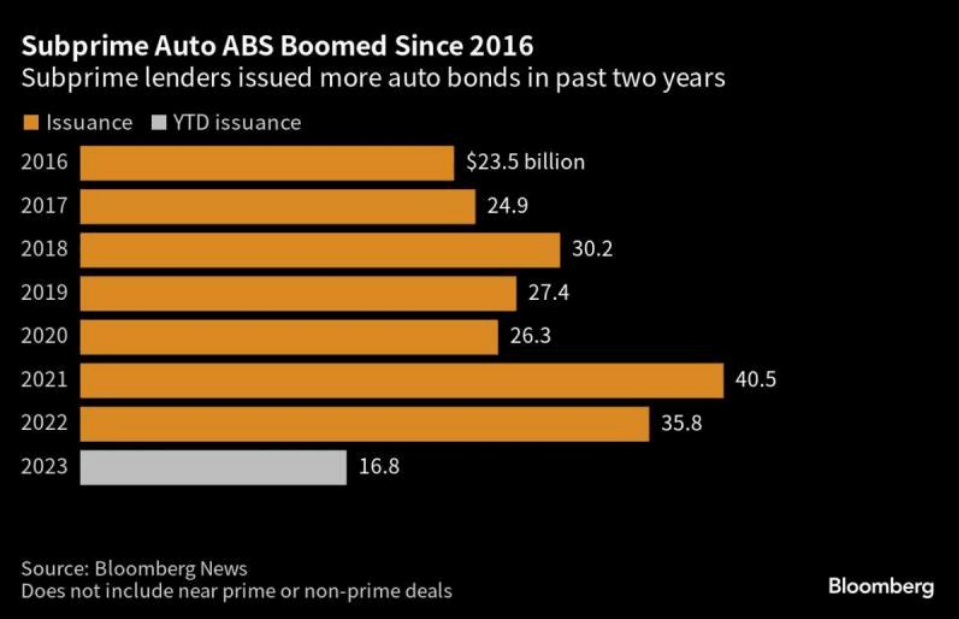
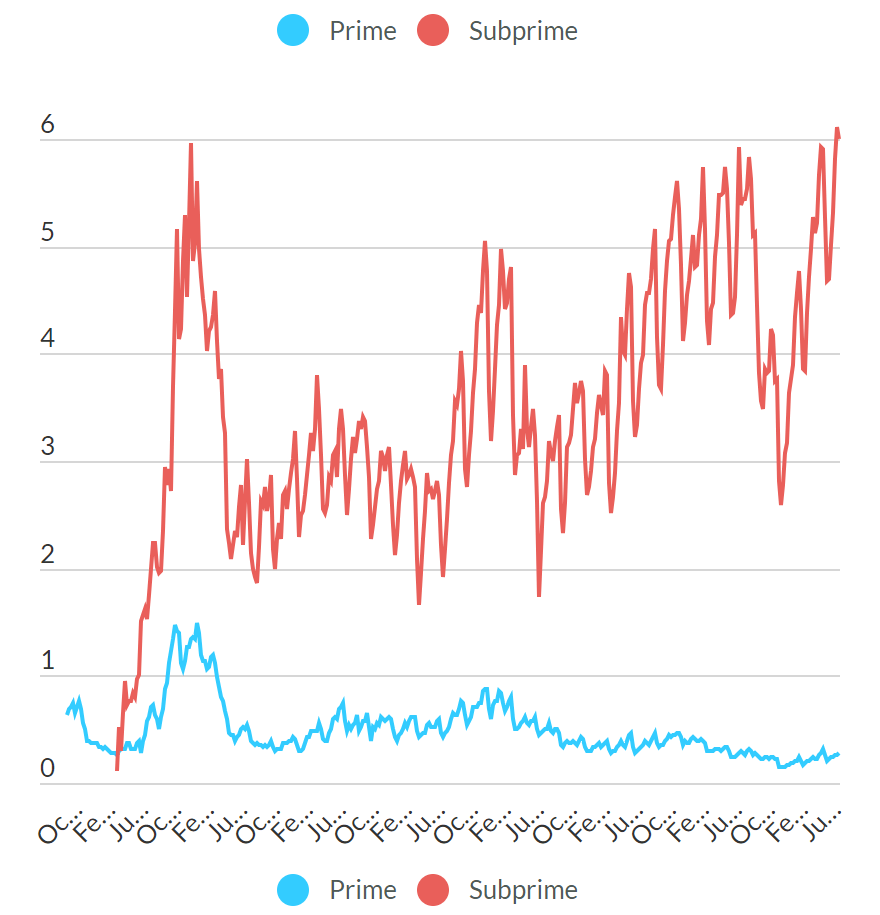
Auto loan debt typical lifecycle is typically 2.5 years, as people in the U.S. are getting their financing through auto dealers. They have a habit to trade in the old car after 2.5 years for a new one, and consequently refinance the old loan. Due to the short lifecycle interest rate on the debt is projected to be 6.7% by the end of 2023, peaking in 2024 near 7.7%. Prices have skyrocketed after the pandemic due to shortages, however they have retreated since -7.5 %. This can make in some cases the collateral worth less than the loan value, forcing borrowers to pay in additional capital when trade in. At the summer of 2023 the rejection rate was higher than the application rate, might be caused due to failed refinancing. Consequently, auto loan defaults are rising together with credit card defaults, while auto abs delinquencies rose to the 2008 high of 6% for subprime debt. Subprime securities share peaked in 2018 at 23%, retreated largely after Covid, accounted for 19% in 2021. Considering mortgage debt interest is only projected to peak in 2026, there will be growing debt servicing cost pressure on consumers which could easily lead to more defaults and delinquencies. The trend appears to be a worsening credit outlook, with the positive being rebound in used car prices which is effecting the collateral value positively. There is risk in reckless consumer and lender behavior, for example due to the need of additional paid in capital at refinancing and trade in, the borrower rather takes out a second loan from another lender. This could lead to the borrower purposefully defaulting on the original loan. There are some dealers reporting similar behavior in the used car market.
AUTO LOAN REJECTION RATE (BLOOMBERG) SUBPRIME AUTO ABS SHARE % (SIFMA) SUBRPIME AUTO ABS ISSUANCE (BLOOMBERG) AUTO LOAN 60+ DAYS DELINQUENT RATE (FITCH)
Borrower: Securitised Products
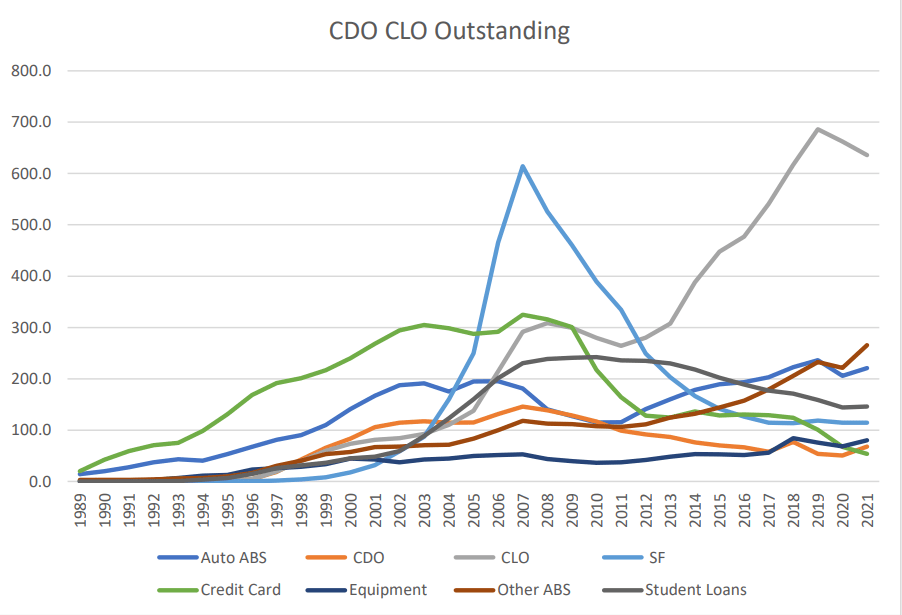
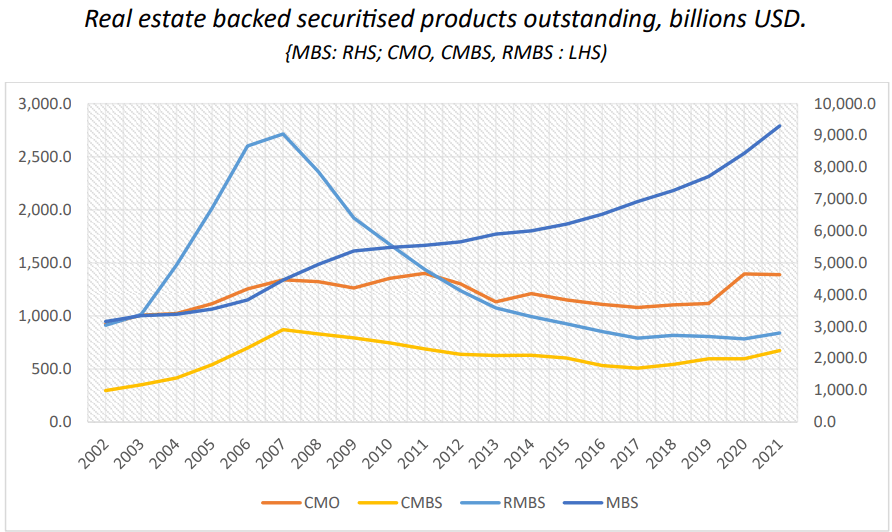
Mortgage Backed Securities ((MBS)) was the biggest securitized asset class accounted for $9.3 trillion at the end of 2021. Collateralized Mortgage Obligations ((CMO)), Residential Mortgage Backed Securities ((RMBS)) and Commercial Mortgage Backed Securities ((CMBS)) are also huge, together accounted for $2.9 Trillion at the end of 2021. Total mortgage backed securitized product were at $12.3 trillion. Not real estate backed securities accounted for $1.5 trillion altogether, with CLOs, Auto ABS, Student loan ABS were the largest categories. So far the most problematic sectors appears to be CLOs, Auto loan ABS , CMBS and credit card ABS. The rising delinquency data supports the underlying theories of structural problems in these sectors. These problematic sectors accounted for $1.6 trillion in 2021. Securitized products in general got much more transparent after the GFC, and the application as collateral decreased dramatically at least in tri party repo. They still serve as collateral for margin loans, bilateral repo or they are subject to collateral transformation. In addition to this, these markets serve as a secondary market for the debt originated. Therefore the dynamics in these markets are important as lenders willingness of originating loans would be influenced by those secondary market dynamics.
CDO CLO OUTSTANDING (SIFMA) REAL ESTATE BACKED SECURATIZED PRODUCTS (SIFMA)
Conclusion and Portfolio Allocation
Based on the delinquency data, investors can reasonably conclude that the U.S. has entered the next default cycle. The degree of severity is still an open question. So far, the most problematic sectors are leveraged loans, commercial real estate, auto loans and consumer loans in general, and the securitized products backed by them. Note, that the FED's sharp interest rate rises hasn't effected much of the existing dollar debt burden yet, as majority of the debt was refinanced during 2020-2021, and mass debt maturities will only start in 2024. As our modern economies are conditioned on ever-growing credit, the maturing debt will have to be refinanced. Through the refinancing mechanism, the higher rate environment will start effecting the U.S. and the world's interest obligations on the debt burden. The maturity wall will have two major effects: liquidity and interest payment impacts. There are already signs emerging from financial markets, which suggests refinancing liquidity can cause problems, such as contracting money and credit, money market spreads, tightening lending standards, bid ask spreads etc. On the other hand, the higher-for-longer rate policy would cause the interest burden to rise beyond 2027, which would cause the U.S. real domestic income to contract -0.24% annually from 2024 to 2027, if the GDP is capable of growing 2% in real terms. In other words, losing a total of -0.96% real net income from 2024-2027 can be considered a depression. This shows the U.S. economy's natural rate of interest is much lower where it is currently.
All of this suggests that investors can reasonably expect that delinquencies and defaults are heading substantially higher in the coming period due to the mass debt maturity and its consequences, unless the FED capitulates and drop rates heavily. Considering demand for safety and lowering rate trajectory, long-duration treasuries TLT , IEF appears to be a top portfolio position. Meanwhile, betting against (shorting) high yield bonds SJB , HYG or CLOs and leverage loans CBBB , FTSL provides investors the exposure to widening credit spreads and deteriorating delinquency conditions. Investors may consider structuring a widening credit spread trade, whereas going long in long duration treasuries and short high yield bond ETF or leverage loan ETF. This would allow for minimizing the general interest rate risk, meanwhile the interest income from the long position can finance most of the maintenance cost of the short position. Gold GLD , IAU , UGL , and AAAU may be also a safe haven asset to consider when allocating capital, especially in a declining rate environment for US10Y .
For further details see:
The Next Default Cycle Has Started And It Will Likely Crack Interest Rates