OXLCZ - The Retiree's Dividend Portfolio Jane's December Update: 2023 Dividend Projections
Summary
- Jane's retirement accounts generated a total of $2,506.30 of dividend income for January 2023 vs. $2,258.71 of dividend income for January 2022.
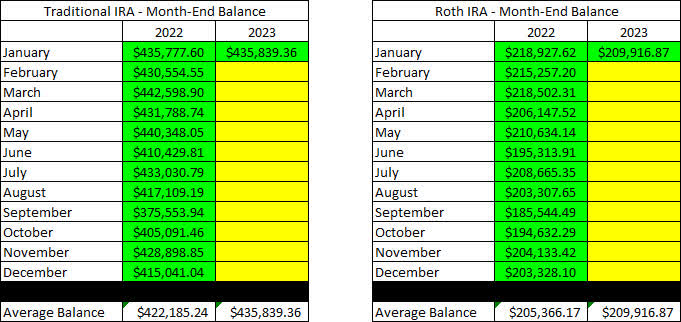
- Jane's Traditional IRA had a balance of $435.8K as of January 31, 2023, vs. $435.7K on January 31, 2022. The estimated annualized dividend yield is 5.36%.
- Jane's Roth IRA had a balance of $209.9K as of January 31, 2023, vs. $218.9K on January 31, 2022. The estimated annualized dividend yield is 6.06%.
- Seven companies paid an increased dividend or issued a special dividend during the month of January.
Dividend projections have been updated for Jane's Traditional and Roth IRAs for 2023 based on the current dividends being paid and the holdings that are in the account. These numbers will obviously change if and when shares are purchased, sold, etc.
The intro to this article is brief because I am playing catch-up after disconnecting from work for a week.
Background
For those interested in John and Jane's full background, you can find at least three articles a month published for the last five years detailing the performance of their portfolio. I have continued to evolve the report over time by adding and removing information/images to make the updates more useful to the average investor. Here are the key details that should be understood when reading these updates.
- This is a real portfolio with actual shares being traded. This is not a practice portfolio which is why I include screenshots from Charles Schwab to document every change that is made.
- I am not a financial advisor and merely provide guidance based on a relationship that goes back several years.
- John retired in January 2018 and has collected Social Security income as his regular source of income. John also currently withdraws $1,000/month from his Traditional IRA.
- Jane retired at the beginning of 2021 and decided to begin collecting Social Security early and has not made any withdrawals from her retirement accounts yet.
- John and Jane began drawing funds from the Taxable Account in 2022 at $1,000/month. After speaking with them this amount has been increased to $1,700/month. This withdrawal is still covered entirely by dividend and interest income.
- John and Jane have other investments outside of what I manage. These investments primarily consist of minimal-risk bonds and low-yield certificates.
- John and Jane have no debt or monthly payments other than basic recurring bills such as water, power, property taxes, etc.
The reason why I started helping John and Jane with their retirement accounts is that I was infuriated by the fees they were being charged by their previous financial advisor. I do not charge John and Jane for anything that I do .
The only request I have made of John and Jane is that they allow me to publish their portfolio anonymously because I want to help as many people as I can while holding myself accountable and improving my thought process.
I started this series to address issues I have had when reading other authors with similar types of updates (I am not saying they are wrong but I found myself questioning their actual performance because they never provided enough information to cover loose ends.
Here is my promise to readers:
- I aim to give as much information as needed so readers can feel confident that what I do is real.
- Even if you agree the results are real this does not mean I expect you to agree with me and I will always answer constructive criticism whenever possible. I will respond with the same genuine intent that the question was asked with.
- I am very transparent about the portfolio and consistency is a significant goal of mine. All of my data points (unless noted otherwise) are derived from month-end statements from Charles Schwab. Even when things aren't looking great (Spring 2020 for example) you will know because I provide enough information that it would be impossible for me to manipulate.
- This article is not intended to be advice or a call to action and is for informational purposes only (I am not a financial advisor and I don't claim to be one). My goal is to challenge conventional thinking and empower you to take control of your investments (if that's something you want to do).
While many authors require paid subscriptions to see their portfolio I do not want to go that route and will continue to publish this series for free as long as there is enough interest to make it worth my time (and I spend A LOT of time on these articles).
Generating a stable and growing dividend income with an emphasis on capital preservation has become the primary focus of this portfolio. I am least concerned about capital appreciation which is why the decisions made will seem pretty conservative most of the time. I may measure the performance of the portfolio relative to indexes and ETFs but the key metric I am focused on is delivering a more stable source of cash flow to John and Jane over time that allows them to live a comfortable retirement that includes minimal stress related to finances.
Dividend decreases
No companies in Jane's Traditional and Roth IRA accounts eliminated or reduced their dividend during the month of January.
Dividend increases
Seven companies paid increased dividends/distributions or a special dividend during the month of January.
- Alexandria Real Estate ( ARE )
- Canadian Imperial Bank of Commerce ( CM )
- Main Street Capital ( MAIN )
- Realty Income ( O )
- TD Synnex ( SNX )
- Toronto-Dominion Bank ( TD )
- W.P. Carey ( WPC )
O and WPC were covered in the Taxable Account update, so I will only include information about the dividend increases. Those interested in reading the summary of these two companies can check the link included at the end of the article.
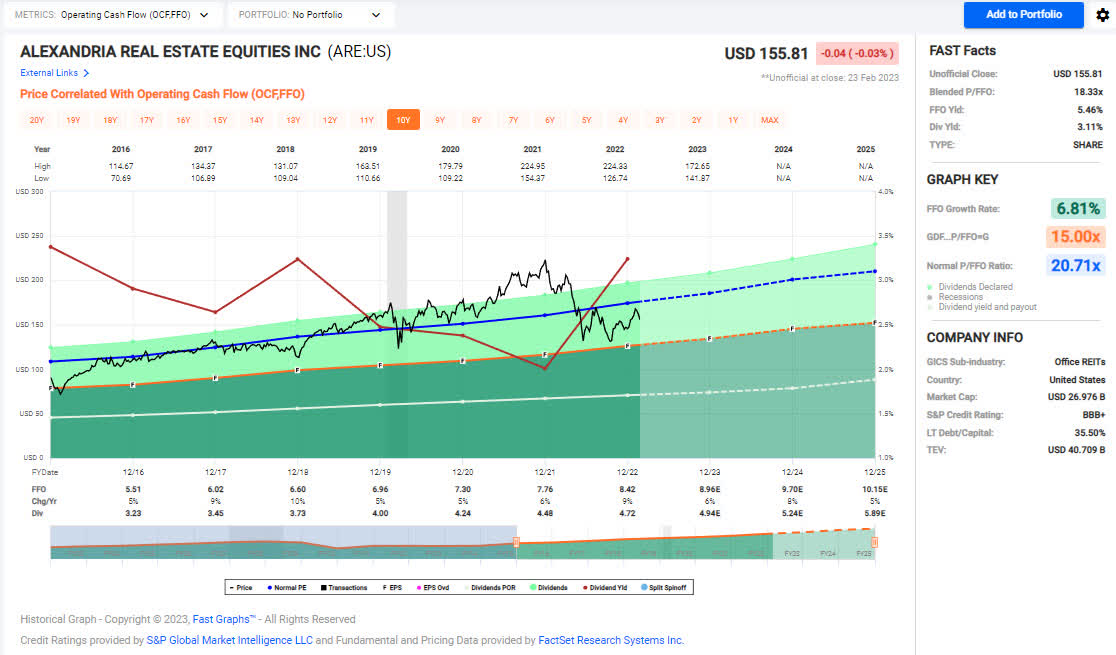
Alexandria Real Estate - ARE continues with its regular set of increases (they have been occurring in January and July over the last few years) and typically comes in just under 3%. ARE has seen a steady increase in rents and carries a strong FFO dividend coverage which means that there is no reason we will see a slowdown in future dividend increases. There were two metrics in particular that stand out from the Q4-2022 earnings report:
- Occupancy of operating properties in North America improved from 94.3% to 94.8% over the prior quarter.
- Same-property net operating income rose 4.7% Y/Y.
Looking at the FastGraphs image below, ARE appears to be undervalued at present especially given the continuous improvement in the quality of its portfolio and rising rents. The current price should be considered a reasonable entry point or a great time to add to an existing position.
The dividend was increased from $1.18/share per quarter to $1.21/share per quarter. This represents an increase of 2.5% and a new full-year payout of $4.84/share compared with the previous $4.72/ share. This results in a current yield of 3.11% based on the current share price of $155.81.
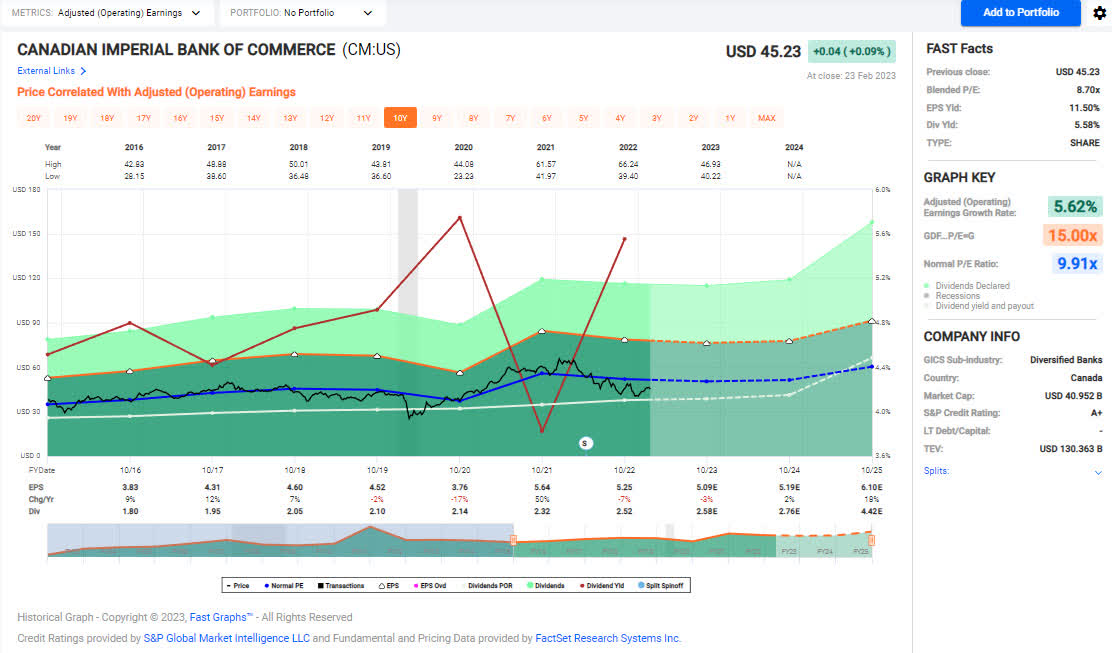
Canadian Imperial Bank of Commerce - January and July are the typical months that CM delivers increased dividends with January being the variable month (increases over the last few years range between 2%-10%). The increase for this quarter came in at 2.4% and follows worse-than-expected Q4-2022 results as the company experiences challenges in profit margin from lending and has directly impacted the net income of all of CM's businesses. I think there is also concern about increasing reserves for credit losses with economic uncertainty remaining unstable in 2023. CM's problems are not exclusive to its institution with basically all financial institutions feeling pressure in these areas.
Investors should consider building or add to their position in the low $40/share range. The price is currently reasonable but I think there will be good opportunities to add on the dips after the stock received rating downgrades.
The dividend was increased from $.83/share CAD per quarter to $.85/share CAD per quarter. This represents an increase of 2.4% and a new full-year payout of $2.60/share CAD compared with the previous $2.52/ share CAD. This results in a current yield of 5.57% based on the current share price of $45.23.
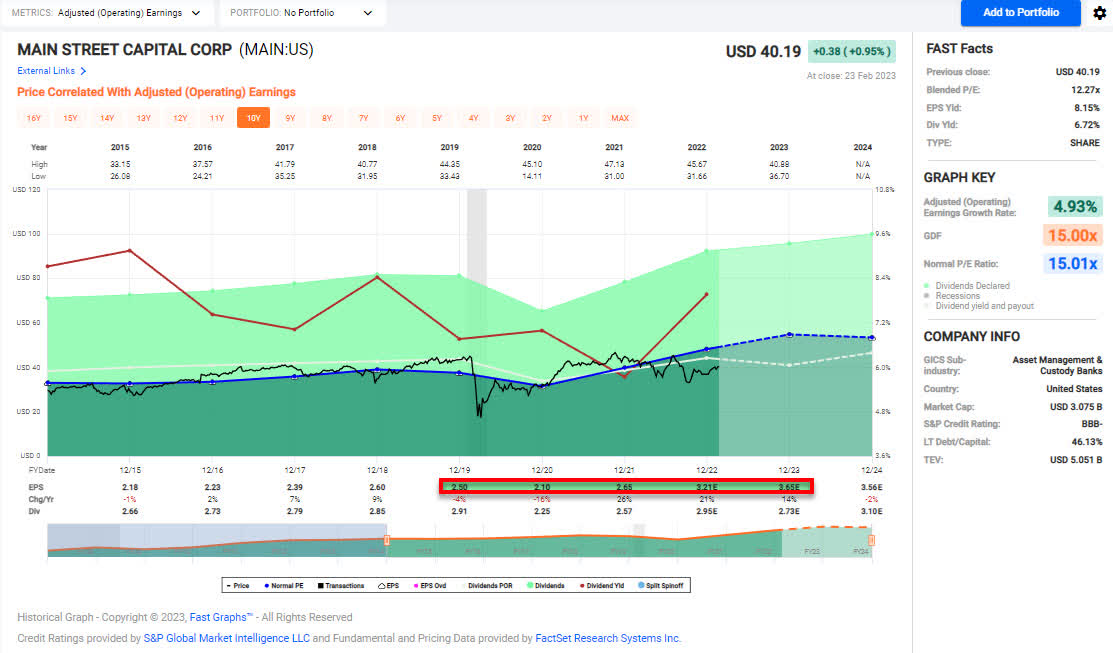
Main Street Capital - As interest rates rise MAIN's portfolio benefits with the majority of its borrowings made at fixed interest rates but the loans it's made being at variable interest rates. It was noted in the Q4-2022 earnings update that "MAIN benefits from rising interest rates, as the company's 73% outstanding debt obligations have fixed interest rates, while 76% debt investments bear interest at floating rates." MAIN also has equity positions in some of these businesses which can also generate substantial earnings when they exit an investment (this typically occurs when the company has grown to a point where they no longer need the financing and buys out MAIN's interest or can also happen if they are acquired or goes public). MAIN has a record of being one of the best BDCs available but shares often come at a premium price.
It was just announced today that MAIN's Q4-2022 saw a 15% increase in interest income.
If you can wait for shares under $35/share I would consider that a solid entry point for dividend yield and potential capital appreciation. Shares are fully valued at over $40/share.
The dividend was increased from $.22/share per month to $.225/share per month. This represents an increase of 2.3% and a new full-year payout of $2.70/share compared with the previous $2.64/ share. This results in a current yield of 6.78% based on the current share price of $40.19.
Realty Income - The dividend was increased from $.248/share per month to $.2485/share per month. This represents an increase of .2% and a new full-year payout of $2.982/share compared with the previous $2.976/ share. This results in a current yield of 4.66% based on the current share price of $66.08.
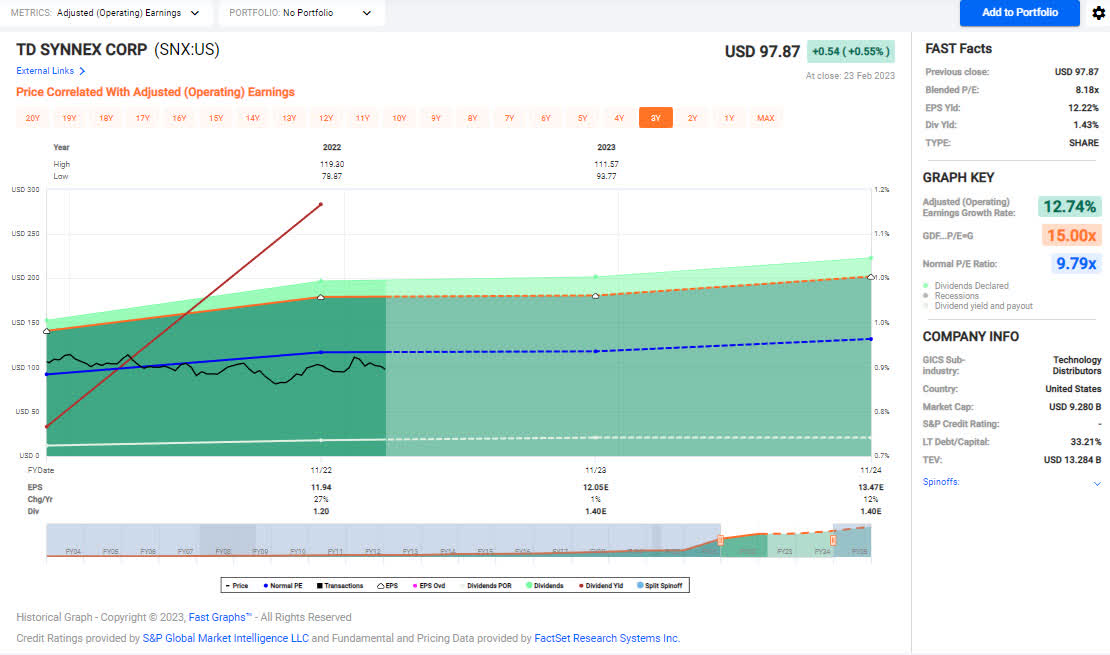
TD Synnex - SNX crushed its Q4-2022 earnings expectations and delivered a substantial dividend increase to investors. The company also announced a $1 billion share repurchase program for 2023 after returning $240 million to shareholders in fiscal 2022 through share repurchases and dividends. This share repurchase program is no joke because it represents approximately 10%+ of total outstanding shares at the current stock price. All of this comes after the merger of the company Tech Data and Synnex which suggests that the synergies of the combined companies have really paid off.
I expect that SNX will continue to demonstrate strong growth over the next year and that the company will maintain its shareholder-friendly policies (dividends and share repurchases).
The dividend was increased from $.30/share per quarter to $.35/share per quarter. This represents an increase of 16.7% and a new full-year payout of $1.40/share compared with the previous $1.20/ share. This results in a current yield of 1.44% based on the current share price of $97.87.
Toronto-Dominion Bank - While CM raised its dividend by 2.4% (which is on the low end of its normal January dividend increases) TD was able to provide a dividend increase three times larger than its competitor after strong Q4-2022 earnings. The acquisition of First Horizon ( FHN ) is expected to be completed in the first half of 2023 and there is strong optimism that regulators will let the deal take place. On the Q4-2022 earnings call , TD's CEO sounded very optimistic about the closing of the acquisition.
We are currently planning to close the transaction in the first half of fiscal 2023 subject to customary closing conditions, including approvals from U.S. and Canadian regulatory authorities. We are excited about the benefits that this acquisition will deliver for all of our stakeholders.
Given the positive news, I think that TD is one of the better-situated Canadian banks moving forward and we will be looking to potentially increase John and Jane's holdings.
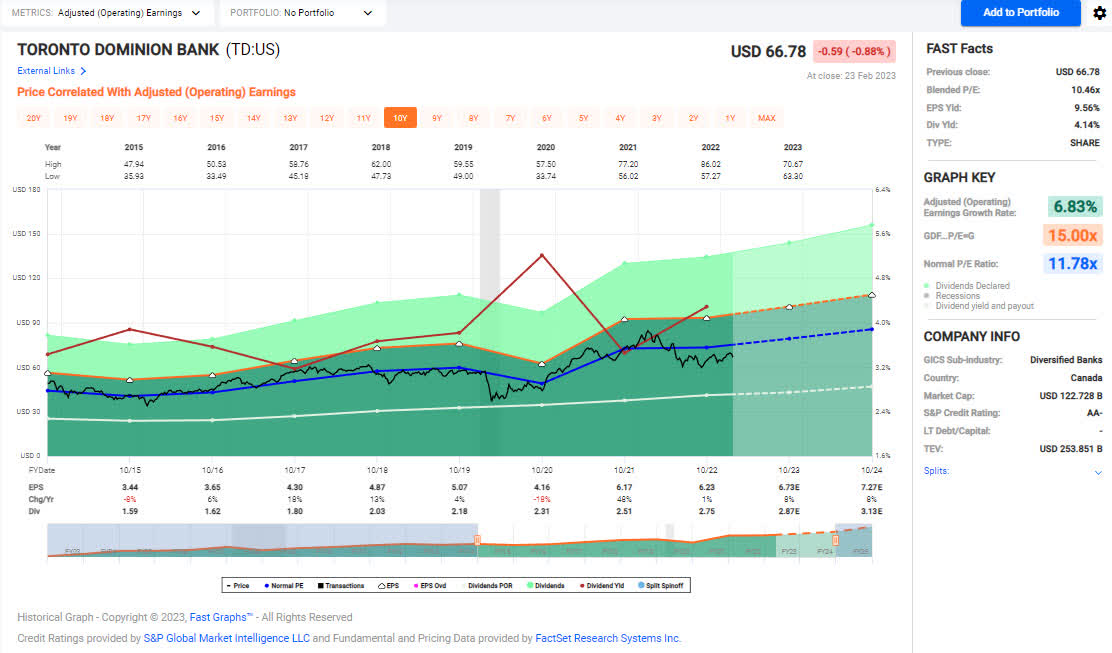
The dividend was increased from $.89/share CAD per quarter to $.96/share CAD per quarter. This represents an increase of 7.9% and a new full-year payout of $3.86/share CAD compared with the previous $3.58/ share CAD. This results in a current yield of 4.08% based on the current share price of $66.78.
W.P. Carey - The dividend was increased from $1.061/share per quarter to $1.065/share per quarter. This represents an increase of .4% and a new full-year payout of $4.26/share compared with the previous $4.244/ share. This results in a current yield of 5.17% based on the current share price of $83.15.
Retirement account positions
There are currently 38 different positions in Jane's Traditional IRA and 22 different positions in Jane's Roth IRA. While this may seem like a lot, it is important to remember that many of these stocks cross over in both accounts and are also held in the Taxable Portfolio.
Below is a list of the trades that took place in the Traditional IRA during the month of January.
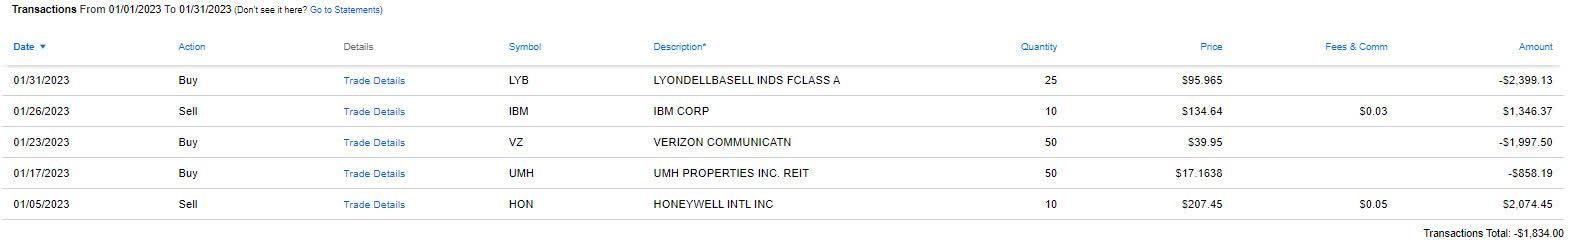
Below is a list of the trades that took place in the Roth IRA during the month of January.
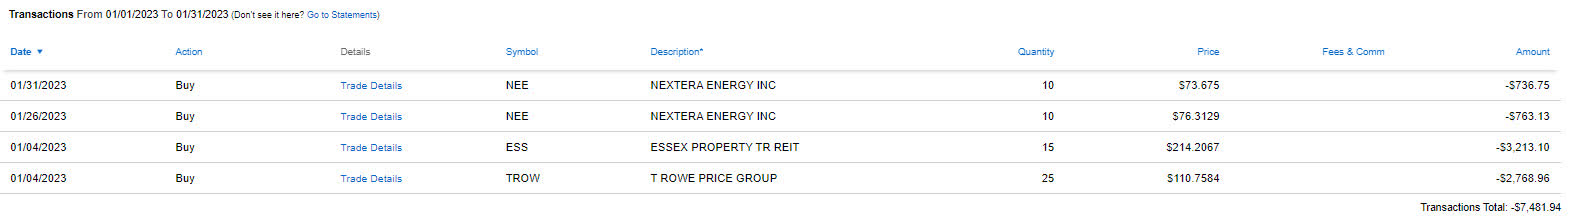
I will be working on an article soon to discuss some of these trades in the next few weeks.
January income tracker - 2022 Vs. 2023
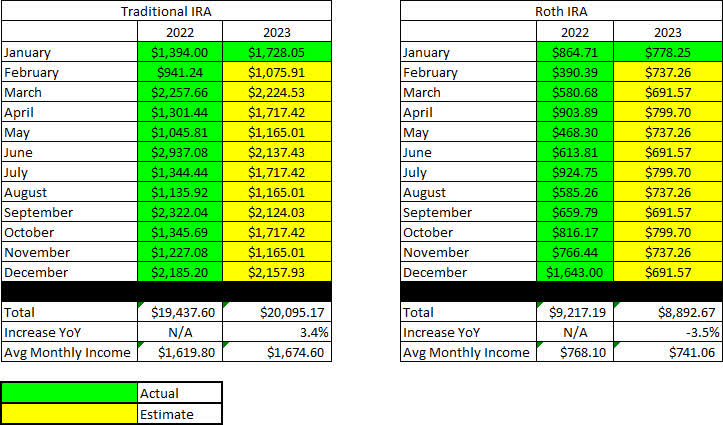
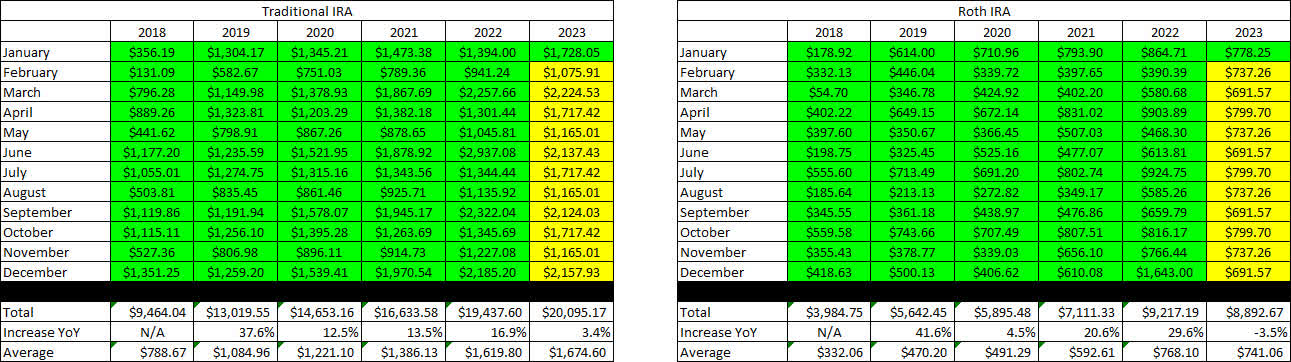
We are starting with a clean slate for 2023 and with all of the expected dividends (based on currently owned shares and announced dividend payments) the account is set for slight growth in the Traditional IRA and a slight decrease in the dividend income generated by the Roth IRA. Similar to the Taxable Account, the number of special dividend payouts in 2022 increased the yield of the portfolio at a faster pace (16.9% and 29.6%, respectively). While it's possible we could see more special dividends in 2023 I think it's more likely that executive management will focus on deleveraging or stock buybacks in most cases.
The Traditional IRA is expected to generate an average of $1,674.60/month of dividend income in 2023 compared to the average monthly income of $1,619.80 generated in FY-2022. The Roth IRA is expected to generate an average of $741.06/month of dividend income in 2023 compared to the average monthly income of $768.10 generated in FY-2022.
Once dividend increases are factored in and the additional interest income from CDs I expect we will see a very light increase in dividend income of 3-4%.
At this point, Jane has decided she will not be making any withdrawals from these accounts which means that the dividends will be collected as cash and potentially reinvested.
SNLH = Stocks No Longer Held - Dividends in this row represent the dividends collected on stocks that are no longer held in that portfolio. We still count the dividend income from stocks no longer held in the portfolio, even though it is non-recurring. All images below come from Consistent Dividend Investor, LLC. (also referred to as CDI as the source below).
The tables below represent which companies paid dividends in January and how that income source has changed since January of the previous year.
Traditional IRA - 2022 V 2023 - January Dividends ((CDI)) Roth IRA - 2022 V 2023 - January Dividends ((CDI))
The table below represents all income generated in 2022 and collected/expected dividends in 2023.
Below gives an extended look back at the dividend income generated when I first began writing these articles. I find this table to be most useful when comparing how dividend income has improved for a specific month over the course of six years.
Retirement Projections - 2023 - January - 6 YR History ((CDI))
The balances below are from January 31, 2023, and all previous month's balances are taken from the end-of-month statement provided by Charles Schwab.
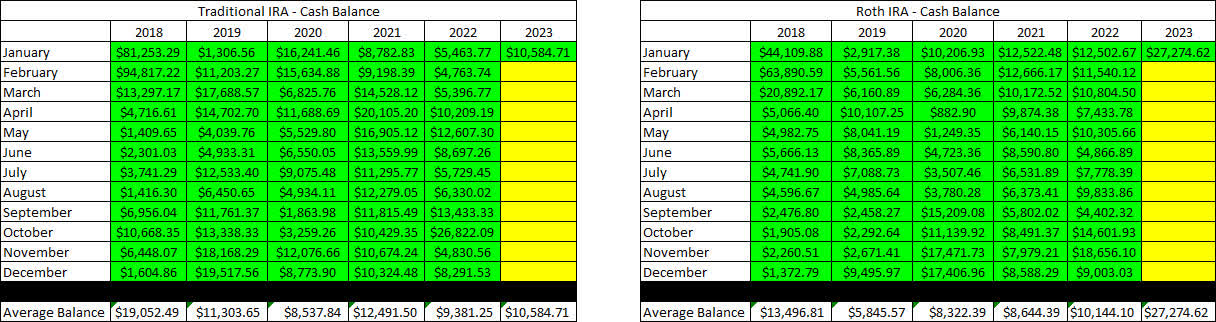
The next image is also pulled from the end-of-month statement provided by Charles Schwab which shows the cash balance of the account.
**Please note that cash balances may fluctuate based on CD renewal dates because I only count the cash that is 100% liquid. There were larger fluctuations in 2019 and 2020 that we the result of deposits and withdrawals being made. There will be no contributions made into either account in 2023 now that Jane is no longer working.
Retirement Projections - 2023 - January - Cash Balances ((CDI))
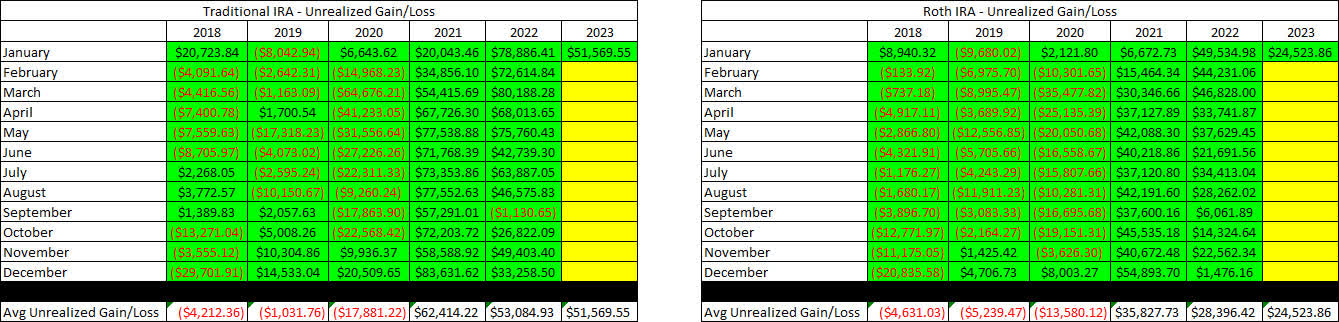
The next image provides a history of the unrealized gain/loss at the end of each month going back to the beginning of January 2018.
Retirement Projections - 2023 - January - Unrealized Gain-Loss ((CDI))
I think the table above is one of the most important for readers to understand because it paints a story of volatile markets and why we employ the strategy of generating consistent cash flows to overcome the uncertainty of the market. If we were dependent on selling shares to generate income for John and Jane's retirement they would have to be much more considerate of when they withdraw and how much they choose to withdraw.
For example, a withdrawal in 2020 where shares must be sold would destroy more value by locking in losses or poor performance by stocks being sold compared to making the same withdrawal in 2021.
In an effort to be transparent about John and Jane's Taxable Account, I like to include an unrealized Gain/Loss summary. The numbers used are based on the closing prices from February 23, 2023.
Traditional IRA - 2023 - January - Gain-Loss ((CDI)) Roth IRA - 2023 - January - Gain-Loss ( CDI )
It is worth noting in the table above that the yield column is most accurate at the start of the year but if I reduce the size of positions it may inflate the yield because it is based on how much dividend income is collected. At the same time, it may report excessively low dividends for positions added or significantly increased at the end of the year.
Conclusion
In the Taxable article, I mentioned a few ideas that I have been contemplating for adding value to these articles. The ideas listed were:
- Rebuild the graphs to show cumulatively income per month and year for all three portfolios (Taxable and Retirement Account for John and Jane).
- Build an additional table for future projections of dividend income based on conservative, moderate, and best-case scenarios of dividend growth over the next five years.
- Adding a "Watchlist" section of the articles where I briefly cover stocks that are on my radar (including those that are already in the portfolio as well as not currently held). I would also use this section to address stocks suggested by readers.
- I am open to suggestions not listed above!
From the comments section on the Taxable article, it was overwhelmingly clear that readers wanted to see some sort of a watchlist section that discusses ideas stocks that are on my radar including potential entry prices and other information of interest.
January articles
I have provided the links to the 2022 Year-End Review Article and January 2023 Taxable Account below.
The Retiree's Dividend Portfolio : Complete 2022 Review - Cash Flow Is King
The Retirees' Dividend Portfolio : John And Jane's January 2023 Taxable Account Update
In Jane's Traditional and Roth IRAs, she is currently long the following mentioned in this article: AbbVie ( ABBV ), Agree Realty ( ADC ), Agree Realty Preferred Series A ( ADC.PA ), Archer-Daniels-Midland ( ADM ), Broadcom ( AVGO ), Avient ( AVNT ), Bank of America ( BAC ), BlackRock Health Sciences Trust ( BME ), Bank of Nova Scotia ( BNS ), BP ( BP ), British American Tobacco ( BTI ), Canadian Imperial Bank of Commerce ( CM ), Cummins ( CMI ), Concentrix ( CNXC ), Digital Realty ( DLR ), Eaton Vance Floating-Rate Advantage Fund A ( EAFAX ), Enbridge ( ENB ), EPR Properties Preferred Series E ( EPR.PE ), Eaton Corporation ( ETN ), East West Bancorp ( EWBC ), General Mills ( GIS ), GasLog Partners Preferred C ( GLOP.PC ), Honeywell ( HON ), International Business Machines ( IBM ), Iron Mountain ( IRM ), Lexington Realty Preferred Series C ( LXP.PC ), Lumen Technologies ( LUMN ), LyondellBasell ( LYB ), Main Street Capital ( MAIN ), 3M ( MMM ), Altria ( MO ), Annaly Capital Preferred Series G ( NLY.PG ), NextEra Energy ( NEE ), NetApp ( NTAP ), New York Community Bank ( NYCB ), Realty Income ( O ), OGE Energy Corp. ( OGE ), Oxford Lane Capital Corp. 6.75% Cum Red Pdf Shares Series 2024 ( OXLCM ), Philip Morris ( PM ), PPG Industries ( PPG ), PIMCO Corporate & Income Opportunity Fund ( PTY ), Cohen & Steers REIT & Preferred Income Fund ( RNP ), Royal Bank of Canada ( RY ), TD SYNNEX Corp. ( SNX ), STORE Capital ( STOR ), Toronto-Dominion Bank ( TD ), T Rowe Price ( TROW ), Unilever ( UL ), UMH Properties ( UMH ), Verizon ( VZ ), Williams Companies ( WMB ), W. P. Carey ( WPC ).
For further details see:
The Retiree's Dividend Portfolio, Jane's December Update: 2023 Dividend Projections