OXLCZ - The Retiree's Dividend Portfolio Jane's March Update: 12 Stocks Generating More Dividends
2023-04-15 09:00:00 ET
Summary
- Jane's retirement accounts generated a total of $3,249.92 of dividend income for March 2023 vs. $2,838.34 of dividend income for March 2022.
- Jane's Traditional IRA had a balance of $419.7K as of March 31, 2023, vs. $442.6K on March 31, 2022. The estimated annualized dividend yield is 5.41%.
- Jane's Roth IRA had a balance of $200.6K as of March 31, 2023, vs. $218.5K on March 31, 2022. The estimated annualized dividend yield is 5.04%.
- A total of twelve companies paid an increased dividend or issued a special dividend during the month of March.
I will do an update on the watchlist as a separate article. This article is already huge because there are a total of 12 dividend increases or special dividends that were paid in the month of March.
Background
For those interested in John and Jane's full background, you can find at least three articles a month published for the last five years detailing the performance of their portfolio. I have continued to evolve the report over time by adding and removing information/images to make the updates more useful to the average investor. Here are the key details that should be understood when reading these updates.
- This is a real portfolio with actual shares being traded. This is not a practice portfolio which is why I include screenshots from Charles Schwab to document every change that is made.
- I am not a financial advisor and merely provide guidance based on a relationship that goes back several years.
- John retired in January 2018 and has collected Social Security income as his regular source of income. John also currently withdraws $1,000/month from his Traditional IRA.
- Jane retired at the beginning of 2021 and decided to begin collecting Social Security early and has not made any withdrawals from her retirement accounts yet.
- John and Jane began drawing funds from the Taxable Account in 2022 at $1,000/month. After speaking with them this amount has been increased to $1,700/month. This withdrawal is still covered entirely by dividend and interest income.
- John and Jane have other investments outside of what I manage. These investments primarily consist of minimal-risk bonds and low-yield certificates.
- John and Jane have no debt or monthly payments other than basic recurring bills such as water, power, property taxes, etc.
The reason why I started helping John and Jane with their retirement accounts is that I was infuriated by the fees they were being charged by their previous financial advisor. I do not charge John and Jane for anything that I do .
The only request I have made of John and Jane is that they allow me to publish their portfolio anonymously because I want to help as many people as I can while holding myself accountable and improving my thought process.
I started this series to address issues I have had when reading other authors with similar types of updates (I am not saying they are wrong but I found myself questioning their actual performance because they never provided enough information to cover loose ends).
Here is my promise to readers:
- I aim to give as much information as needed so readers can feel confident that what I do is real.
- Even if you agree the results are real this does not mean I expect you to agree with me and I will always answer constructive criticism whenever possible. I will respond with the same genuine intent that the question was asked with.
- I am very transparent about the portfolio and consistency is a significant goal of mine. All of my data points (unless noted otherwise) are derived from month-end statements from Charles Schwab. Even when things aren't looking great (Spring 2020 for example) you will know because I provide enough information that it would be impossible for me to manipulate.
- This article is not intended to be advice or a call to action and is for informational purposes only (I am not a financial advisor and I don't claim to be one). My goal is to challenge conventional thinking and empower you to take control of your investments (if that's something you want to do).
While many authors require paid subscriptions to see their portfolio I do not want to go that route and will continue to publish this series for free as long as there is enough interest to make it worth my time (and I spend A LOT of time on these articles).
Generating a stable and growing dividend income with an emphasis on capital preservation has become the primary focus of this portfolio. I am least concerned about capital appreciation which is why the decisions made will seem pretty conservative most of the time. I may measure the performance of the portfolio relative to indexes and ETFs but the key metric I am focused on is delivering a more stable source of cash flow to John and Jane over time that allows them to live a comfortable retirement that includes minimal stress related to finances.
Dividend Decreases
No companies in Jane's Traditional and Roth IRA accounts eliminated or reduced their dividend during the month of March.
Dividend Increases
Twelve companies paid increased dividends/distributions or a special dividend during the month of March.
- Archer-Daniels-Midland ( ADM )
- BP p.l.c. ( BP )
- Enbridge ( ENB )
- Main Street Capital ( MAIN )
- 3M ( MMM )
- NextEra Energy ( NEE )
- Realty Income ( O )
- Owl Rock Capital ( ORCC )
- T. Rowe Price ( TROW )
- Unilever ( UL )
- UMH Properties ( UMH )
- The Williams Companies ( WMB )
ADM and O were covered in the Taxable Account update. I will only include information about the dividend increases associated with these. Those interested in reading the summary of these two companies can check the links at the end of the article.
Archer-Daniels-Midland - The dividend was increased from $.40/share per quarter to $.45/share per quarter. This represents an increase of 12.5% and a new full-year payout of $1.80/share compared with the previous $1.60/ share. This results in a current yield of 2.25% based on the current share price of $81.39.
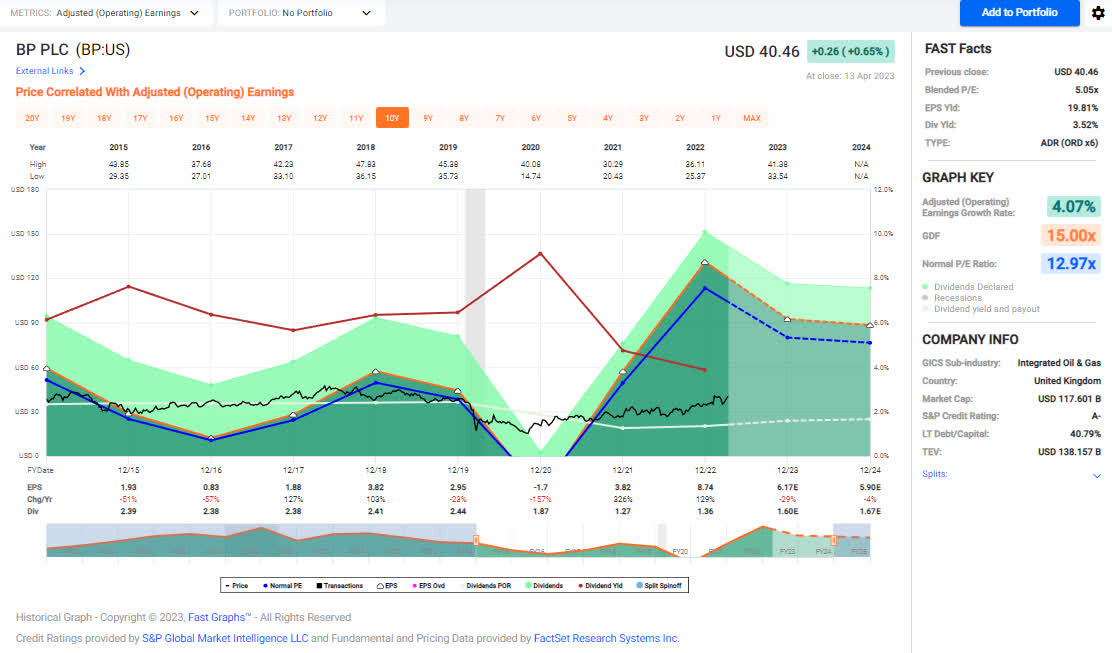
BP p.l.c. - Investor sentiment toward BP has improved significantly over the last several months, particularly since the beginning of Q4-2022. BP will continue to focus on hydrocarbon production but has added a focus on specialized renewable energy including biofuels, hydrogen, and electronic vehicle charging projects. With strong demand for oil and increased prices, this will bring in a lot of cash as the company engages with its renewable portfolio, including its recent announcement to purchase TravelCenters of America ( TA ). The benefit of the TA acquisition would be to distribute its product and set up a nationwide system that would allow BP to develop an energy distribution network in the United States and Canada.
With the "new" BP making some serious moves and generating significant profits it makes sense to continue adding shares, especially on any pullbacks in stock price. This TA acquisition is an excellent move to maintain relevance as the transportation market expands and the demand for additional fuel types becomes more relevant.
The dividend was increased from $.36036/share per quarter to $.3966/share per quarter. This represents an increase of 10% and a new full-year payout of $1.5864/share compared with the previous $1.44144/ share. This results in a current yield of 4% based on the current share price of $39.86.
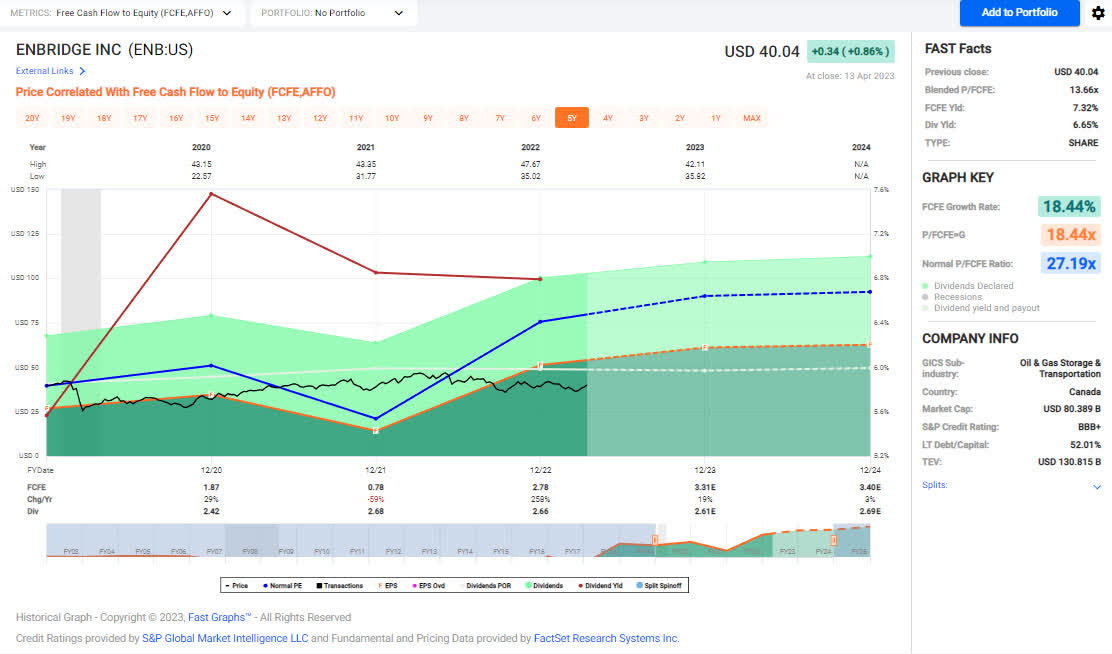
Enbridge - ENB came close to its 52-week low recently and has bounced with the increase in energy prices. The dividend growth isn't anything to celebrate but the stock still offers a compelling yield. More importantly, ENB's portfolio of energy infrastructure is absolutely critical. Outside of actual performance events with railway chemical spills have begun to overshadow pipeline leaks and support the continued use of pipelines as the better environmental alternative.
From a yield perspective, ENB is most attractive when the yield is above 7% but the current entry point of 6.60% is also worthwhile. I would consider ENB to be fairly valued when the dividend yield is less than 6% which would be just $44/share.
The dividend was increased from $.86C/share per quarter to $.8875C/share per quarter. This represents an increase of 3.2% and a new full-year payout of $3.55C/share compared with the previous $3.44C/ share. This results in a current yield of 6.59% based on the current share price of $40.04.
Main Street Capital - I'll keep the writeup for MAIN light because I've written about this company a lot in recent months due to the number of dividend increases and supplemental/special dividend payouts. One reason why MAIN continues to pay out additional supplemental dividends is that as a BDC they are required to distribute 90% of net income to shareholders to maintain their favorable tax status. I think it is worth mentioning again that " MAIN benefits from rising interest rates, as the company's 73% outstanding debt obligations have fixed interest rates, while 76% debt investments bear interest at floating rates."
MAIN paid a supplemental dividend of $.175/share in the month of March.
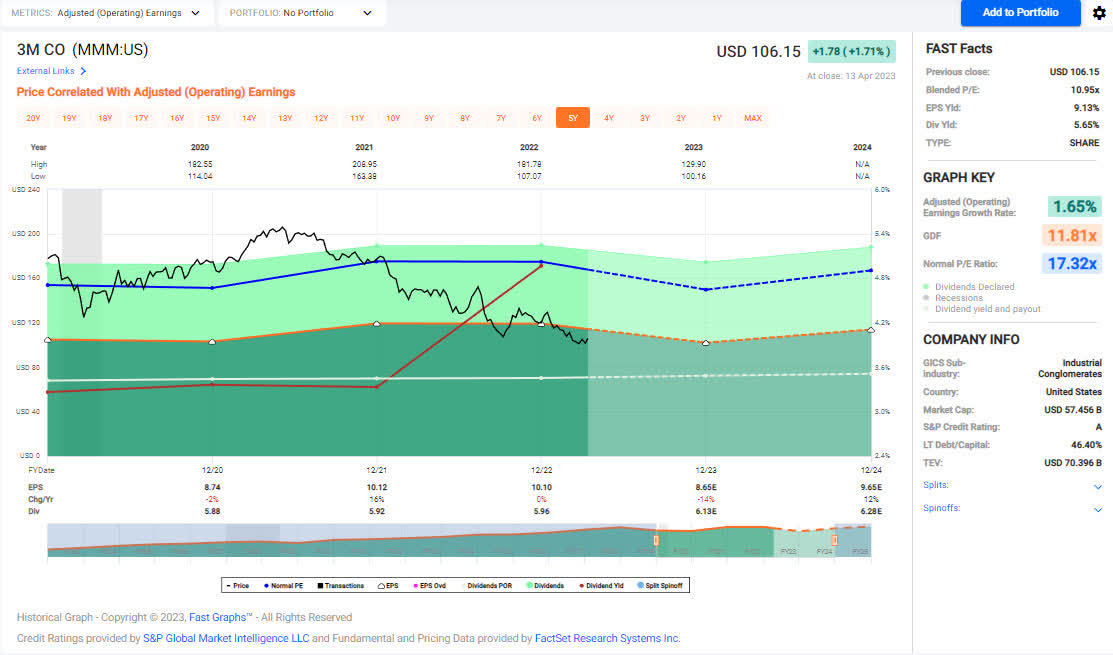
3M - The iconic industrial conglomerate has dominated for decades and it wouldn't surprise me if every American household had at least one 3M product in it. Although 3M's reputation is outstanding, there have been a number of issues that have plagued the company in recent years and have contributed to the stock price reaching a 10-year low. The company is currently involved in two lawsuits that have the potential to impact the company significantly. Many companies will try to project the cost of lawsuits but the size and scope of the recent lawsuits led the CFO to make the following remarks , "We can't predict what that number is going to look like, and therefore, the guidance that we've given you of [adjusted] EPS of $8.50 to $9 excludes those litigation matters."
This has led the stock to offer a yield of 5.75% which is nearly double the yield that it has historically traded for. There is a fair amount of risk when you take into consideration the outstanding lawsuits but if we weren't already as heavily invested in a 3M position we would definitely consider adding more. Any dividend increases we see moving forward will be to maintain the 64-year track record of annual dividend increase, that is at least until the litigation and stagnant growth problems are resolved.
The dividend was increased from $1.49/share per quarter to $1.50/share per quarter. This represents an increase of .7% and a new full-year payout of $6.00/share compared with the previous $5.96/ share. This results in a current yield of 5.75% based on the current share price of $106.15.
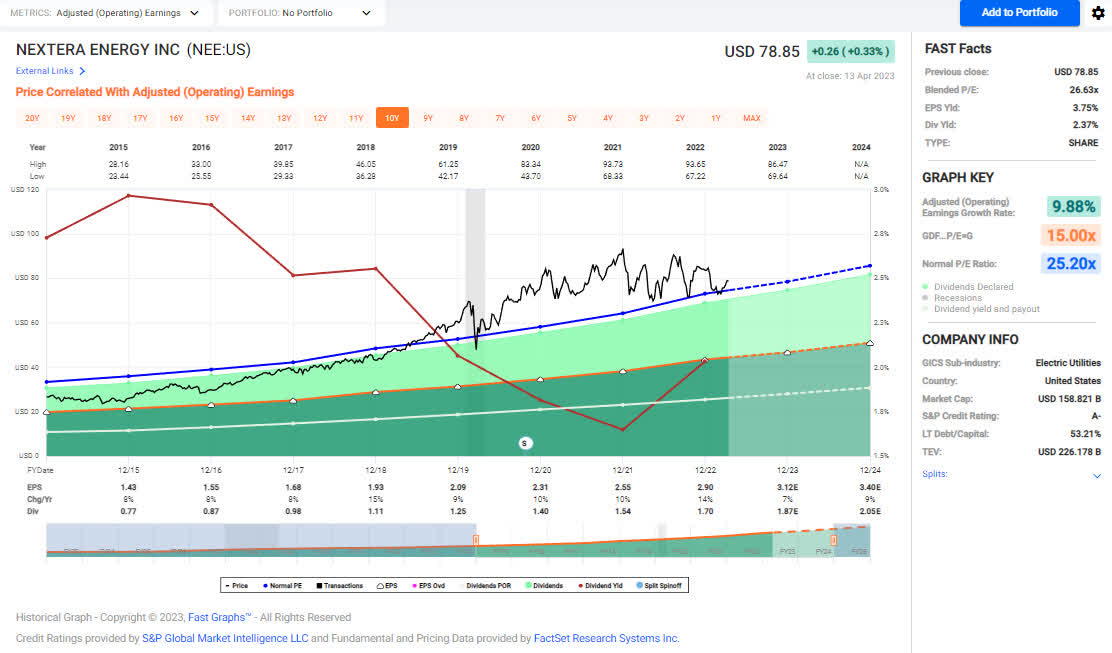
NextEra Energy - NEE is a great utility that is worth considering for any portfolio because it offers stellar dividend growth with three-year and ten-year dividend growth averages both exceeding 10% which tells us that historically shareholders have done well collecting dividends and that the trend has continued even recently.
One strategy that we have adopted with NEE is to make regular small purchases (especially when the dividend yield is above 2.25%) and to sell shares when the dividend yield is somewhere below 2%. I've attached the screenshot that shows every trade for NEE over the last two years (the position was established at the end of Q1-2021). The share price exploded heading into the end of 2022 and we used that opportunity to reduce the number of high-cost shares. Every time we do a sale we always choose the high-cost position since this lowers the overall cost basis of the position.
The dividend was increased from $.4250/share per quarter to $.4675/share per quarter. This represents an increase of 10% and a new full-year payout of $1.87/share compared with the previous $1.70/ share. This results in a current yield of 2.38% based on the current share price of $78.85.
Realty Income - The dividend was increased from $.2485/share per month to $.2545/share per month. This represents an increase of 2.4% and a new full-year payout of $3.054/share compared with the previous $2.982/ share. This results in a current yield of 4.94% based on the current share price of $61.53.
Owl Rock Capital - ORCC recently announced a dividend increase in December along with a supplemental dividend of $.03/share. This supplemental dividend is the result of strong Q4-2022 earnings including gains in book value and recording the highest level of net interest income since the company IPO'd.
In a previous article, Owl Rock Capital - Build A Position Before Q3 2022 For Maximum Upside, I noted that the company has 99% of its investments using floating interest rates based on LIBOR but they hadn't seen any significant benefit to the earnings as of Q2-2022. Ultimately the reason was that their investments reset in Q3-2022 and now ORCC is actually benefitting from the increased interest rate.
ORCC paid their normal quarterly dividend of $.33/share but added an additional supplemental dividend of $.04/share in the month of March.
T. Rowe Price - TROW currently yields 4.42% which is substantially higher than its four-year average dividend yield of 3.31%. Concerns about market valuations and stagnant and increasing outflows of assets under management ((AUM)) are the two primary issues negatively impacting its current valuation. Advisory fees are down considerably but I think that the current environment is one that TROW will be able to innovate in and strengthen its business model because the company maintains maximum flexibility as it carries no debt. TROW has a long track record of innovation and performance so I am confident in their ability to succeed in the current environment.
The lackluster dividend increase is reasonable given the company's 10-year dividend growth of 13.2% and its previous issuance of a $3.00/share special dividend.
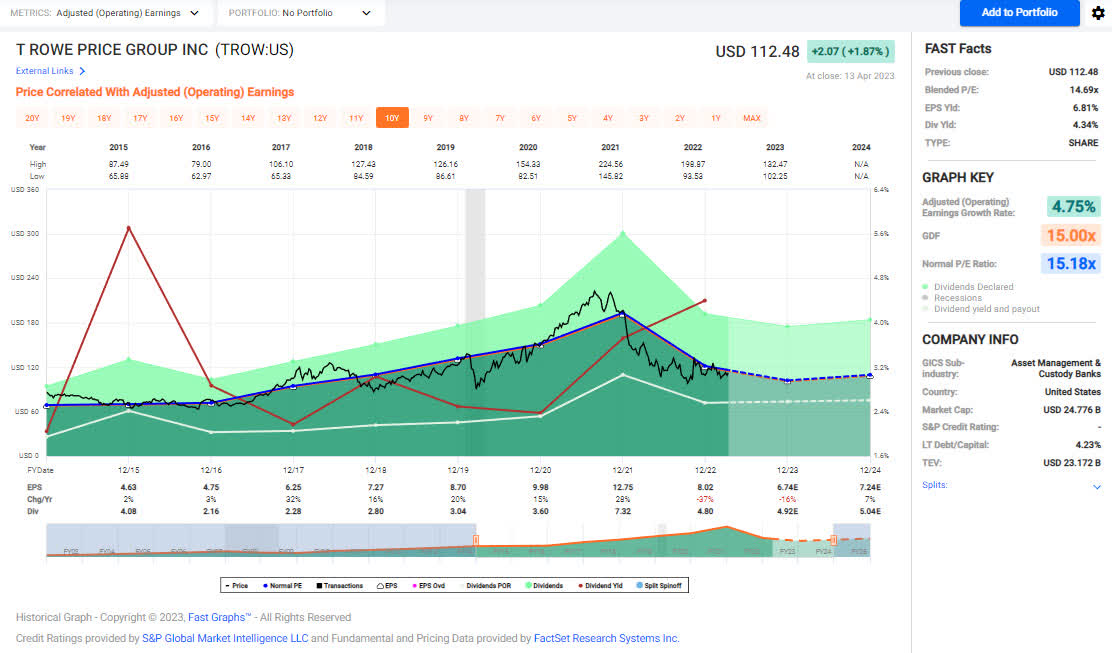
The dividend was increased from $1.20/share per quarter to $1.22/share per quarter. This represents an increase of 1.7% and a new full-year payout of $4.88/share compared with the previous $4.80/ share. This results in a current yield of 4.42% based on the current share price of $112.48.
Unilever - In the same way that you likely have a 3M product in your house, you are also likely to have a UL product in your house as well. With rampant inflation dominating news headlines as we head into what is likely to be a very difficult recession make me concerned about the position in UL especially after a rough performance that started almost exactly one year ago. It should be noted that practically all of the sales growth can be attributed directly to price increases that the company announced would happen to offset the increased cost of production. The CEO, Alan Jope, noted the following figures for Q4-2022.
We delivered Q4 underlying sales growth of 9.2%, that was driven by 13.3% price, with volumes down 3.6%, and that resulted in full-year growth of 9% with price up 11.3% and volumes down 2.1%. While the volume impact was greater than in previous quarters, it is still less than we would have modeled at these levels of price growth.
I see the strong dividend increase as a vote of confidence from management about the direction of the company and the pricing power that it holds with consumers.
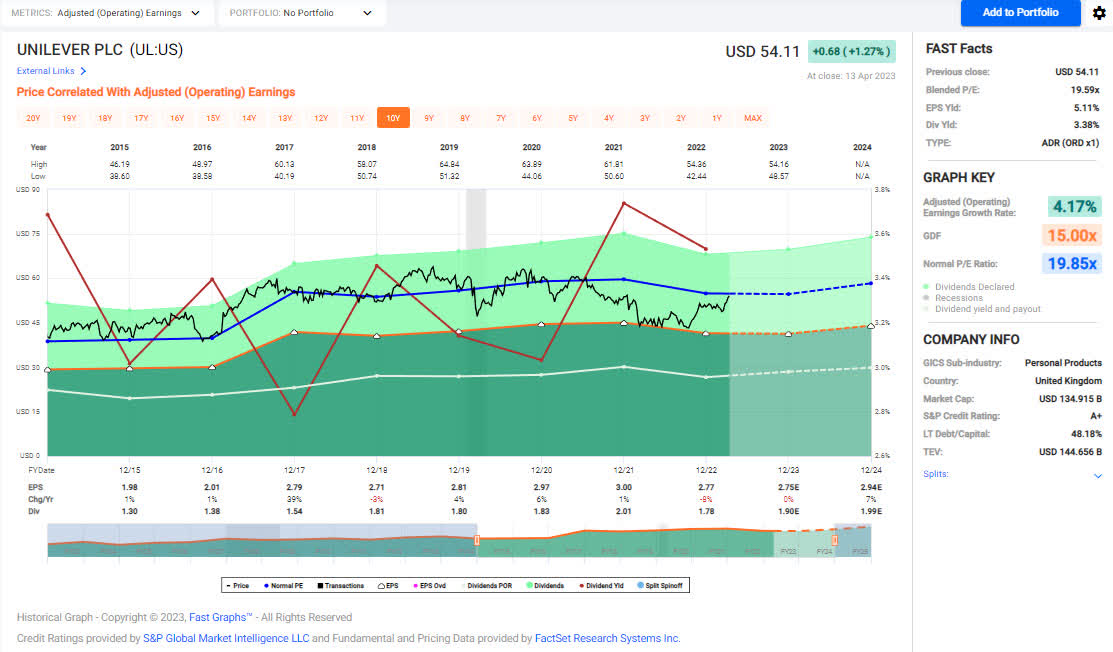
The dividend was increased from $.421/share per quarter to $.457/share per quarter. This represents an increase of 8.6% and a new full-year payout of $1.828/share compared with the previous $1.684/ share. This results in a current yield of 3.42% based on the current share price of $54.11.
UMH Properties - UMH is an investment that looks a little risky but I think the companies underlying changes justify taking some risk because they are positioning themselves to capture the growing need for affordable housing. The company has approximately 9,100 rental homes in the portfolio (an increase of 392 homes for 2022) and the portfolio is 93.3% rented out at $873/month. The recent earnings call also indicated that part of the issue with the Q4-2022 earnings report is that the company was unable to obtain homes from the manufacturers and recently received 1,000 homes that are currently being set up.
The point is that I think the risk of a dividend increase is overblown and too reliant on the narrative that UMH isn't growing at the pace it needs to. To be clear, I am not implying that there is no risk with UMH but I think the current share price and trends with housing give credence to UMH's business model.
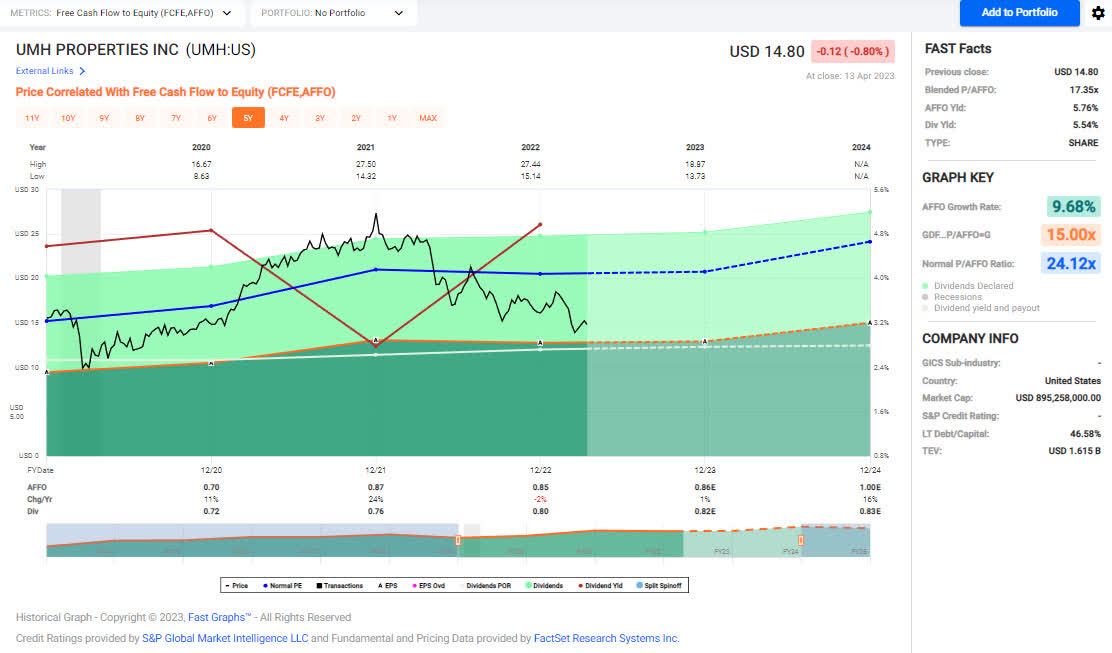
The dividend was increased from $.20/share per quarter to $.205/share per quarter. This represents an increase of 2.5% and a new full-year payout of $.82/share compared with the previous $.80/ share. This results in a current yield of 5.50% based on the current share price of $14.80.
Williams Companies - Energy prices in March pushed many companies in that sector toward their 52-week low and WMB was not immune to this. The price has since bounced back with higher energy prices but recently received a cut from Truist suggesting that the next 5-7 quarters will be lackluster/moderate. Another analyst pointed out that there are a total of eight projects that would allow EBITDA to double by 2025 compared to 2021.
WMB has continued to provide a compelling yield and is growing at a pace that is comfortable without exposing itself to the risk of unnecessary leverage. With the potential for growth in place, I think the current price represents a worthwhile entry point for the long-term investor who plans to hold for the next few years.
The dividend was increased from $.4250/share per quarter to $.4475/share per quarter. This represents an increase of 5.3% and a new full-year payout of $1.79/share compared with the previous $1.70/ share. This results in a current yield of 5.90% based on the current share price of $30.50.
Retirement Account Positions
There are currently 37 different positions in Jane's Traditional IRA and 21 different positions in Jane's Roth IRA. While this may seem like a lot, it is important to remember that many of these stocks cross over in both accounts and are also held in the Taxable Portfolio.
Below is a list of the trades that took place in the Traditional IRA during the month of March.
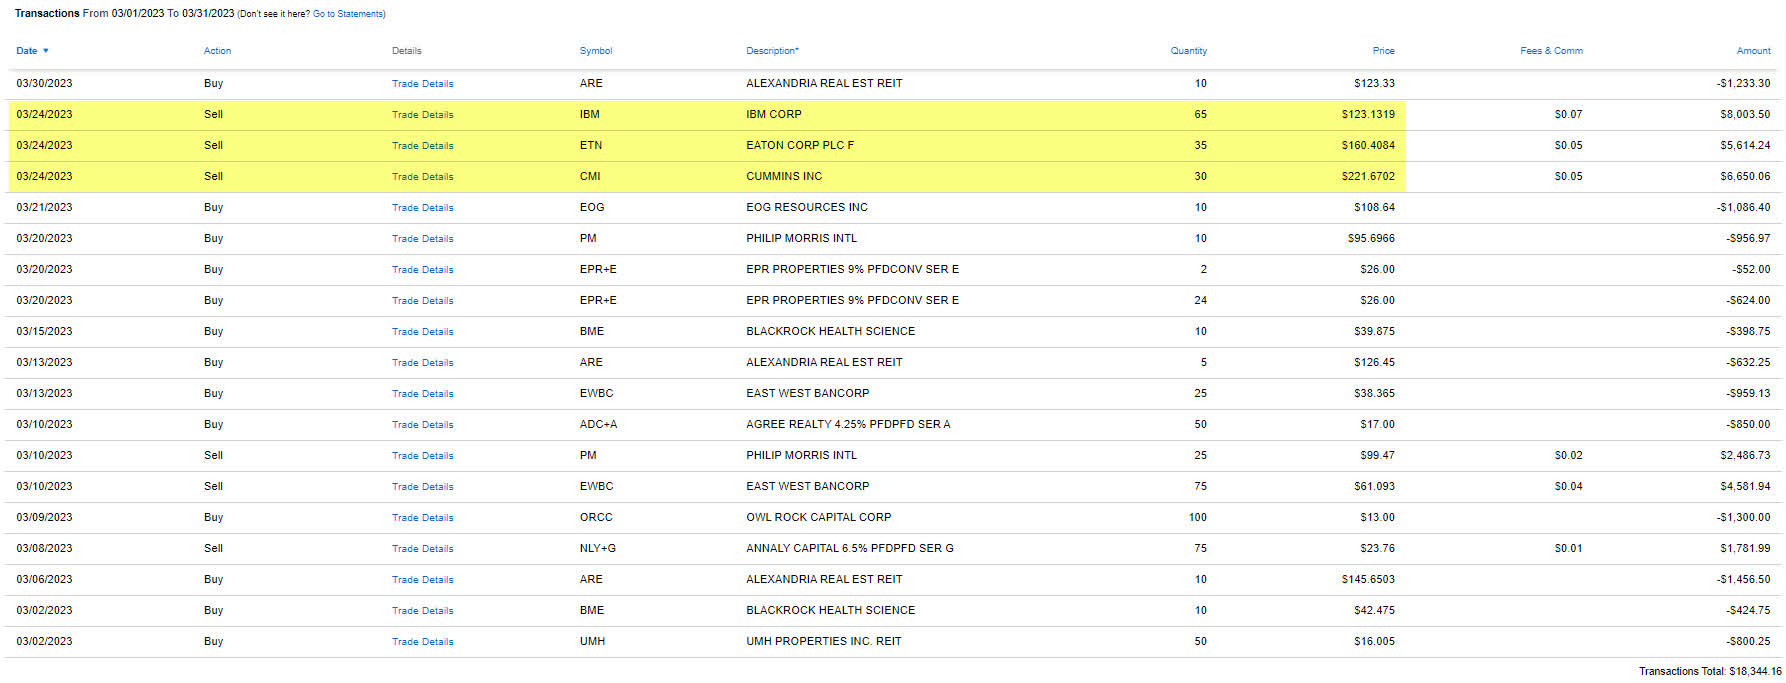
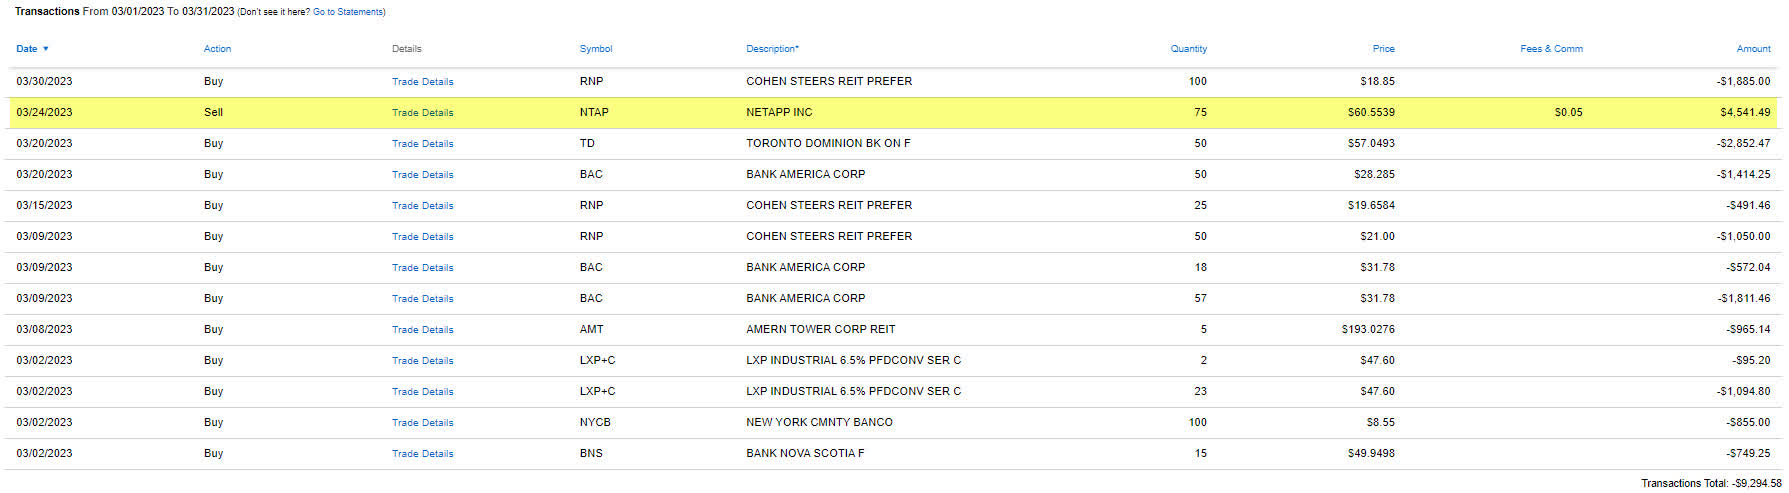
The areas highlighted in yellow on the images above represent positions that we either eliminated from the portfolio or reduced significantly.
March Income Tracker - 2022 Vs. 2023
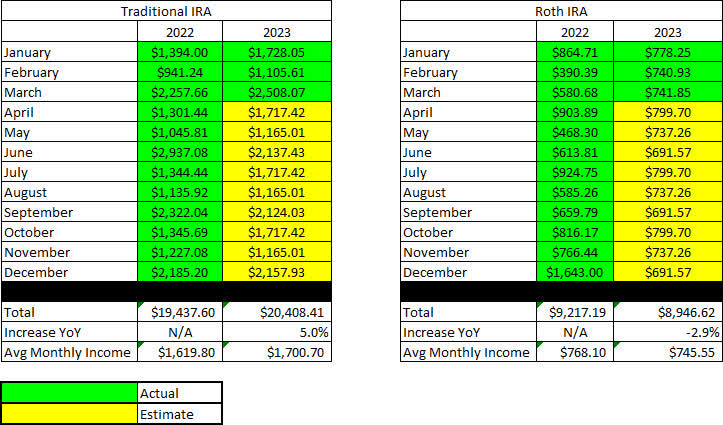
We are starting with a clean slate for 2023 and with all of the expected dividends (based on currently owned shares and announced dividend payments) the account is set for modest growth in the Traditional IRA and a slight decrease in the dividend income generated by the Roth IRA. Similar to the Taxable Account, the number of special dividend payouts in 2022 increased the yield of the portfolio at a faster pace (16.9% and 29.6% growth, respectively). While it's possible we could see more special dividends in 2023 I think it's more likely that executive management will focus on deleveraging or stock buybacks in most cases.
The Traditional IRA is expected to generate an average of $1,700.07/month of dividend income in 2023 compared to the average monthly income of $1,619.80 generated in FY-2022. The Roth IRA is expected to generate an average of $745.55/month of dividend income in 2023 compared to the average monthly income of $768.10 generated in FY-2022.
Once dividend increases are factored in and the additional interest income from CDs I expect we will see a very light increase in dividend income of 3-4%.
At this point, Jane has decided she will not be making any withdrawals from these accounts which means that the dividends will be collected as cash and potentially reinvested.
SNLH = Stocks No Longer Held - Dividends in this row represent the dividends collected on stocks that are no longer held in that portfolio. We still count the dividend income from stocks no longer held in the portfolio, even though it is non-recurring. All images below come from Consistent Dividend Investor, LLC. (also referred to as CDI as the source below).
The tables below represent which companies paid dividends in March and how that income source has changed compared to the same month of the previous year.
Traditional IRA - 2022 V 2023 - March Dividends (CDI) Roth IRA - 2022 V 2023 - March Dividends (CDI)
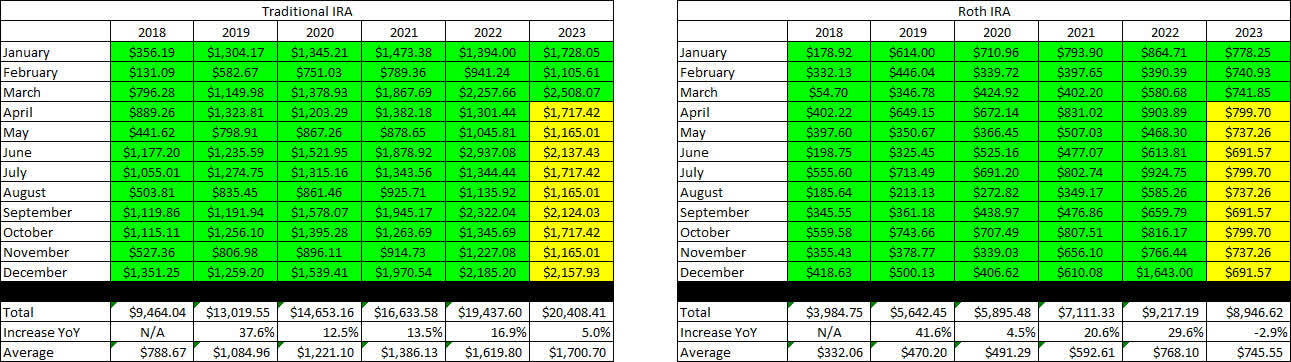
The table below represents all income generated in 2022 and collected/expected dividends in 2023.
Below gives an extended look back at the dividend income generated when I first began writing these articles. I find this table to be most useful when comparing how dividend income has improved for a specific month over the course of six years.
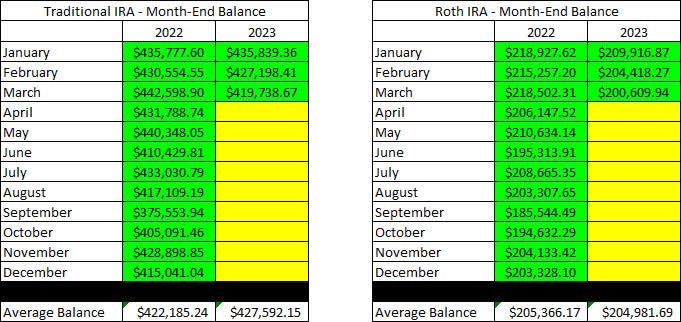
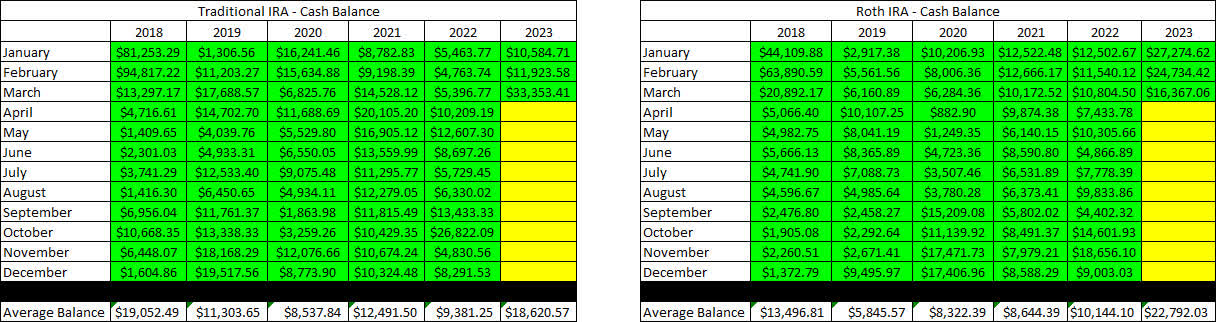
The balances below are from March 31, 2023, and all previous month's balances are taken from the end-of-month statement provided by Charles Schwab.
The next image is also pulled from the end-of-month statement provided by Charles Schwab which shows the cash balance of the account.
**Please note that cash balances may fluctuate based on CD renewal dates because I only count the cash that is 100% liquid. There were larger fluctuations in 2019 and 2020 that we the result of deposits and withdrawals being made. There will be no contributions made into either account in 2023 now that Jane is no longer working.
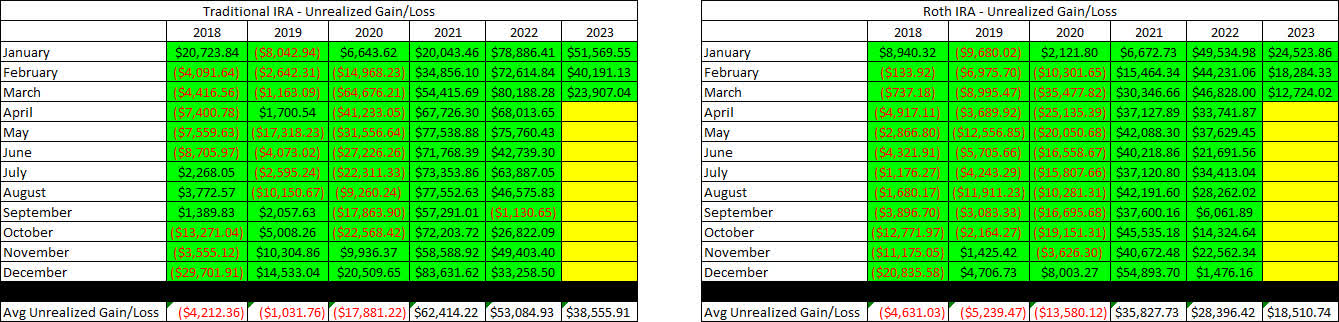
The next image provides a history of the unrealized gain/loss at the end of each month going back to the beginning of January 2018.
Retirement Projections - 2023 - March - Unrealized Gain-Loss (CDI)
I think the table above is one of the most important for readers to understand because it paints a story of volatile markets and why we employ the strategy of generating consistent cash flows to overcome the uncertainty of the market. If we were dependent on selling shares to generate income for John and Jane's retirement they would have to be much more considerate of when they withdraw and how much they choose to withdraw.
For example, a withdrawal in 2020 where shares must be sold would destroy more value by locking in losses or poor performance by stocks being sold compared to making the same withdrawal in 2021.
In an effort to be transparent about John and Jane's Taxable Account, I like to include an unrealized Gain/Loss summary. The numbers used are based on the closing prices from April 14, 2023.
Traditional IRA - 2023 - March - Gain-Loss (CDI) Roth IRA - 2023 - March - Gain-Loss (CDI)
It is worth noting in the table above that the yield column is most accurate at the start of the year but if I reduce the size of positions it may inflate the yield because it is based on how much dividend income is collected. At the same time, it may report excessively low dividends for positions added or significantly increased at the end of the year.
Conclusion
I'll end the article in the same way that I started it by saying that article was long enough and I need to get some sleep so that I can actually function at my job tomorrow. The dividend income is still growing and that has allowed us to reinvest money and build cash reserves at the same time. The biggest difference in the transactions you see is that we have sold off some of the higher-quality but low-yielding stocks that are essentially priced for perfection. These are the kind of investments that it makes sense to trim back on in favor of investing those funds into bonds, CDs, treasuries, etc.
March Articles
I have provided the links to the 2022 Year-End Review Article and March 2023 Taxable Account below.
The Retirees' Dividend Portfolio : John And Jane's March 2023 Taxable Account Update
In Jane's Traditional and Roth IRAs, she is currently long the following mentioned in this article: AbbVie ( ABBV ), Agree Realty ( ADC ), Agree Realty Preferred Series A ( ADC.PA ), Archer-Daniels-Midland ( ADM ), Broadcom ( AVGO ), Avient ( AVNT ), Bank of America ( BAC ), BlackRock Health Sciences Trust ( BME ), Bank of Nova Scotia ( BNS ), BP ( BP ), British American Tobacco ( BTI ), Canadian Imperial Bank of Commerce ( CM ), Cummins ( CMI ), Concentrix ( CNXC ), Digital Realty ( DLR ), Eaton Vance Floating-Rate Advantage Fund A ( EAFAX ), Enbridge ( ENB ), EOG Resources ( EOG ), EPR Properties Preferred Series E ( EPR.PE ), Eaton Corporation ( ETN ), East West Bancorp ( EWBC ), Essex ( ESS ), General Mills ( GIS ), GasLog Partners Preferred C ( GLOP.PC ), Honeywell ( HON ), Iron Mountain ( IRM ), Lexington Realty Preferred Series C ( LXP.PC ), Lumen Technologies ( LUMN ), LyondellBasell ( LYB ), Main Street Capital ( MAIN ), 3M ( MMM ), Altria ( MO ), NextEra Energy ( NEE ), New York Community Bank ( NYCB ), Realty Income ( O ), OGE Energy Corp. ( OGE ), Oxford Lane Capital Corp. 6.75% Cum Red Pdf Shares Series 2024 ( OXLCM ), Philip Morris ( PM ), PPG Industries ( PPG ), PIMCO Corporate & Income Opportunity Fund ( PTY ), Cohen & Steers REIT & Preferred Income Fund ( RNP ), Royal Bank of Canada ( RY ), TD SYNNEX Corp. ( SNX ), Toronto-Dominion Bank ( TD ), T Rowe Price ( TROW ), Unilever ( UL ), UMH Properties ( UMH ), Verizon ( VZ ), Williams Companies ( WMB ), W. P. Carey ( WPC ).
For further details see:
The Retiree's Dividend Portfolio, Jane's March Update: 12 Stocks Generating More Dividends