PNW - The Retiree's Dividend Portfolio: John's June Update - The Impact Of Student Loan Debt On Non-Discretionary Spending
2023-08-11 09:34:28 ET
Summary
- John's retirement accounts generated a total of $3,162.53 of dividend income for June 2023 vs. $2,513.47 of dividend income for June 2022.
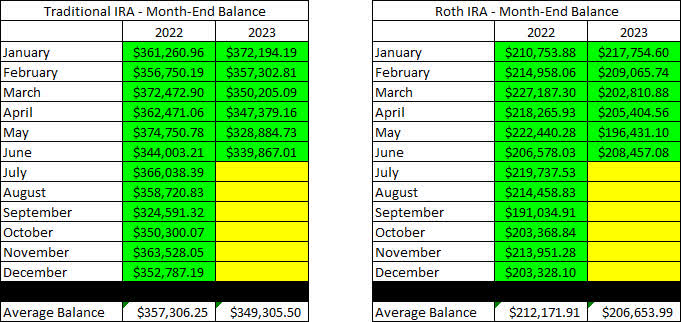
- John's Traditional IRA had a balance of $339.9K as of June 30, 2023, vs. $344K on June 30, 2022. The estimated annualized yield is 5.19%.
- John's Roth IRA had a balance of $208.5K as of June, 2023, vs. $206.6K on June 30, 2022. The estimated annualized yield is 5.16%.
- Three companies paid an increased dividend during the month of June.
While I have personally never had the displeasure of student loan debt I did inherit quite a bit when my wife and I tied the knot. At the time that worked out to be somewhere in the neighborhood of $36,000 and based on her income she was required to pay about $450/month. We chose to pay $800/month because I found the absurd rate of 6% to be worth paying down when our mortgage was at 2.75%.
Interestingly enough, she worked at a non-profit and one of the most common arguments I hear from borrowers in similar situations is that they don't need to worry about the debt because their employment makes them eligible for student loan forgiveness after 10 years at a non-profit. I always exercise a level of skepticism towards this because a lot of it depends on specifics like working in lower-income areas or in locations like Barrow Alaska (the furthest city north in the United States) which have challenges attracting interested job-seekers.
Now, let's assume that student loan forgiveness was this easy and was completely true. It made me curious as to whether or not someone did the math before assuming forgiveness would be to their benefit because most of these programs still require you to make minimum income-driven monthly payments. With that in mind, the government dictated that my wife owed $450/month and that she would need to pay those minimums (and I am not even factoring in the increases that would likely arise as her income grew) for at least 10 years.
- With 8 years remaining that works out to be a total of $43,200 by making the minimums. This also assumes that she stayed employed with a non-profit (for the record she left that employer only months after we went through this exercise for a better career opportunity). This would have come at a cost of over $10K of interest paid during this time.
- At the interest rate of 6%, she would have still had something like $2K (estimating from the loan amortization calculator) of principal left to pay that would ultimately be forgiven.
- If we continued to pay $800/month it would have been paid in full after 51 months and would have had an interest cost of less than $5K.
Ultimately, when we sold our previous house, we took the proceeds, and we cleared this debt. Between the issues of working in the non-profit sector and how much would actually be forgiven, we saw the cost/benefit as relatively straightforward.
So what does this have to do with my retirement articles?
We currently have a personal finance crisis in this country that includes record rates of consumer credit card debt, average new car payments in excess of $700/month, climbing mortgage rates, and we have all seen bills for everyday goods like groceries hit by inflation. The average American has little to no safety net built into their budget which is why any increases in living expenses can become very concerning since the potential of student loan payments, which most borrowers haven't considered since pre-COVID, could see as the straw that broke the camel's back.
This means that some stocks are going to be in trouble more than others, so the question is, which stocks should we be concerned about? There is no formula or specific sector that we can simply exclude altogether but we can draw some conclusions about the following:
- Non-essential products/services
- Housing (in particular apartment rents)
- Auto Loans
I wanted to look at some of the stocks held in John and Jane's portfolio that could be impacted.
Non-essential products and services could impact:
This is one reason why we cut the position in LOW by half recently. The stock price has jumped recently as the Q1-2023 earnings report showed strong earnings beat but a significant decrease in revenue. Management noted that the FY-2023 revenue would likely be down 2-4% and FY-2023 earnings guidance was cut down to $13.20-$13.60 per share compared to prior guidance of $13.60-14.00 per share.
EPR holds properties like Top Golf, ski resorts, and other experiential real estate which typically carry an expensive price tag. This would suggest consumers that are feeling the pinch would choose to cut back on these expenditures of expenditures since the activity itself is not necessary.
To be very clear, I like both LOW and EPR and plan to continue holding shares but the argument I am making is that student loan debt payments resuming is enough for me to at least say that I don't think LOW stock should be trading near its record high. With borrowers already struggling to pay higher car payments, credit cards, and even increased insurance costs/property taxes there are too many factors going against LOW's stock trading at all-time highs. To top it all off the dividend yield is less than 2% there just isn't a compelling reason in my opinion that John and Jane should maintain heavy exposure to the stock until there is a more compelling yield and opportunity for capital appreciation.
Now I am applying this lens when viewing the other holdings to better understand how much exposure exists in John and Jane's portfolio to something like student loan payments.
Background
For those interested in John and Jane's full background, you can find at least three articles a month published for the last five years detailing the performance of their portfolio. I have continued to evolve the report over time by adding and removing information/images to make the updates more useful to the average investor. Here are the key details that should be understood when reading these updates.
- This is a real portfolio with actual shares being traded. This is not a practice portfolio which is why I include screenshots from Charles Schwab to document every change that is made.
- I am not a financial advisor and merely provide guidance based on a relationship that goes back several years.
- John retired in January 2018 and has collected Social Security income as his regular source of income. John also currently withdraws $1,000/month from his Traditional IRA.
- Jane retired at the beginning of 2021 and decided to begin collecting Social Security early and has not made any withdrawals from her retirement accounts yet.
- John and Jane began drawing funds from the Taxable Account in 2022 at $1,000/month. After speaking with them this amount has been increased to $1,700/month. This withdrawal is still covered entirely by dividend and interest income.
- John and Jane have other investments outside of what I manage. These investments primarily consist of minimal-risk bonds and low-yield certificates.
- John and Jane have no debt or monthly payments other than basic recurring bills such as water, power, property taxes, etc.
The reason why I started helping John and Jane with their retirement accounts is that I was infuriated by the fees they were being charged by their previous financial advisor. I do not charge John and Jane for anything that I do .
The only request I have made of John and Jane is that they allow me to publish their portfolio anonymously because I want to help as many people as I can while holding myself accountable and improving my thought process.
I started this series to address issues I have had when reading other authors with similar types of updates (I am not saying they are wrong, but I found myself questioning their actual performance because they never provided enough information to cover loose ends).
Here is My Promise to Readers:
- I aim to give as much information as needed so readers can feel confident that what I do is real.
- Even if you agree the results are real this does not mean I expect you to agree with me and I will always answer constructive criticism whenever possible. I will respond with the same genuine intent that the question was asked with.
- I am very transparent about the portfolio and consistency is a significant goal of mine. All of my data points (unless noted otherwise) are derived from month-end statements from Charles Schwab. Even when things aren't looking great (Spring 2020 for example) you will know because I provide enough information that it would be impossible for me to manipulate.
- This article is not intended to be advice or a call to action and is for informational purposes only (I am not a financial advisor and I don't claim to be one). My goal is to challenge conventional thinking and empower you to take control of your investments (if that's something you want to do).
Generating a stable and growing dividend income with an emphasis on capital preservation has become the primary focus of this portfolio. I am least concerned about capital appreciation which is why the decisions made will seem pretty conservative most of the time. I may measure the performance of the portfolio relative to indexes and ETFs but the key metric I am focused on is delivering a more stable source of cash flow to John and Jane over time that allows them to live a comfortable retirement that includes minimal stress related to finances.
Dividend Decreases
No companies in John's Traditional and Roth IRA accounts eliminated or reduced their dividend during the month of June.
Dividend Increases
Three companies paid increased dividends/distributions or a special dividend during the month of June.
MAIN was covered in Jane's Retirement account update. I will only include information about the dividend increases associated with these. Those interested in reading the summary MAIN can check the links at the end of the article.
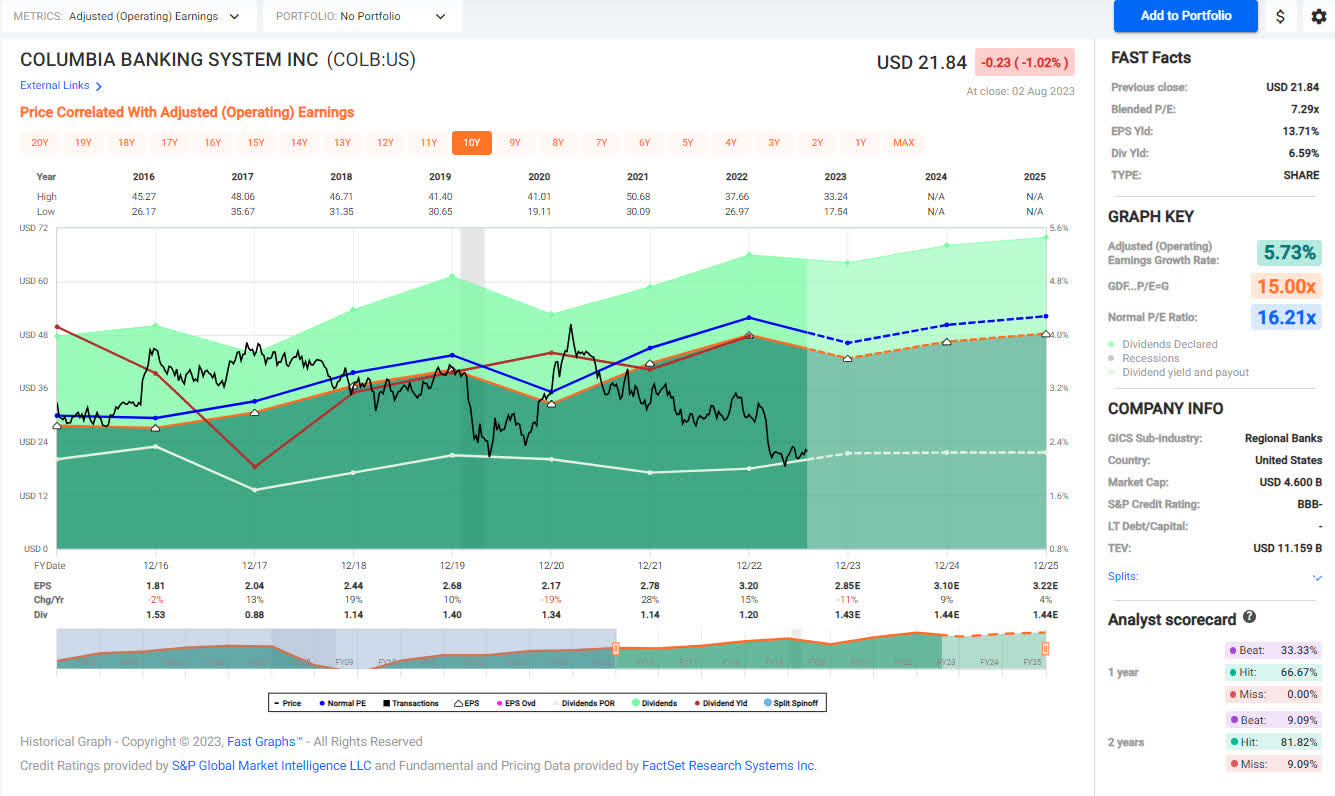
Columbia Banking System - When Columbia Bank and Umpqua (UMPQ) merged it made sense to take banks with two different focuses and bring them together. Columbia Bank was always known for its business lending prowess and Umpqua had a robust mortgage lending portfolio (I worked at Umpqua as a Secondary Market Analyst hedging the mortgage portfolio and selling mortgage-backed securities for 2.5 years). The dividend increase is a sign to me that the combined entity is on track to reach the cost synergies that were projected from the merger.
Nearly every aspect of the balance sheet has improved as a result of the merger, so I do believe that the long-term safety of remaining invested in COLB makes sense. The stock is currently priced at ultimate pessimism, recently trading at a multiple that is less than it was during the initial stages of COVID in 2020. We will likely commit some additional funds to this position because of the potential benefit from capital gains and the compelling dividend yield.
COLB - FastGraphs 6-2023 (FastGraphs)
The dividend was increased from $.30/share per quarter to $.36/share per quarter. This represents an increase of 20% and a new full-year payout of $1.44/share compared with the previous $1.20/ share. This results in a current yield of 6.53% based on the current share price of $21.84.
Main Street Capital - A supplemental dividend of $.225/share was issued during the month of June.
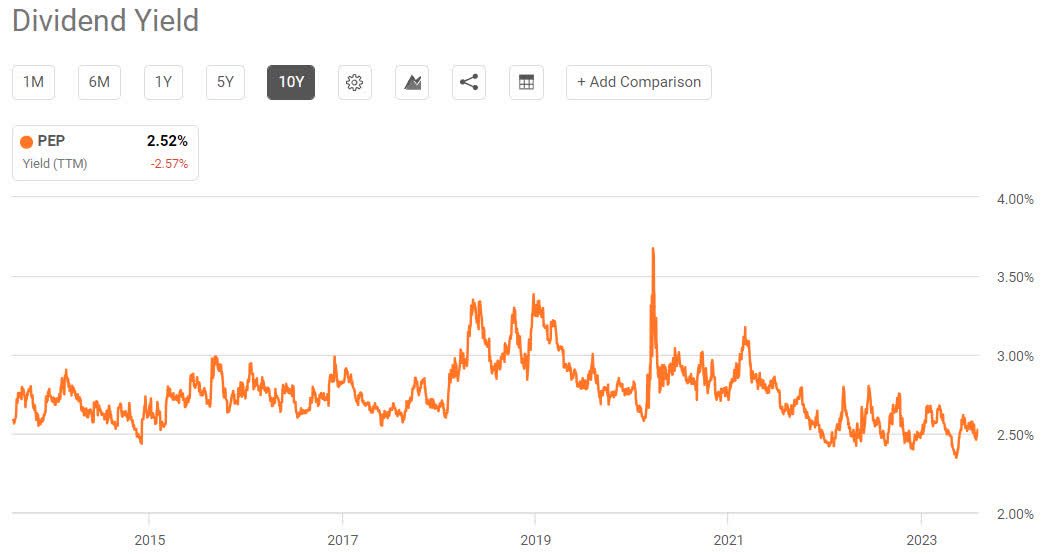
Pepsi - I think Pepsi is a great company that has made a lot of efficiency improvements over the last few years and John has seen the value of his positions increase significantly during this time. One metric I like to use for PEP is the dividend yield to help determine how attractively (or unattractively) the stock is currently priced. The dividend yield is currently sitting at a 10-year low which suggests that the stock price is likely to plateau in the best-case scenario.
This is where I ask the question, should we keep a full position invested or does it make more sense to invest the proceeds in stable certificates that will protect the capital while also returning a yield that is more than double the current dividend yield.
These negatives aside, long-term dividend growth investors should take comfort in the recent 10% dividend increase which is higher than the 10-year average increase of 8%. The 50-year history of consecutive dividend increases is also a compelling reason to hold shares over the long run. As for John's portfolio, we have no problem reducing the size of the position and putting funds in a safer instrument that generates more income.
The dividend was increased from $1.15/share per quarter to $1.265/share per quarter. This represents an increase of 10% and a new full-year payout of $5.06/share compared with the previous $4.60/ share. This results in a current yield of 2.69% based on the current share price of $187.12.
Retirement Account Positions
There are currently 37 different positions in John's Traditional IRA and 23 different positions in John's Roth IRA. While this may seem like a lot, it is important to remember that many of these stocks cross over in both accounts and are also held in the Taxable Portfolio.
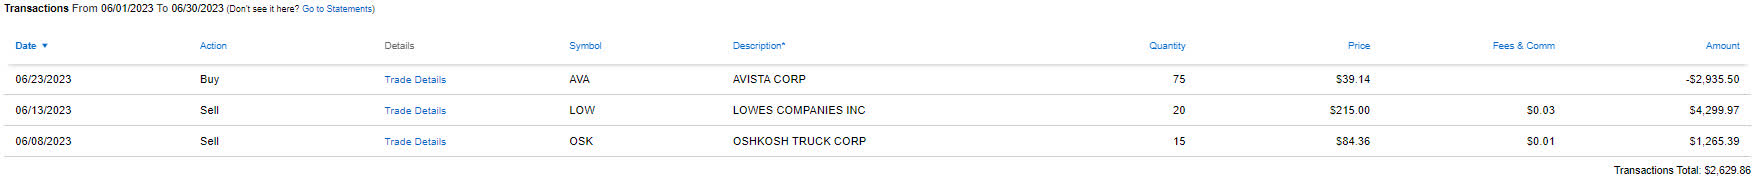
Below is a list of the trades that took place in the Traditional IRA during the month of June.
Traditional IRA - June 2023 Trades (Charles Schwab)
Below is a list of the trades that took place in the Roth IRA during the month of June.
Roth IRA - June 2023 Trades (Charles Schwab)
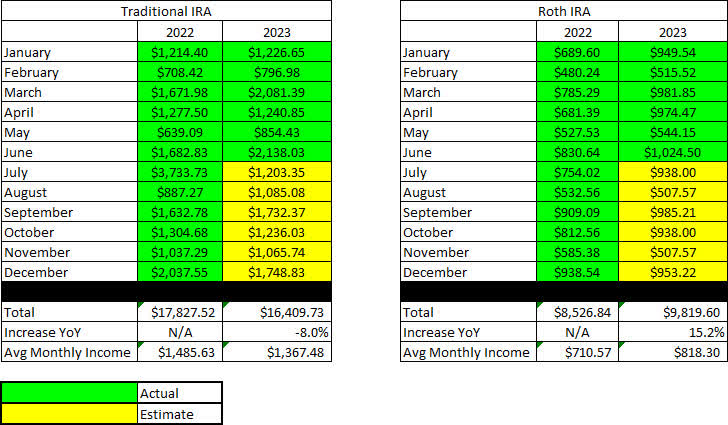
June Income Tracker - 2022 Vs. 2023
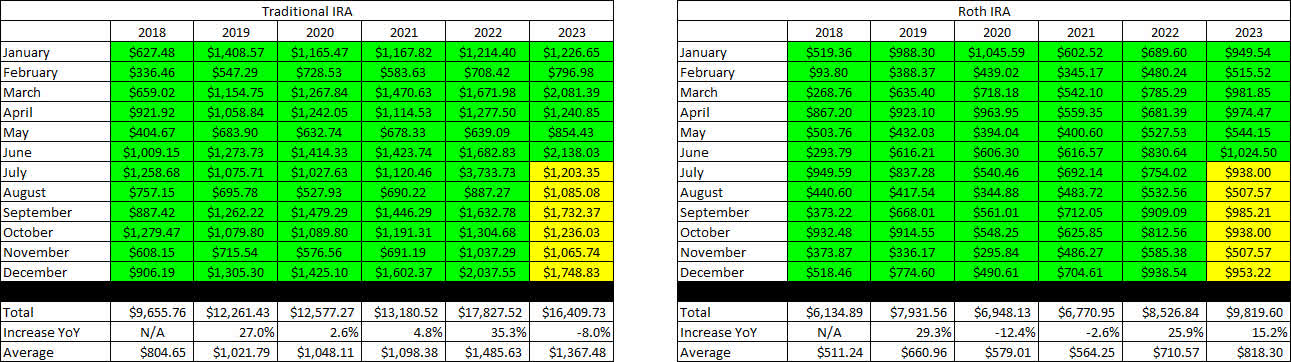
2023 dividend income performance was mixed with John's accounts set for a large decrease in the dividend income generated by the Traditional IRA and a large increase in the dividend income generated by the Roth IRA. The reason for the large decrease in the Traditional IRA was due to the special dividend paid by Healthcare Trust of America (HTA) when it was acquired by Healthcare Realty ( HR ) - This can also be seen in the huge growth in 2022 dividends which came in at a whopping 35.3%. If this dividend is removed then the growth year-over-year is trending as flat overall. While it's possible we could see more special dividends in 2023 I think it's more likely that management will focus on deleveraging or stock buybacks in most cases.
The Traditional IRA is expected to generate an average of $1,367.48/month of dividend income in 2023 compared to the average monthly income of $1,485.63 generated in FY-2022. The Roth IRA is expected to generate an average of $818.30/month of dividend income in 2023 compared to the average monthly income of $710.57 generated in FY-2022.
Once dividend increases are factored in and the additional interest income from CDs and SWVXX I expect we will see a very light increase in dividend income of 3-4%. (In this assumption I am also factoring out the large special dividend from the HTA acquisition but if I leave that in then I estimate we will see an overall negative combined dividend yield growth of 1-2%.)
John plans to continue collecting $1,000/month from his Traditional IRA which matches the amount he withdrew monthly in 2022.
SNLH = Stocks No Longer Held - Dividends in this row represent the dividends collected on stocks that are no longer held in that portfolio. We still count the dividend income from stocks no longer held in the portfolio, even though it is non-recurring. All images below come from Consistent Dividend Investor, LLC. (also referred to as CDI as the source below).
The tables below represent which companies paid dividends in June 2023 and how that income source has changed since June of the previous year.
Traditional IRA - June - 2022 V 2023 Dividend Breakdown (CDI) Roth IRA - June - 2022 V 2023 Dividend Breakdown (CDI)
The table below represents all income generated in 2022 and collected/expected dividends in 2023.
Retirement Projections - June 2023 (CDI)
Below gives an extended look back at the dividend income generated when I first began writing these articles. I find this table to be most useful when comparing how dividend income has improved for a specific month over the course of six years.
Retirement Projections - June 2023 - Full Dividend History (CDI)
The balances below are from June 30, 2023, and all previous month's balances are taken from the end-of-month statement provided by Charles Schwab.
Retirement Account - Month End Balances - June 2023 (CDI)
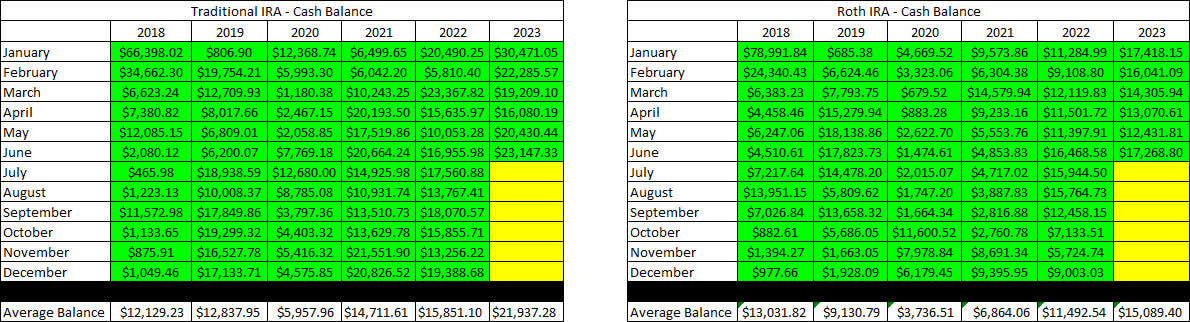
The next image is also pulled from the end-of-month statement provided by Charles Schwab which shows the cash balance of the account.
**Please note that cash balances may fluctuate based on CD renewal dates and the use of Schwab Value Advantage Money Fund ( SWVXX ) because I only count the cash that is 100% liquid. There were larger fluctuations in 2019 and 2020 that we the result of deposits and withdrawals being made. There will be no contributions made into either account in 2023 because John is no longer working.
Retirement Accounts - June 2023 - Cash Balances (CDI)
The next image provides a history of the unrealized gain/loss at the end of each month going back to the beginning of January 2018.
Retirement Accounts - June 2023 - Unrealized Gain-Loss (CDI)
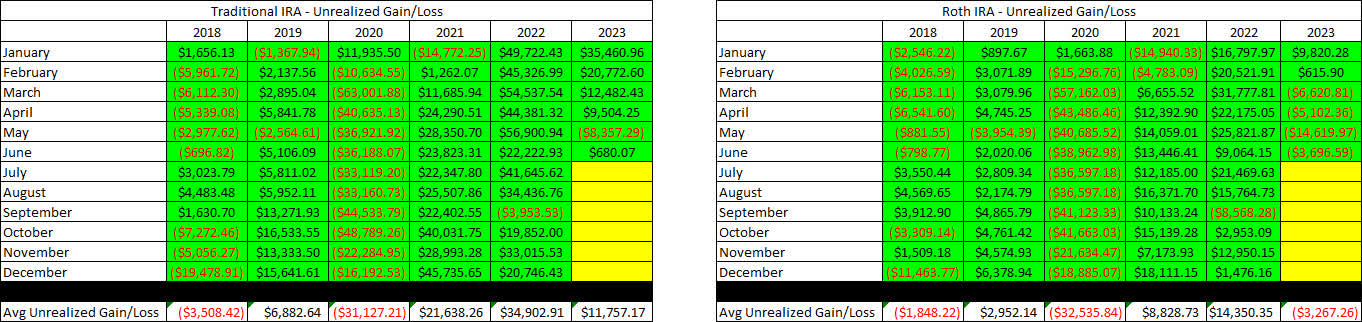
I think the table above is one of the most important for readers to understand because it paints a story of volatile markets and why we employ the strategy of generating consistent cash flows to overcome the uncertainty of the market. If we were dependent on selling shares to generate income for John and Jane's retirement they would have to be much more considerate of when they withdraw and how much they choose to withdraw.
For example, a withdrawal in 2020 where shares must be sold would destroy more value by locking in losses or poor performance by stocks being sold compared to selling the same shares and withdrawing funds in 2021.
In an effort to be transparent about John's Account, I would like to include an unrealized Gain/Loss summary. The numbers used are based on the closing prices from July 21, 2023. Normally this would be more recent but I decided to allow my week of vacation to include not working on articles whatsoever.
Traditional IRA - June 2023 - Gain-Loss (CDI) Roth IRA - June 2023 - Gain-Loss (CDI)
It is worth noting in the table above that the yield column is most accurate at the start of the year, but if I reduce the size of positions it may inflate the yield because it is based on how much dividend income is collected. At the same time, it may report excessively low dividends for positions added or significantly increased at the end of the year.
The last image represents the withdrawals being made from John's Traditional IRA, as this is the only account he is currently withdrawing funds from. As mentioned before, he continues to withdraw $1,000/month.
Traditional IRA Withdrawals - June 2023 (CDI)
Conclusion
The July article will begin painting a much clearer picture of the change in strategy where we are reducing or even eliminating some positions in favor of low-risk/zero-risk investments. The cash holdings including money markets and CD's have grown substantially through the sale of holdings that are in many cases near the 52-week-high which means that there really isn't much of an upside to realize (which also means a reversion to a lower price is more likely).
PEP from the article is a great example with the share price at a record-high and a dividend yield of 2.69% (and that's after the most recent dividend increase) the stock price doesn't really have any catalysts that would push it higher so we trimmed the position in favor of some brokered CD's/Money Market funds that are generating almost twice the yield with practically no volatility.
In John's Traditional and Roth IRAs, he is currently long the following mentioned in this article: AFC Gamma ( AFCG ), Aflac ( AFL ), Apple Hospitality REIT ( APLE ), Avista ( AVA ), BP p.l.c. ( BP ), Brixmor Property Group ( BRX ), Crown Castle ( CCI ), Canadian Utilities ( CDUAF ), Chatham Lodging Trust ( CLDT ), Columbia Banking System ((COLB)), Chevron ( CVX ), CSX ( CSX ), Dominion Energy ( D ), Deere ( DE ), Digital Realty Preferred Series J ( DLR.PJ ), Duke Energy ( DUK ), Eaton Vance Floating-Rate Advantage Fund ( EAFAX ), EPR Properties ( EPR ), EPR Properties Preferred Series G ( EPR.PG ), Healthcare Realty ((HR)), Intercontinental Exchange ( ICE ), Iron Mountain ( IRM ), Kinder Morgan ( KMI ), Kite Realty Group ( KRG ), Lowe's ((LOW)), Main Street Capital ((MAIN)), Altria ( MO ), New Residential Investment Corp. Preferred Series B (NRZ.PB), Realty Income ( O ), Oshkosh ( OSK ), Occidental Petroleum Corp. ( OXY ), Bank OZK ( OZK ), Bank OZK Preferred Series A ( OZKAP ), PacWest Bancorp ( PACW ), PepsiCo ((PEP)), iShares Preferred and Income Securities ETF ( PFF ), VanEck Vectors Preferred Securities ex Financials ETF ( PFXF ), Pinnacle West ( PNW ), PIMCO Income Fund Class A ( PONAX ), Nuveen Nasdaq 100 Dynamic Overwrite Fund ( QQQX ), Global X Funds Nasdaq 100 Covered Call ETF ( QYLD ), STAG Industrial ( STAG ), Sun Communities ( SUI ), Southwest Gas ( SWX ), AT&T ( T ), Toronto-Dominion Bank ( TD ), Truist Financial ( TFC ), T. Rowe Price ( TROW ), Cohen&Steers Infrastructure Fund ( UTF ), Valero ( VLO ), Ventas ( VTR ), WestRock ( WRK ), and W. P. Carey ( WPC ).
Editor's Note: This article discusses one or more securities that do not trade on a major U.S. exchange. Please be aware of the risks associated with these stocks.
For further details see:
The Retiree's Dividend Portfolio: John's June Update - The Impact Of Student Loan Debt On Non-Discretionary Spending