WASH - The Retirees' Dividend Portfolio: John And Jane's April 2023 Taxable Account Update
2023-05-06 09:00:00 ET
Summary
- The Taxable Account generated $1,760.46 of dividend income for April 2023 compared with $1,609.40 of dividend income for April 2022.
- The Taxable Account had a balance of $523.4K as of April 30, 2023, vs. $522.7K on April 30, 2022. The annualized cost basis yield is 5.38%.
- Three companies in the Taxable portfolio paid increased dividends or paid a special dividend during the month of April.
- The Taxable Account had a cash balance of $19.9K as of April 30, 2023, vs. $27.5K as of April 30, 2022. The 2023 cash balance does not include $20K of funds held in brokered CDs.
- The Taxable Account had an unrealized gain/loss of $99.5K as of April 30, 2023, vs. $106.7K as of April 30, 2022.
As we start the month of May, I remember an old mantra that comes up every year: "Sell in May and go away". I found the educational article 'Sell In May And Go Away' by Kent Thune to be a thorough discussion of how this idea became mainstream.
A summary of the concept is simple, the stock market performance from December to May is consistently (but not always) stronger than the performance from June through November. Investors who set their money aside are likely to see more opportunities to generate better returns by putting their money back to work at the start of the winter season.
Now, my job isn't to predict what will happen in the next six months but rather to look at where the market is today and determine what level of safety my retirees John and Jane need to consider in their portfolios. Looking at the three indexes, with a heavy emphasis on the DJIA and S&P 500, it is interesting to see how the index average is back to 52-week-highs and that is an indicator that taking some chips off the table makes sense.
The big reason why I am wanting to pull back on certain positions is that the business/economic environment is very unstable in my opinion and the recent positivity around earnings reports is something I have very little confidence in. In my recent article, The Retirees Guide To An Upcoming Recession , I outline a number of factors that have me concerned about the underlying health of the metrics that are commonly talked about by media, politicians, etc.
For this reason, we are looking to reduce exposure to certain positions with the primary focus being on the reduction of our high-flyers (stocks with a high price and lower dividend yield than the historical average) but I have to be conscientious of the fact that selling shares with a lot of taxable gains is something that could have an adverse impact on John and Jane's taxes and for higher income retirees could even have an impact on what is taken from their social security income.
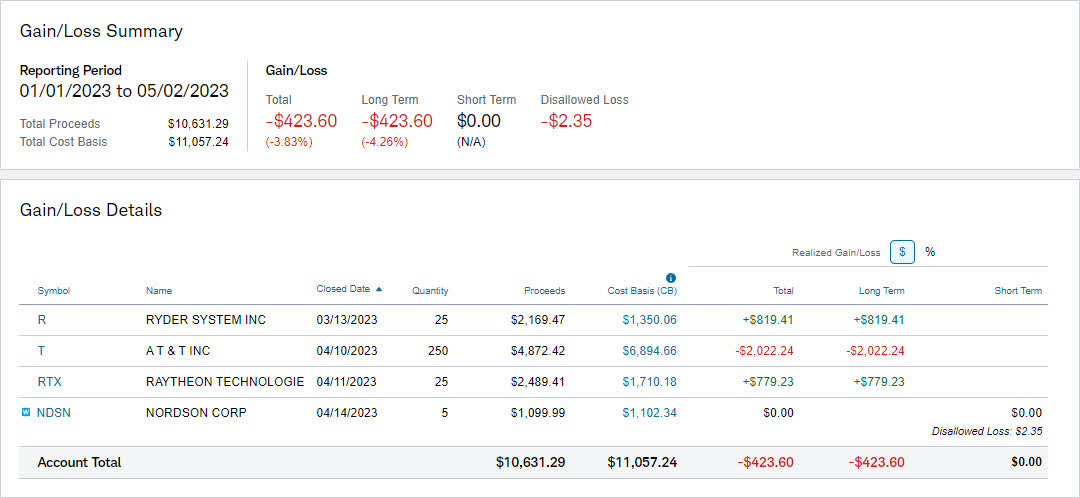
The main way to handle this is to sell shares of a stock that is currently sitting at a loss because this helps to offset those gains and reduce the taxable liability. Recently we have sold a few shares that demonstrate how this offset works nicely because John and Jane were sitting on a sizeable gain when it became apparent that it was the right time to cut the size of the AT&T ( T ) position. We sold over half of the position at $19.49/share and the stock price is now $17.50/share 20 days later.
As usual, we made sure to sell shares that were the highest cost shares which are how we continue to move our costs basis to a more reasonable level and ensure that we maximize the loss to offset the most gain from the sale of other stocks.
These recent sales have allowed John and Jane to increase the cash-on-hand and allow for the purchase of other investments or to add more CDs to generate safe and stable income. Although we have no plan of selling everything in May, I do think it's prudent to use the opportunity to cut back and build up cash reserves which will likely have minimal impact on the dividend income generated and certainly be less than the current amount withdrawn by John and Jane of $1,700/month.
I am also looking for other tax-advantaged options like diversified short-term bonds/treasuries so any suggestions for me to research further would be greatly appreciated.
Background
For those interested in John and Jane's full background, you can find at least three articles a month published for the last five years detailing the performance of their portfolio. I have continued to evolve the report over time by adding and removing information/images to make the updates more useful to the average investor. Here are the key details that should be understood when reading these updates.
- This is a real portfolio with actual shares being traded. This is not a practice portfolio which is why I include screenshots from Charles Schwab to document every change that is made.
- I am not a financial advisor and merely provide guidance based on a relationship that goes back several years.
- John retired in January 2018 and has collected Social Security income as his regular source of income. John also currently withdraws $1,000/month from his Traditional IRA.
- Jane retired at the beginning of 2021 and decided to begin collecting Social Security early and has not made any withdrawals from her retirement accounts yet.
- John and Jane began drawing funds from the Taxable Account in 2022 at $1,000/month. After speaking with them this amount has been increased to $1,700/month. This withdrawal is still covered entirely by dividend and interest income.
- John and Jane have other investments outside of what I manage. These investments primarily consist of minimal-risk bonds and low-yield certificates.
- John and Jane have no debt or monthly payments other than basic recurring bills such as water, power, property taxes, etc.
The reason why I started helping John and Jane with their retirement accounts is that I was infuriated by the fees they were being charged by their previous financial advisor. I do not charge John and Jane for anything that I do .
The only request I have made of John and Jane is that they allow me to publish their portfolio anonymously because I want to help as many people as I can while holding myself accountable and improving my thought process.
I started this series to address issues I have had when reading other authors with similar types of updates (I am not saying they are wrong, but I found myself questioning their actual performance because they never provided enough information to cover loose ends).
Here is my promise to readers:
- I aim to give as much information as needed so readers can feel confident that what I do is real.
- Even if you agree the results are real this does not mean I expect you to agree with me and I will always answer constructive criticism whenever possible. I will respond with the same genuine intent that the question was asked with.
- I am very transparent about the portfolio and consistency is a significant goal of mine. All of my data points (unless noted otherwise) are derived from month-end statements from Charles Schwab. Even when things aren't looking great (Spring 2020 for example) you will know because I provide enough information that it would be impossible for me to manipulate.
- This article is not intended to be advice or a call to action and is for informational purposes only (I am not a financial advisor, and I don't claim to be one). My goal is to challenge conventional thinking and empower you to take control of your investments (if that's something you want to do).
While many authors require paid subscriptions to see their portfolio, I do not want to go that route and will continue to publish this series for free as long as there is enough interest to make it worth my time (and I spend A LOT of time on these articles).
Generating a stable and growing dividend income with an emphasis on capital preservation has become the primary focus of this portfolio. I am least concerned about capital appreciation which is why the decisions made will seem pretty conservative most of the time. I may measure the performance of the portfolio relative to indexes and ETFs but the key metric I am focused on is delivering a more stable source of cash flow to John and Jane over time that allows them to live a comfortable retirement that includes minimal stress related to finances.
Dividend Increases
Three companies paid increased dividends/distributions or a special dividend during the month of April.
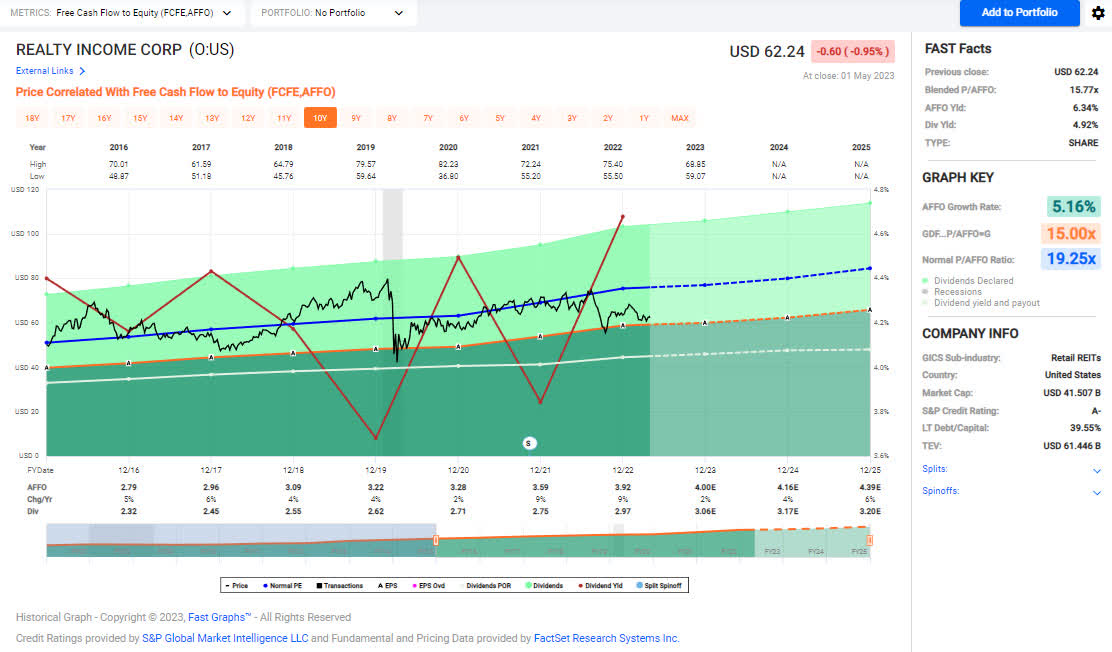
Realty Income - The month of March is when its annual (larger increase) happens so this month is back to the normal smaller quarterly increases. The stock is currently at a price that is neither attractive nor terrible and the main driver for this is a current dividend yield that is comparable to other investments that are much safer and offer better price stability. At this point, I would be surprised to see more upside from the stock price and honestly think slowing returns and higher rates are likely to push the stock price lower if anything.
In the March update, I mentioned that $60/share is a worthwhile entry point but given the lower-risk options that exist, I would look to get in at a lower point.
The dividend was increased from $.2545/share per month to $.2550/share per month. This represents an increase of .2% and a new full-year payout of $3.06/share compared with the previous $3.054/ share. This results in a current yield of 4.87% based on the current share price of $62.24.
Schlumberger - At the beginning of COVID SLB was forced to slash its dividend by 75% from $.50/share per quarter down to $.125/share per quarter. Over the last two years, SLB has committed to building up its dividend with two 40%+ increases but the most impressive turnaround during this time was in the stock price. SLB's current recent earnings now show a dividend that is well-covered and generates a significant amount of free cash flow.
With interest rates increasing I like that SLB has committed its focus towards reducing its debt levels which have dropped from $17.6 billion to $12.8 billion. The improvement over such a short window is impressive especially when we consider the weakness of the oil industry during and after COVID.
Investors should really wait for a sizeable pullback before considering shares of SLB and I attribute this to the recent impact on natural gas prices. My interest in adding shares would definitely increase if shares reach the $40/share range.
The dividend was increased from $.17/share per quarter to $.25/share per quarter. This represents an increase of 42.9% and a new full-year payout of $1.00/share compared with the previous $.68/ share. This results in a current yield of 2.21% based on the current share price of $45.07.
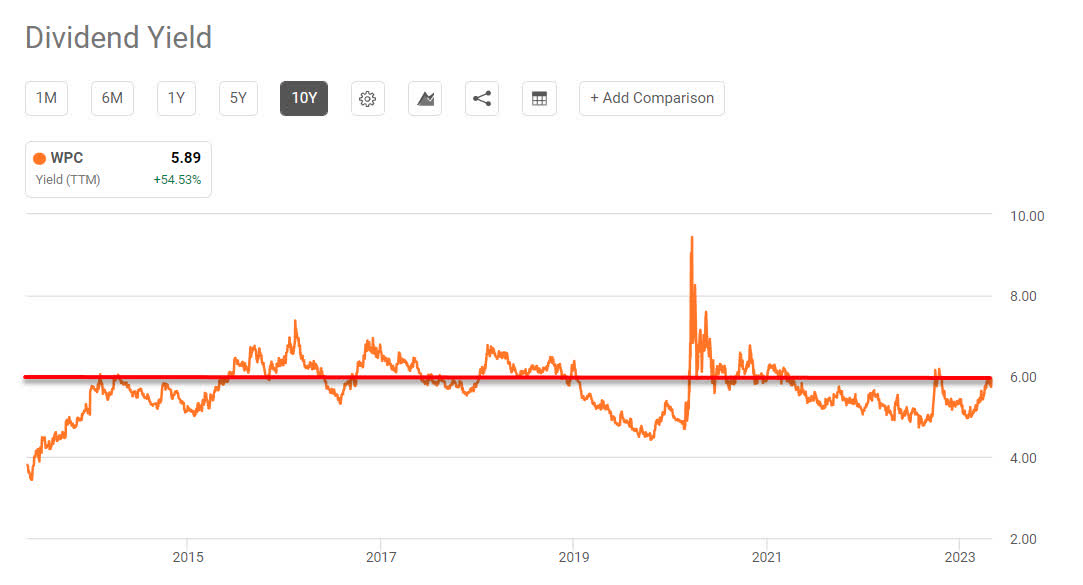
W. P. Carey - We recently purchased a small block of shares of WPC as the current yield offered closes in on 6% which has been a compelling purchase point over the last decade. The yield of 6% is something that has actually been more difficult to come by as WPC's earnings announcements continue to indicate positive trends that have led to recent record-high share prices.
For years WPC has paid a compelling dividend but the lack of FFO growth was something that meant the dividend increases would be minimal at best. The current 5-year CAGR for WPC comes in at an embarrassing 1.08% which is a staggering difference between the 10-year CAGR of 7.64%. This indicates that the company was paying a compelling yield but not growing it due to unsafe payout ratios. WPC's earnings have made it apparent that there is a widening gap between the growth of funds from operations and the dividend which is a recipe for a healthier payout ratio and eventually more meaningful dividend increases.
We think WPC is a reasonable buy at current levels and would be considered a very strong buy in the upper $60/share range.
The dividend was increased from $1.065/share per quarter to $1.067/share per quarter. This represents an increase of .2% and a new full-year payout of $4.26/share compared with the previous $4.268/ share. This results in a current yield of 5.96% based on the current share price of $72.21.
Positions
The Taxable Account currently consists of 43 unique positions (44 if you count the brokered certificate) at market close on May 2, 2023. There were three sales during the middle of the month and three purchases that took place at the end of the month.
April Income Tracker - 2022 Vs. 2023
The Taxable Account is expected to generate an average of $1,793.70/month of dividend income in 2023 compared to the average monthly income of $1,792.62 generated in FY-2022. Once dividend increases are factored in and the additional interest income from CDs I expect we will see a very light increase in dividend income of 3-4% for FY-2023.
2022 also represented the first year of major withdrawals from the Taxable Account with no new funds flowing into it. The withdrawals John and Jane made were set at $1,000/month for a total of $12,000 withdrawn. After speaking with me they have decided to increase this amount to $1,700/month or a total of $20,400/year. The main reason for increasing the withdrawals from the Taxable Account is that they are taxed whether they take the money or not. This means I will need to be even more conscientious about capital deployment because I will have very limited excess funds to reinvest.
Another reason for increasing this is that I have had to talk to John and Jane about making sure they are actually spending some of their money, especially when it comes to purchasing items that they may not be able to utilize in the future such as E-Bikes since their ability to use them depends on their physical and mental health.
SNLH = Stocks No Longer Held - Dividends in this row represent the dividends collected on stocks that are no longer held in that portfolio. We still count the dividend income from stocks no longer held in the portfolio, even though it is non-recurring. All images below come from Consistent Dividend Investor, LLC. (also referred to as CDI as the source below).
The tables below represent which companies paid dividends in April and how that income source has changed relative to the same month last year.
2023 - April - Taxable Dividend Breakdown (CDI)
*The income category in the image above represents the certificate of deposit income.
The table below represents all income generated in 2022 and collected/expected dividends in 2023.
2023 - April - Taxable Annual Estimate (CDI)
Below gives an extended look back at the dividend income generated when I first began writing these articles. I find this table to be most useful when comparing how dividend income has improved for a specific month over the course of six years.
The Taxable Account balances below are from April 30, 2023, and all previous month balances are taken from the end-of-month statement provided by Charles Schwab.
2023 - April - Taxable Month End Balance (CDI)
The next image is also pulled from the end-of-month statement provided by Charles Schwab which shows the cash balance of the account.
**Please note that cash balances may fluctuate based on CD renewal dates because I only count the cash that is 100% liquid. There were larger fluctuations in 2019 and 2020 that we the result of deposits and withdrawals being made. The Taxable Account has not had a deposit put into it since early 2020 but funds have been used for Traditional/Roth IRA Contributions and for withdrawals in 2022 and will be increasing in 2023.
2023 - April - Taxable Cash Balance (CDI)
The next image provides a history of the unrealized gain/loss at the end of each month going back to the beginning of January 2018.
I think the table above is one of the most important for readers to understand because it paints a story of volatile markets and why we employ the strategy of generating consistent cash flows to overcome the uncertainty of the market. If we were dependent on selling shares to generate income for John and Jane's retirement, they would have to be much more considerate of when they withdraw and how much they choose to withdraw.
For example, a withdrawal in 2020 where shares must be sold would destroy more value by locking in losses or poor performance by stocks being sold compared to making the same withdrawal in 2021.
It appears that I forgot to include the withdrawal table in the January update. The image below shows funds that are withdrawn from the account. This is especially important to consider because now the amount of dividend income generated is just enough to cover the amount being withdrawn.
2023 - April - Taxable Withdrawals (CDI)
In an effort to be transparent about John and Jane's Taxable Account, I like to include an unrealized Gain/Loss summary. The numbers used are based on the closing prices from April 3, 2023.
2023 - April - Taxable Gain-Loss Update (CDI)
It is worth noting in the table above that the yield column is most accurate at the start of the year but if I reduce the size of positions it may inflate the yield because it is based on how much dividend income is collected. At the same time, it may report excessively low dividends for positions added or significantly increased at the end of the year.
Conclusion
One trend that might support selling in May is that there is a major shakeup taking place in the potential solvency of regional banks and with JPMorgan ( JPM ) taking over the assets of First Republic Bank (FRCB) we need to consider that the financial sector as a whole is going to see some ugly months ahead.
The other reason for this is that we haven't even begun to see the negative impact of charged-off autos with the supply of the auto market getting turned upside down from a year ago when there was literally no supply of new/used autos.
So rather than sell everything I think a better play is to avoid investing in or consider selling stocks that fall in the following sectors (many of which I have noted in previous articles).
- Recreational Vehicles and Boats
- Powersports, Motorcycles, (essentially toys)
- Automotive Sales (new & used)
- Financial Sector - Particularly those with significant exposure to any of the fields mentioned above.
Liquidity and deposits are dominating the conversation right now for financial institutions and I would expect the situation to get worse before it gets better.
In John and Jane's Taxable Account, they are currently long the following mentioned in this article: Apple (NASDAQ: AAPL ), Arbor Realty (NYSE: ABR ), Archer-Daniels-Midland (NYSE: ADM ), Air Products and Chemicals ( APD ), Carrier Global Corporation (NYSE: CARR ), Clorox (NYSE: CLX ), Cummins (NYSE: CMI ), Dover Corporation (NYSE: DOV ), Eaton Vance Floating-Rate Advantage Fund A (MUTF: EAFAX ), Emerson Electric ( EMR ), Enterprise Products Partners (NYSE: EPD ), EPR Properties (NYSE: EPR ), Equinix (NASDAQ: EQIX ), Energy Transfer (NYSE: ET ), Eaton Vance Tax-Advantaged Dividend Income Fund (NYSE: EVT ), General Mills (NYSE: GIS ), Honeywell (NASDAQ: HON ), Helmerich & Payne (NYSE: HP ), Hormel (NYSE: HRL ), Iron Mountain (NYSE: IRM ), McDonald's ( MCD ), Altria (NYSE: MO ), Nordson ( NDSN ), Realty Income ( O ), Old Republic International ( ORI ), Otis Worldwide Corporation (NYSE: OTIS ), Parker-Hannifin (NYSE: PH ), Ryder System (NYSE: R ), Rio Tinto ( RIO ), Rithm Capital ( RITM ), RPM International ( RPM ), Raytheon Technologies (NYSE: RTX ), Schlumberger (NYSE: SLB ), Southern Company (NYSE: SO ), Simon Property Group ( SPG ), AT&T (NYSE: T ), Texas Instruments (NASDAQ: TXN ), V.F. Corporation ( VFC ), Verizon (NYSE: VZ ), Washington Trust (NASDAQ: WASH ), Westlake Chemical (NYSE: WLKP ), W. P. Carey (NYSE: WPC ), and Exxon Mobil ( XOM ).
For further details see:
The Retirees' Dividend Portfolio: John And Jane's April 2023 Taxable Account Update