RTNTF - The Retirees' Dividend Portfolio: John And Jane's January 2023 Taxable Account Update
Summary
- The Taxable Account generated $1,250.56 of dividend income for January 2023 compared with $1,072.22 of dividend income for January 2022.
- The Taxable Account had a balance of $548.9K as of January 31, 2023, vs. $534.2K on January 31, 2022. The annualized cost basis yield is 5.27%.
- Three companies in the Taxable portfolio paid increased dividends or paid a special dividend during the month of January.
- The Taxable Account had a cash balance of $23.8K as of January 31, 2023, vs. $41.9K as of January 31, 2022. The cash balance does not include $20K in CDs.
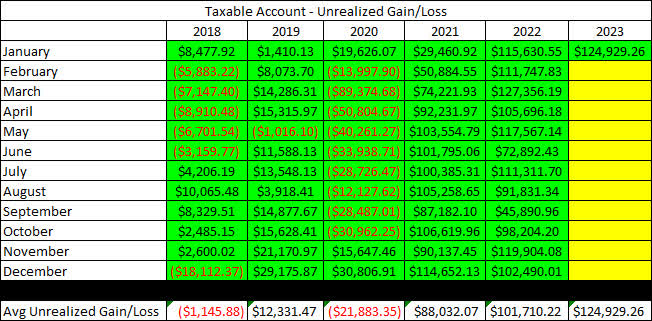
- The Taxable Account had an unrealized gain/loss of $124.9K as of January 31, 2023, vs. $115.6K as of January 31, 2022.
The market has responded positively with the assumption that a fed pivot is not only possible but likely. At least that's the only explanation that makes sense to me with the rebound seen over the last month.
The concern here is that the market is already richly valued which is why we saw the Nasdaq Composite (IXIC) get absolutely annihilated in 2022 (the DJIA & SPX weren't treated much better during this time). My main issue with the situation is that there is so much anecdotal information that indicates the economic environment will continue to get worse. This doesn't mean we are pulling all of our money out of the market but when we invest we do so with the intention of upside or some sort of hedge towards safety and I don't see strong evidence for either situation to take place.
Remember, I am addressing all of this from the retiree's perspective. I can see the comments now talking about the missed upside of the last month but I would still take cash/CDs/Bonds as a retiree over many of the stock valuations that exist today. I say this even as John and Jane's unrealized gain/loss on this account crested the record high seen in March 2022. We are reaching a point where capital preservation needs to be given as much weight as cash flow.
Background
For those interested in John and Jane's full background, you can find at least three articles a month published for the last five years detailing the performance of their portfolio. I have continued to evolve the report over time by adding and removing information/images to make the updates more useful to the average investor. Here are the key details that should be understood when reading these updates.
- This is a real portfolio with actual shares being traded. This is not a practice portfolio which is why I include screenshots from Charles Schwab to document every change that is made.
- I am not a financial advisor and merely provide guidance based on a relationship that goes back several years.
- John retired in January 2018 and has collected Social Security income as his regular source of income. John also currently withdraws $1,000/month from his Traditional IRA.
- Jane retired at the beginning of 2021 and decided to begin collecting Social Security early and has not made any withdrawals from her retirement accounts yet.
- John and Jane began drawing funds from the Taxable Account in 2022 at $1,000/month. After speaking with them this amount has been increased to $1,700/month. This withdrawal is still covered entirely by dividend and interest income.
- John and Jane have other investments outside of what I manage. These investments primarily consist of minimal-risk bonds and low-yield certificates.
- John and Jane have no debt or monthly payments other than basic recurring bills such as water, power, property taxes, etc.
The reason why I started helping John and Jane with their retirement accounts is that I was infuriated by the fees they were being charged by their previous financial advisor. I do not charge John and Jane for anything that I do .
The only request I have made of John and Jane is that they allow me to publish their portfolio anonymously because I want to help as many people as I can while holding myself accountable and improving my thought process.
I started this series to address issues I have had when reading other authors with similar types of updates (I am not saying they are wrong but I found myself questioning their actual performance because they never provided enough information to cover loose ends.
Here is my promise to readers:
- I aim to give as much information as needed so readers can feel confident that what I do is real.
- Even if you agree the results are real this does not mean I expect you to agree with me and I will always answer constructive criticism whenever possible. I will respond with the same genuine intent that the question was asked with.
- I am very transparent about the portfolio and consistency is a significant goal of mine. All of my data points (unless noted otherwise) are derived from month-end statements from Charles Schwab. Even when things aren't looking great (Spring 2020 for example) you will know because I provide enough information that it would be impossible for me to manipulate.
- This article is not intended to be advice or a call to action and is for informational purposes only (I am not a financial advisor and I don't claim to be one). My goal is to challenge conventional thinking and empower you to take control of your investments (if that's something you want to do).
While many authors require paid subscriptions to see their portfolio I do not want to go that route and will continue to publish this series for free as long as there is enough interest to make it worth my time (and I spend A LOT of time on these articles).
Generating a stable and growing dividend income with an emphasis on capital preservation has become the primary focus of this portfolio. I am least concerned about capital appreciation which is why the decisions made will seem pretty conservative most of the time. I may measure the performance of the portfolio relative to indexes and ETFs but the key metric I am focused on is delivering a more stable source of cash flow to John and Jane over time that allows them to live a comfortable retirement that includes minimal stress related to finances.
Dividend Decreases
No companies in the Taxable account eliminated or reduced their dividend during the month of January.
Dividend Increases
Three companies paid increased dividends/distributions or a special dividend during the month of January in the Taxable Account.
Realty Income - The stock reached a 52-week-low in October and we used the opportunity to add more shares in John and Jane's retirement portfolios. The most recent dividend increase is in-line with normal quarterly increases so there aren't any surprises about that. Realty Income is still making substantial progress on the acquisition front with the acquisition of Encore Boston Harbor from Wynn ( WYNN ) and the purchase of a property portfolio from CIM Realty ( CMRF ) for a combined total of roughly $2.5 billion in these two deals. With the stock price for O having rebounded we are reaching a point where it is almost fully valued ($70/share) so we have no plans to add more shares until we see another pullback into the mid-$50/share range. Investors looking to establish or build a position will maximize their potential upside when the dividend yield is close to (or above) 5%.
The dividend was increased from $.248/share per month to $.2485/share per month. This represents an increase of .2% and a new full-year payout of $2.982/share compared with the previous $2.976/ share. This results in a current yield of 4.43% based on the current share price of $67.22.
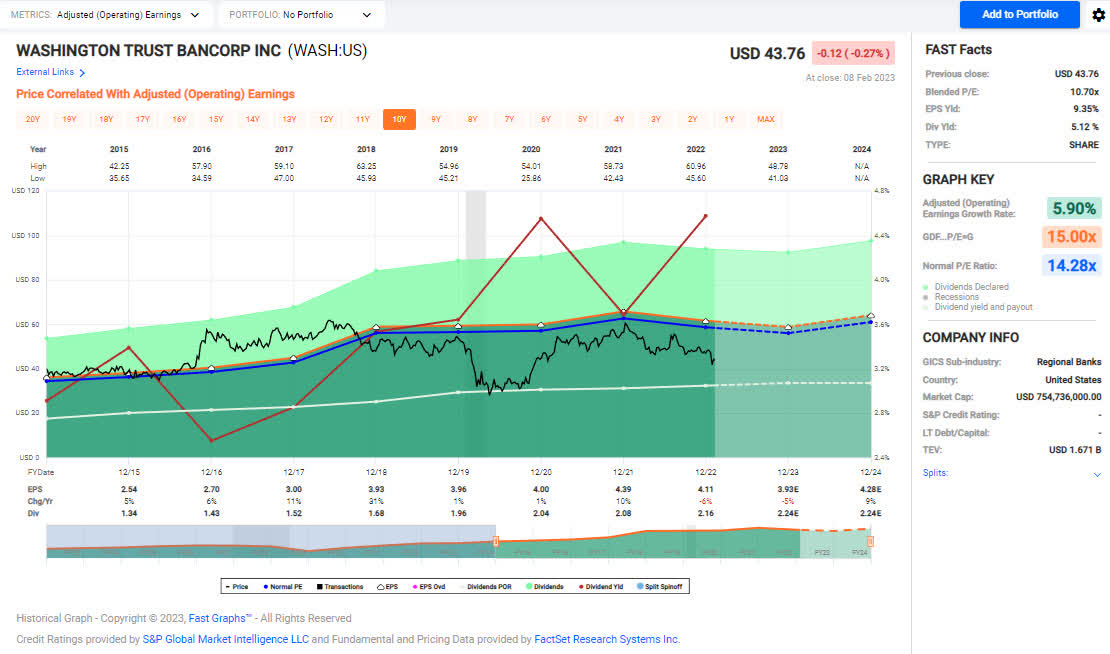
Washington Trust Bancorp - WASH with one of the first stocks that we purchased in the Taxable Account for John and Jane. WASH was founded in 1800 and holds the record of being the oldest Community Bank in the United States. One reason we like WASH is that it has a diversified revenue stream (interest income from commercial and retail loans and non-interest income that includes wealth management, mortgage banking fees, and commercial banking fees) that is going to give it more balanced earnings during challenging environments. As with many institutions, the cost of funds has increased rapidly, and mortgage refinances have come to a halt which have been the bread-and-butter of many large institutions to generate large amounts of fee income have come to an abrupt stop. WASH is still in growth mode as it puts more resources towards opening new branches that expand its reach and its ability to appeal to commercial clients. WASH has a loan-to-deposit ratio of 1.02X which is why its focus on deposit growth is the key to long-term success.
We see the recent pullback as an excellent opportunity to build a larger position and recently purchased more shares in the Taxable Account. The current dividend is well covered and offers a compelling yield of over 5%.
WASH - FastGraphs - 2023-2 (FastGraphs)
The dividend was increased from $.54/share per quarter to $.56/share per quarter. This represents an increase of 3.7% and a new full-year payout of $2.24/share compared with the previous $2.16/ share. This results in a current yield of 5.10% based on the current share price of $43.76.
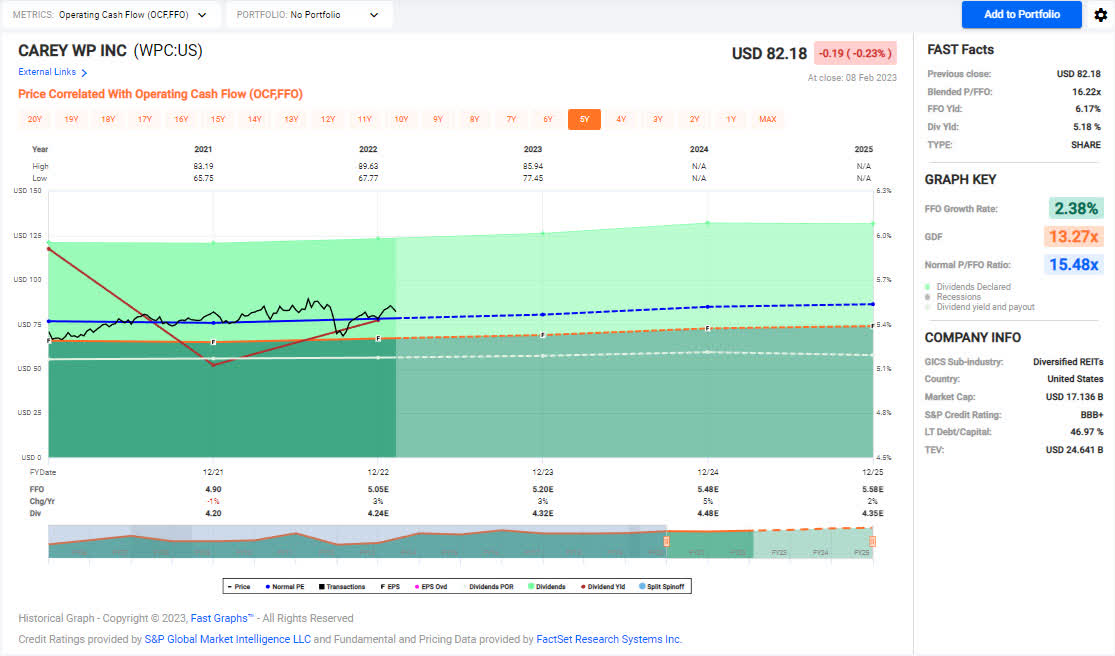
WP Carey - WPC recently received a boost from an upgraded credit rating from the S&P Global Ratings that move it from BBB to BBB+. The primary driver of this rating increase came from above-average expected growth in contractual rent increases due to inflationary same-store rent growth. S&P noted that "WPC's portfolio benefits from periods of high inflation as ~55% of its leases have embedded rent escalators tied to the consumer price index, S&P Global explained, 37% of which are uncapped." The S&P also noted that the credit quality of WPC's tenants also provides downside protection in a recessionary environment.
The recent pullback to the low-$70/share range is not something I expect to see again in the near future and with this information, it is likely that I will have to update the expected price range for WPC because I have really only purchased shares in the high $60/share range and also sold shares when they exceeded $80-$85/share. WPC is a hold at this point but I would consider adding more shares if the price moves back into the mid-$70/share range.
The dividend increase was larger than normal which is common for January but it is worth noting that the last time an increase this large took place was back in January 2018 so this may be a positive sign for dividend growth moving forward.
WPC - FastGraphs - 2023-2 (FastGraphs)
The dividend was increased from $1.061/share per quarter to $1.065/share per quarter. This represents an increase of .4% and a new full-year payout of $4.26/share compared with the previous $4.244/ share. This results in a current yield of 5.17% based on the current share price of $82.18.
Positions
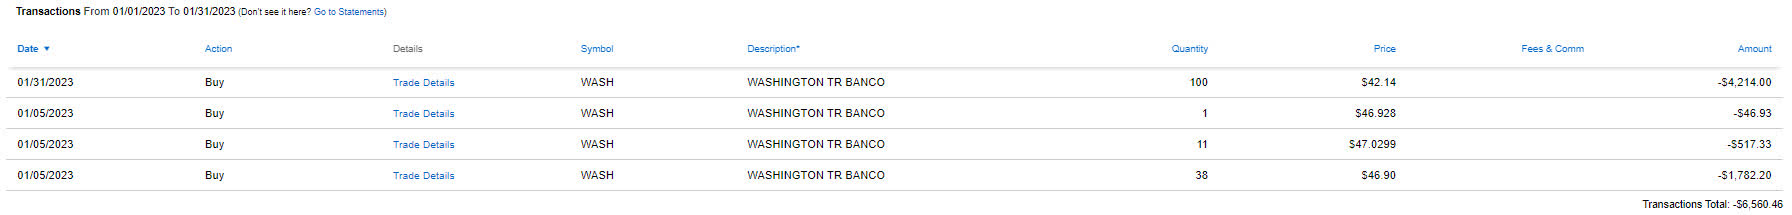
The Taxable Account currently consists of 43 unique positions (44 if you count the brokered certificate) at market close on February 6th, 2023. There were no sales in the month of January but a few purchases of WASH stock did take place.
2023 - January Taxable Transaction History (Charles Schwab)
For additional information on why we made these trades, I will be releasing a trade summary article covering all trades for the last month from all of John and Jane's accounts. Please note that this article is going to be delayed because I will be detaching myself from my day job and SeekingAlpha when I go on vacation.
January Income Tracker - 2022 Vs. 2023
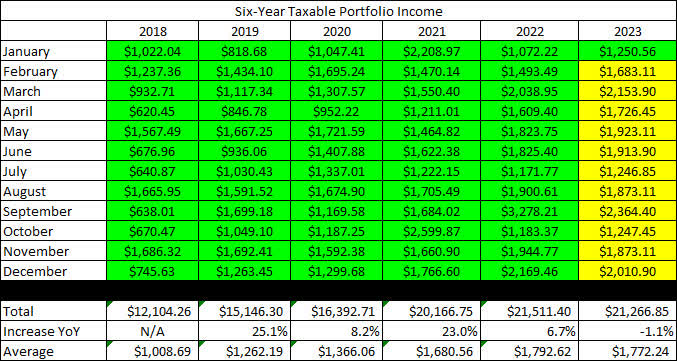
We are starting with a clean slate for 2023 and with all of the expected dividends (based on currently owned shares and announced dividends) the account is set to generate slightly less dividend income in 2023. The primary reason for this was the number of special dividend payouts in 2022 that increased the yield at a faster pace. While it's possible we could see more special dividends in 2023 I think it's more likely that executive management will focus on deleveraging or stock buybacks. The Taxable Account is expected to generate an average of $1,772.24/month of dividend income in 2023 compared to the average monthly income of $1,792.62 generated in FY-2022. Once dividend increases are factored in and the additional interest income from CDs I expect we will see a very light increase in dividend income of 3-4%.
2022 also represented the first year of major withdrawals from the Taxable Account with no new funds flowing into it. The withdrawals John and Jane made were set at $1,000/month for a total of $12,000 withdrawn. After speaking with me they have decided to increase this amount to $1,700/month and the main reason for this is that these funds are taxed whether they take the money or not. This means I will need to be even more conscientious about capital deployment because I will have very limited excess funds to reinvest.
SNLH = Stocks No Longer Held - Dividends in this row represent the dividends collected on stocks that are no longer held in that portfolio. We still count the dividend income from stocks no longer held in the portfolio, even though it is non-recurring. All images below come from Consistent Dividend Investor, LLC. (also referred to as CDI as the source below).
The tables below represent which companies paid dividends in January and how that income source has changed since January of the previous year.
2023 - January - Taxable Dividend Breakdown ((CDI))
The table below represents all income generated in 2022 and collected/expected dividends in 2023.
2023 - January - Taxable Annual Estimate ((CDI))
Below gives an extended look back at the dividend income generated when I first began writing these articles. I find this table to be most useful when comparing how dividend income has improved for a specific month over the course of six years.
2023 - January - Taxable Dividend History ((CDI))
The Taxable Account balances below are from January 31, 2023, and all previous month balances are taken from the end-of-month statement provided by Charles Schwab.
2023 - January - Taxable Month End Balance ((CDI))
The next image is also pulled from the end-of-month statement provided by Charles Schwab which shows the cash balance of the account.
**Please note that cash balances may fluctuate based on CD renewal dates because I only count the cash that is 100% liquid. There were larger fluctuations in 2019 and 2020 that we the result of deposits and withdrawals being made. The Taxable Account has not had a deposit put into it since early 2020 but funds have been used for Traditional/Roth IRA Contributions and for withdrawals in 2022 and will be increasing in 2023.
2023 - January - Taxable Cash Balance ((CDI))
The next image provides a history of the unrealized gain/loss at the end of each month going back to the beginning of January 2018.
2023 - January - Taxable Unrealized Gain-Loss ((CDI))
I think the table above is one of the most important for readers to understand because it paints a story of volatile markets and why we employ the strategy of generating consistent cash flows to overcome the uncertainty of the market. If we were dependent on selling shares to generate income for John and Jane's retirement they would have to be much more considerate of when they withdraw and how much they choose to withdraw.
For example, a withdrawal in 2020 where shares must be sold would destroy more value by locking in losses or poor performance by stocks being sold compared to making the same withdrawal in 2021.
In an effort to be transparent about John and Jane's Taxable Account, I like to include an unrealized Gain/Loss summary. The numbers used are based on the closing prices from February 5th, 2023.
2023 - January - Taxable Gain-Loss Update ((CDI))
It is worth noting in the table above that the yield column is most accurate at the start of the year but if I reduce the size of positions it may inflate the yield because it is based on how much dividend income is collected. At the same time, it may report excessively low dividends for positions added or significantly increased at the end of the year.
Conclusion
I have decided to eliminate the graphs because they were getting too busy and will have to re-design them to provide more valuable information (they were simply a rehash of the tables that you see above).
I am considering some of the following ideas for tables/graphs to add to the articles that would increase the value of the information being presented. I would really appreciate feedback on which of the ideas you consider to be the most important because the primary goal of these articles is to educate and demonstrate transparency.
Some of the ideas I have contemplating are:
- Rebuild the graphs to show cumulatively income per month and year for all three portfolios (Taxable and Retirement Account for John and Jane).
- Build an additional table for future projections of dividend income based on conservative, moderate, and best-case scenarios of dividend growth over the next five years.
- Adding a "Watchlist" section of the articles where I briefly cover stocks that are on my radar (including those that are already in the portfolio as well as not currently held). I would also use this section to address stocks suggested by readers.
- I am open to suggestions not listed above!
I would really like to do something that would make the article more interactive. I find that I am most motivated by the amount of comment activity than I am by the metrics of how many people have read or liked my articles. I appreciate how many regulars I have that read and comment on my articles and I want to continue moving that even more.
Year-End Article
If you are new to my articles and haven't read the 2022 year-end review already I would strongly encourage you to check it out. This article only represents 1/3 of John and Jane's retirement accounts but the year-end article combines everything together so you can get a better idea of their total portfolio.
The Retiree's Dividend Portfolio: Complete 2022 Review - Cash Flow Is King
In John and Jane's Taxable Account, they are currently long the following mentioned in this article: Apple (NASDAQ: AAPL ), Arbor Realty (NYSE: ABR ), Archer-Daniels-Midland (NYSE: ADM ), Air Products and Chemicals ( APD ), Carrier Global Corporation (NYSE: CARR ), Clorox (NYSE: CLX ), Cummins (NYSE: CMI ), Dover Corporation (NYSE: DOV ), Eaton Vance Floating-Rate Advantage Fund A (MUTF: EAFAX ), Emerson Electric ( EMR ), Enterprise Products Partners (NYSE: EPD ), EPR Properties (NYSE: EPR ), Equinix (NASDAQ: EQIX ), Energy Transfer (NYSE: ET ), Eaton Vance Tax-Advantaged Dividend Income Fund (NYSE: EVT ), General Mills (NYSE: GIS ), Honeywell (NASDAQ: HON ), Helmerich & Payne (NYSE: HP ), Hormel (NYSE: HRL ), Iron Mountain (NYSE: IRM ), McDonald's ( MCD ), Altria (NYSE: MO ), Nordson ( NDSN ), Realty Income ( O ), Old Republic International ( ORI ), Otis Worldwide Corporation (NYSE: OTIS ), Parker-Hannifin (NYSE: PH ), Ryder System (NYSE: R ), Rio Tinto ( RIO ), Rithm Capital ( RITM ), RPM International ( RPM ), Raytheon Technologies (NYSE: RTX ), Schlumberger (NYSE: SLB ), Southern Company (NYSE: SO ), Simon Property Group ( SPG ), AT&T (NYSE: T ), Texas Instruments (NASDAQ: TXN ), V.F. Corporation ( VFC ), Verizon (NYSE: VZ ), Washington Trust (NASDAQ: WASH ), Westlake Chemical (NYSE: WLKP ), W. P. Carey (NYSE: WPC ), and Exxon Mobil ( XOM ).
For further details see:
The Retirees' Dividend Portfolio: John And Jane's January 2023 Taxable Account Update