WASH - The Retirees' Dividend Portfolio: John And Jane's June 2023 Taxable Account Update
2023-07-08 09:00:00 ET
Summary
- The Taxable Account generated $2,111.31 of dividend income for June 2023 compared with $1,825.40 of dividend income for June 2022.
- The Taxable Account had a balance of $533.9K as of June 30, 2023, vs. $493.5K on June 30, 2022. The annualized cost basis yield is 5.44%.
- Five companies in the Taxable portfolio paid increased dividends or paid a special dividend during the month of June.
- No trades were made in June as stock prices became less attractively priced.
The old mantra of sell in May and go away means to sell off your holdings at the beginning of May and don't come back until the latter part of the year. Interestingly enough, the market rallied in June to the point where the balance of the Taxable Account was higher than the balance at the end of April.
The mantra of selling in May is something that is supported by historical data, but I would say we are living through a market that might not be accurately represented by historical data. In the case of June 2023, we can consider the strong market recovery to be an outlier.
Looking at the graph above we can see that the Nasdaq led the way followed by the S&P 500 and then the Dow Jones Industrial Average.
I have pointed this out in previous articles, but it is important to consider where the market is in relation to January 1, 2022, because all three indexes were down considerably by the end of 2022. Even with the performance put on so far this year all three indexes are still down in their price performance.
Background
For those interested in John and Jane's full background, you can find at least three articles a month published for the last five years detailing the performance of their portfolio. I have continued to evolve the report over time by adding and removing information/images to make the updates more useful to the average investor. Here are the key details that should be understood when reading these updates.
- This is a real portfolio with actual shares being traded. This is not a practice portfolio which is why I include screenshots from Charles Schwab to document every change that is made.
- I am not a financial advisor and merely provide guidance based on a relationship that goes back several years.
- John retired in January 2018 and has collected Social Security income as his regular source of income. John also currently withdraws $1,000/month from his Traditional IRA.
- Jane retired at the beginning of 2021 and decided to begin collecting Social Security early and has not made any withdrawals from her retirement accounts yet.
- John and Jane began drawing funds from the Taxable Account in 2022 at $1,000/month. After speaking with them this amount has been increased to $1,700/month. This withdrawal is still covered entirely by dividend and interest income.
- John and Jane have other investments outside of what I manage. These investments primarily consist of minimal-risk bonds and low-yield certificates.
- John and Jane have no debt or monthly payments other than basic recurring bills such as water, power, property taxes, etc.
The reason why I started helping John and Jane with their retirement accounts is that I was infuriated by the fees they were being charged by their previous financial advisor. I do not charge John and Jane for anything that I do .
The only request I have made of John and Jane is that they allow me to publish their portfolio anonymously because I want to help as many people as I can while holding myself accountable and improving my thought process.
I started this series to address issues I have had when reading other authors with similar types of updates (I am not saying they are wrong, but I found myself questioning their actual performance because they never provided enough information to cover loose ends).
Here is My Promise to Readers:
- I aim to give as much information as needed so readers can feel confident that what I do is real.
- Even if you agree the results are real this does not mean I expect you to agree with me and I will always answer constructive criticism whenever possible. I will respond with the same genuine intent that the question was asked with.
- I am very transparent about the portfolio and consistency is a significant goal of mine. All of my data points (unless noted otherwise) are derived from month-end statements from Charles Schwab. Even when things aren't looking great (Spring 2020 for example) you will know because I provide enough information that it would be impossible for me to manipulate.
- This article is not intended to be advice or a call to action and is for informational purposes only (I am not a financial advisor, and I don't claim to be one). My goal is to challenge conventional thinking and empower you to take control of your investments (if that's something you want to do).
While many authors require paid subscriptions to see their portfolio, I do not want to go that route and will continue to publish this series for free as long as there is enough interest to make it worth my time (and I spend A LOT of time on these articles).
Generating a stable and growing dividend income with an emphasis on capital preservation has become the primary focus of this portfolio. I am least concerned about capital appreciation which is why the decisions made will seem pretty conservative most of the time. I may measure the performance of the portfolio relative to indexes and ETFs but the key metric I am focused on is delivering a more stable source of cash flow to John and Jane over time that allows them to live a comfortable retirement that includes minimal stress related to finances.
Dividend Increases
Five companies paid increased dividends/distributions or a special dividend during the month of June.
- Helmerich & Payne ( HP )
- Otis Worldwide ( OTIS )
- Parker-Hannifin ( PH )
- Southern Company ( SO )
- Simon Property Group ( SPG )
Helmerich & Payne - I have mentioned previously that there are no major catalysts for HP at the moment and so I believe we will continue to see the share price remain stuck in the low-to-mid $30/share range for the foreseeable future. During the last earnings call management noted the weak fundamentals surrounding natural gas and the lack of demand that has caused the price of natural gas to drop considerably. You can see in the image below that HP's stock price has been driven by higher natural gas prices and that this appears to have some correlation with natural gas consumption levels.
While we may have removed HP from the dividend watchlist I still approve of their shareholder return model where they are maintaining the current dividend and then issuing special dividends like this one to increase shareholder returns when it makes sense to do so. HP has also used funds to buy-back shares which has resulted in the lowest number of shares outstanding in the last 10 years.
HP issued a supplemental dividend of $.235/share during the month of June.
Otis Worldwide - OTIS had been demonstrating a lackluster performance through the end of October 2022 but if you have been an owner of shares since the company was spun off from United Technologies ( UTX ) the return has made it back to levels not seen since September 2021. There are two reasons why I like the elevator industry:
- There are few major competitors in the elevator industry and OTIS is a key player in the industry with 2.2 million service contracts.
- Servicing elevators provides steady/stable income which is approximately 80% of OTIS's earnings.
Servicing elevators is not negotiable in the sense that there are regulatory bodies (both federal and local government agencies) so you can be assured that the maintenance is going to happen. As cities grow and buildings continue to increase in height it would only make sense that the elevator industry would continue to grow.
The dividend was increased from $.29/share per quarter to $.34/share per quarter. This represents an increase of 17.2% and a new full-year payout of $1.36/share compared with the previous $1.16/ share. This results in a current yield of 1.53% based on the current share price of $88.61.
Parker Hannifin - Record sales of $5.1 billion in Q3-2023 and organic sales growth of 12% are both things we like to see but to also have record EPS for the quarter is the icing on the cake. The chart below shows that these items are driving the share price higher and has allowed PH to provide the 67th consecutive dividend increase making it one of the best performing dividend stocks on the market. As if we weren't already happy with the price performance (effectively growing 4x in price over the last decade) they have also seen the dividend grow by 12.4% CAGR during the same time frame.
It would be hard to justify the stock at this price point, but PH is definitely worth considering on any pullbacks. It is possible we may sell some shares, but we would only do it if there were losses from the same of another stock to offset the high capital gains.
The dividend was increased from $1.33/share per quarter to $1.48/share per quarter. This represents an increase of 11.3% and a new full-year payout of $5.92/share compared with the previous $5.32/ share. This results in a current yield of 1.51% based on the current share price of $391.01.
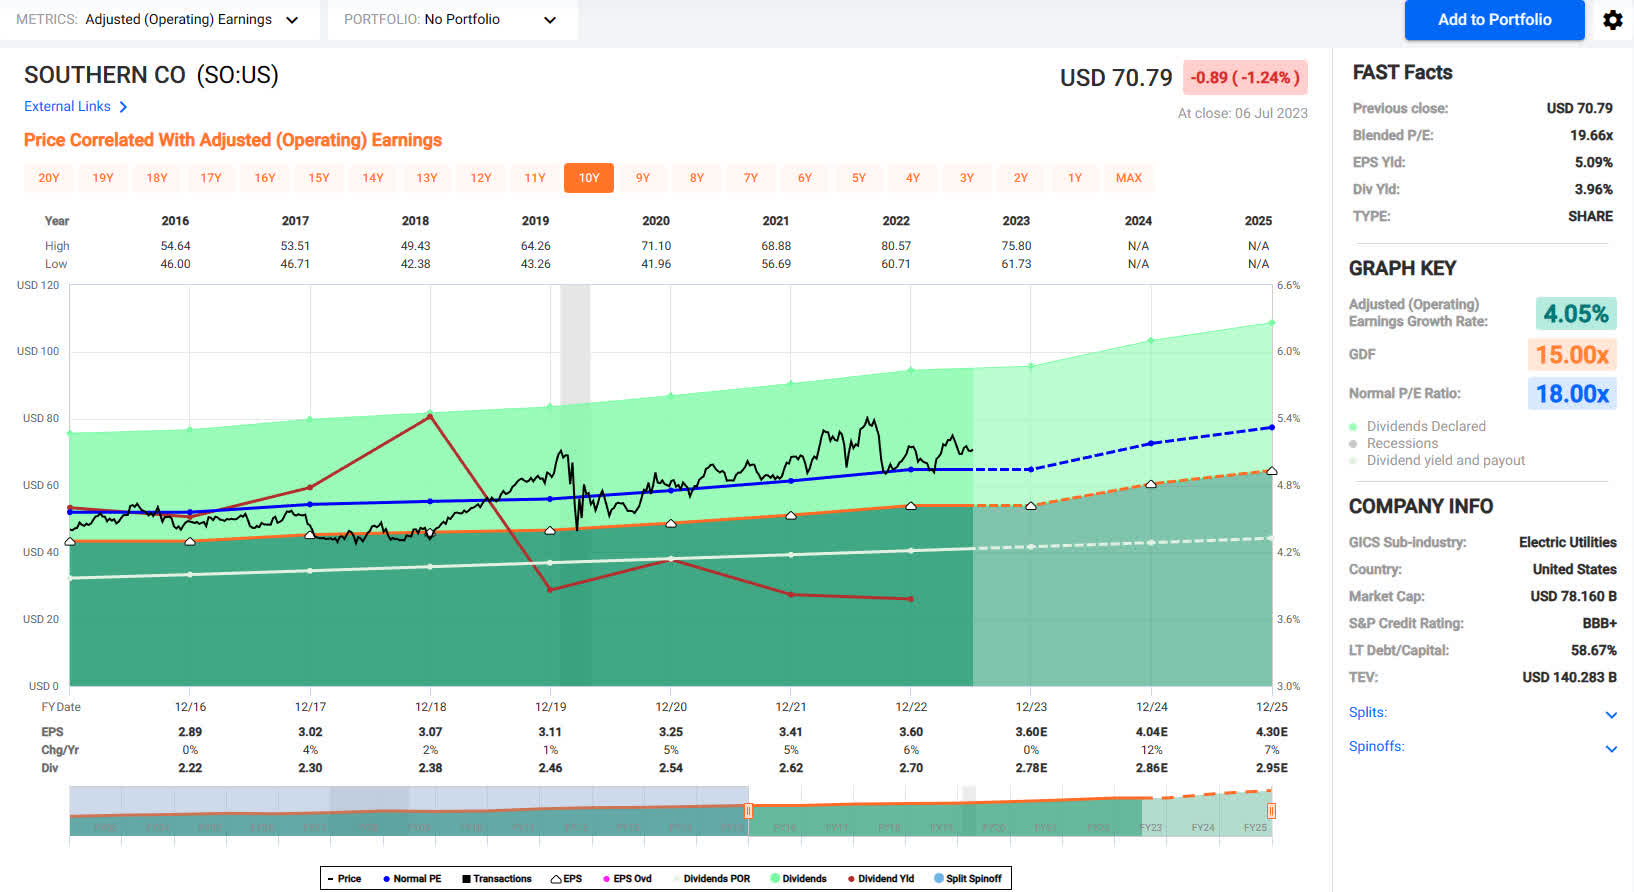
Southern Company - Goldman Sachs ( GS ) came out with a conviction buy on SO of $80/share and while I think that's great it doesn't turn me into a buyer. SO is one of the oldest holdings in the portfolio with a cost basis under $50/share. Dividend growth has been lackluster with the most recent positive developments being the start-up of the Vogtle nuclear reactors. One positive I do agree is that SO has reached an electric base rate increase covering 2023-25 which should insulate earnings compared to other utilities whose don't have the same approvals.
SO will continue to be a hold at this time as we'd rather wait for a pullback to invest more compared to expectations of the stock price pushing $80/share. FastGraphs shows that the company is fully valued at this point relative to its 10-year PE Ratio average of 18x. At this point I'd rather get the funds into a money market like Schwab Value Advantage Money Fund ( SWVXX ) or a certificate paying 4.5%-5%.
SO - FastGraphs 2023-7 (FastGraphs)
The dividend was increased from $.68/share per quarter to $.70/share per quarter. This represents an increase of 2.9% and a new full-year payout of $2.80/share compared with the previous $2.72/ share. This results in a current yield of 3.91% based on the current share price of $70.79.
Simon Property Group - The recent upgrade from Wolfe to Outperform seems to be a confirmation of the stock price improvement seen over the last two weeks. The new dividend of $1.85/share per quarter is still a ways off from the dividend prior to COVID of $2.10/share per quarter. At this point we have enough exposure to SPG and would look to trim the position if the share price moved into the $150/share range because the highest cost basis shares John and Jane hold are 50 shares @ $157.31/share.
While others may see SPG as a growth opportunity I am currently viewing it through the lens of reducing to a core position of low-cost shares and then investing more when/if the opportunity presents itself. For John and Jane the yield that comes from certificates and other risk-free rate investments is too strong to justify additional investment given the size of the current position.
I am using a five-year FastGraphs chart because it has a more realistic AFFO average of 11.76x compared to the ten-year AFFO average of 14.98x. While I think the 15x AFFO is possible, I like the conservative approach of a share price to be $130 share (11.76x) vs $160/share (15x).
SPG - FastGraphs - 2023-7 (FastGraphs)
The dividend was increased from $1.80/share per quarter to $1.85/share per quarter. This represents an increase of 2.8% and a new full-year payout of $7.40/share compared with the previous $7.20/ share. This results in a current yield of 6.26% based on the current share price of $119.10.
Positions
The Taxable Account currently consists of 43 unique positions (44 if you count the brokered certificate) at market close on July 5th, 2023. There were no trades executed in the Taxable account during the month of June.
June Income Tracker - 2022 Vs. 2023
The Taxable Account is expected to generate an average of $1,821.81/month of dividend income in 2023 compared to the average monthly income of $1,792.62 generated in FY-2022. Once dividend increases are factored in and the additional interest income from CDs, I expect we will see a very light increase in dividend income of 3-4% for FY-2023.
2022 also represented the first year of major withdrawals from the Taxable Account with no new funds flowing into it. The withdrawals John and Jane made were set at $1,000/month for a total of $12,000 withdrawn. After speaking with me they have decided to increase this amount to $1,700/month or a total of $20,400/year. The main reason for increasing the withdrawals from the Taxable Account is that they are taxed whether they take the money or not. This means I will need to be even more conscientious about capital deployment because I will have very limited excess funds to reinvest.
Another reason for increasing this is that I have had to talk to John and Jane about making sure they are actually spending some of their money, especially when it comes to purchasing items that they may not be able to utilize in the future such as E-Bikes since their ability to use them depends on their physical and mental health.
SNLH = Stocks No Longer Held - Dividends in this row represent the dividends collected on stocks that are no longer held in that portfolio. We still count the dividend income from stocks no longer held in the portfolio, even though it is non-recurring. All images below come from Consistent Dividend Investor, LLC. (also referred to as CDI as the source below).
The tables below represent which companies paid dividends in June and how that income source has changed relative to the same month last year.
2023 - June - Taxable Dividend Breakdown (CDI)
*The income category in the image above represents the certificate of deposit income.
The table below represents all income generated in 2022 and collected/expected dividends in 2023.
2023 - June - Taxable Annual Estimate (CDI)
Below gives an extended look back at the dividend income generated when I first began writing these articles. I find this table to be most useful when comparing how dividend income has improved for a specific month over the course of six years.
2023 - June - Taxable Dividend History (CDI)
The Taxable Account balances below are from June 30, 2023, and all previous month balances are taken from the end-of-month statement provided by Charles Schwab.
2023 - June - Taxable Month End Balance (CDI)
The next image is also pulled from the end-of-month statement provided by Charles Schwab which shows the cash balance of the account.
**Please note that cash balances may fluctuate based on CD renewal dates because I only count the cash that is 100% liquid. There were larger fluctuations in 2019 and 2020 that we the result of deposits and withdrawals being made. The Taxable Account has not had a deposit put into it since early 2020 but funds have been used for Traditional/Roth IRA Contributions and for withdrawals in 2022 and will be increasing in 2023.
2023 - June - Taxable Cash Balance (CDI)
The next image provides a history of the unrealized gain/loss at the end of each month going back to the beginning of January 2018.
2023 - June - Taxable Unrealized Gain-Loss (CDI)
I think the table above is one of the most important for readers to understand because it paints a story of volatile markets and why we employ the strategy of generating consistent cash flows to overcome the uncertainty of the market. If we were dependent on selling shares to generate income for John and Jane's retirement, they would have to be much more considerate of when they withdraw and how much they choose to withdraw.
For example, a withdrawal in 2020 where shares must be sold would destroy more value by locking in losses or poor performance by stocks being sold compared to making the same withdrawal in 2021.
It appears that I forgot to include the withdrawal table in the January update. The image below shows funds that are withdrawn from the account. This is especially important to consider because now the amount of dividend income generated is just enough to cover the amount being withdrawn.
2023 - June - Taxable Withdrawals (CDI)
In an effort to be transparent about John and Jane's Taxable Account, I like to include an unrealized Gain/Loss summary. The numbers used are based on the closing prices from July 5, 2023.
2023 - June - Taxable Gain-Loss Update (CDI)
It is worth noting in the table above that the yield column is most accurate at the start of the year but if I reduce the size of positions, it may inflate the yield because it is based on how much dividend income is collected. At the same time, it may report excessively low dividends for positions added or significantly increased at the end of the year.
Conclusion
Months like this are always interesting when you look at the significant swings in the unrealized gain/loss table that shows estimated gains go from the lowest point of the year back up to the highest point seen since February. For those who read these articles on a regular basis it won't surprise you to hear me mention how important it is to learn to live with this kind of volatility as long as you are structuring the portfolio in a way that you are taking reasonable risk based on your comfort level.
By owning a dividend growth portfolio, you are in effect exchanging the volatility of the market for the safety and consistent growth of the stocks held. Even the strongest dividend growth portfolio is going to be subject to some degree of swings in stock prices which is why we have developed our reinvestment game plan around buying when opportunities arise and to sell or trim the position if/when it makes sense.
As a reminder, we made no transactions in the month of June and that wasn't by mistake. We did not see worthwhile opportunities to invest the cash on hand because we saw a huge turnaround in the value of many of the holdings. The two holdings that are still underwater significantly are V.F. Corp ( VFC ) and Washington Trust ( WASH ) and we have enough exposure to these stocks at this time.
In John and Jane's Taxable Account, they are currently long the following mentioned in this article: Apple (AAPL), Arbor Realty ( ABR ) Archer-Daniels-Midland ( ADM ), Air Products and Chemicals ( APD ), Carrier Global Corporation ( CARR ), Clorox ( CLX ), Cummins ( CMI ), Dover Corporation ( DOV ), Eaton Vance Floating-Rate Advantage Fund A ( EAFAX ), Emerson Electric ( EMR ), Enterprise Products Partners ( EPD ), EPR Properties ( EPR ), Equinix ( EQIX ), Energy Transfer (ET), Eaton Vance Tax-Advantaged Dividend Income Fund ( EVT ), General Mills ( GIS ), Honeywell ( HON ), Helmerich & Payne ( HP ), Hormel ( HRL ), Iron Mountain ( IRM ), McDonald's ( MCD ), Altria ( MO ), Nordson ( NDSN ), Realty Income ( O ), Old Republic International ( ORI ), Otis Worldwide Corporation ( OTIS ), Parker-Hannifin ( PH ), Ryder System ( R ), Rio Tinto ( RIO ), Rithm Capital ( RITM ), RPM International ( RPM ), Raytheon Technologies ( RTX ), Schlumberger ( SLB ), Southern Company ( SO ), Simon Property Group ( SPG ), AT&T ( T ), Texas Instruments ( TXN ), V.F. Corporation ( VFC ), Verizon ( VZ ), Washington Trust ( WASH ), Westlake Chemical ( WLKP ), W. P. Carey ( WPC ), and Exxon Mobil ( XOM ).
For further details see:
The Retirees' Dividend Portfolio: John And Jane's June 2023 Taxable Account Update