AVGO - The Retirees' Dividend Portfolio: John And Jane's May 2023 Taxable Account Update
2023-06-10 09:00:00 ET
Summary
- The Taxable Account generated $2,062.92 of dividend income for May 2023 compared with $1,823.75 of dividend income for May 2022.
- The Taxable Account had a balance of $500.3K as of May 31, 2023, vs. $535.5K on May 31, 2022. The annualized cost basis yield is 5.41%.
- Three companies in the Taxable portfolio paid increased dividends or paid a special dividend during the month of May.
- John and Jane's Taxable Account has limited exposure to the Nasdaq but significant exposure to the S&P 500 and DJIA, with a focus on generating stable and growing dividend income.
The major indexes have seen some relief over the last few days after the debt ceiling was lifted. Even though the Nasdaq is well ahead of the DJIA and S&P 500, the recent news benefitted the Materials, Industrials, and Energy sectors the most.
What's really interesting to see is how the tech sector (Nasdaq) has seen its best rally since 2021 with strong gains for the following companies that are all pushing their 52-week highs.
Some of the recent gains for the Nasdaq are also related to the AI discussion which has blown up in recent months. Below are a couple of AI ETFs that demonstrate the recent uptick since AI became a major headline topic.
John and Jane's Taxable account has very little exposure to the Nasdaq (primarily AAPL and Texas Instruments ( TXN )) but they have significant exposure to the S&P 500 and DJIA. The Taxable account doesn't have significant exposure to Real Estate but I did want to include one of the closed-end funds held in John's retirement accounts is down -20.5%. John and Jane's retirement accounts do have more exposure to real estate which also helps explain why the Taxable Account is performing so much better than their retirement accounts (with regard to account balances).
Background
For those interested in John and Jane's full background, you can find at least three articles a month published for the last five years detailing the performance of their portfolio. I have continued to evolve the report over time by adding and removing information/images to make the updates more useful to the average investor. Here are the key details that should be understood when reading these updates.
- This is a real portfolio with actual shares being traded. This is not a practice portfolio which is why I include screenshots from Charles Schwab to document every change that is made.
- I am not a financial advisor and merely provide guidance based on a relationship that goes back several years.
- John retired in January 2018 and has collected Social Security income as his regular source of income. John also currently withdraws $1,000/month from his Traditional IRA.
- Jane retired at the beginning of 2021 and decided to begin collecting Social Security early and has not made any withdrawals from her retirement accounts yet.
- John and Jane began drawing funds from the Taxable Account in 2022 at $1,000/month. After speaking with them this amount has been increased to $1,700/month. This withdrawal is still covered entirely by dividend and interest income.
- John and Jane have other investments outside of what I manage. These investments primarily consist of minimal-risk bonds and low-yield certificates.
- John and Jane have no debt or monthly payments other than basic recurring bills such as water, power, property taxes, etc.
The reason why I started helping John and Jane with their retirement accounts is that I was infuriated by the fees they were being charged by their previous financial advisor. I do not charge John and Jane for anything that I do .
The only request I have made of John and Jane is that they allow me to publish their portfolio anonymously because I want to help as many people as I can while holding myself accountable and improving my thought process.
I started this series to address issues I have had when reading other authors with similar types of updates (I am not saying they are wrong, but I found myself questioning their actual performance because they never provided enough information to cover loose ends).
Here is My Promise to Readers:
- I aim to give as much information as needed so readers can feel confident that what I do is real.
- Even if you agree the results are real this does not mean I expect you to agree with me and I will always answer constructive criticism whenever possible. I will respond with the same genuine intent that the question was asked with.
- I am very transparent about the portfolio and consistency is a significant goal of mine. All of my data points (unless noted otherwise) are derived from month-end statements from Charles Schwab. Even when things aren't looking great (Spring 2020 for example) you will know because I provide enough information that it would be impossible for me to manipulate.
- This article is not intended to be advice or a call to action and is for informational purposes only (I am not a financial advisor, and I don't claim to be one). My goal is to challenge conventional thinking and empower you to take control of your investments (if that's something you want to do).
While many authors require paid subscriptions to see their portfolio, I do not want to go that route and will continue to publish this series for free as long as there is enough interest to make it worth my time (and I spend A LOT of time on these articles).
Generating a stable and growing dividend income with an emphasis on capital preservation has become the primary focus of this portfolio. I am least concerned about capital appreciation which is why the decisions made will seem pretty conservative most of the time. I may measure the performance of the portfolio relative to indexes and ETFs but the key metric I am focused on is delivering a more stable source of cash flow to John and Jane over time that allows them to live a comfortable retirement that includes minimal stress related to finances.
Dividend Increases
Three companies paid increased dividends/distributions or a special dividend during the month of April.
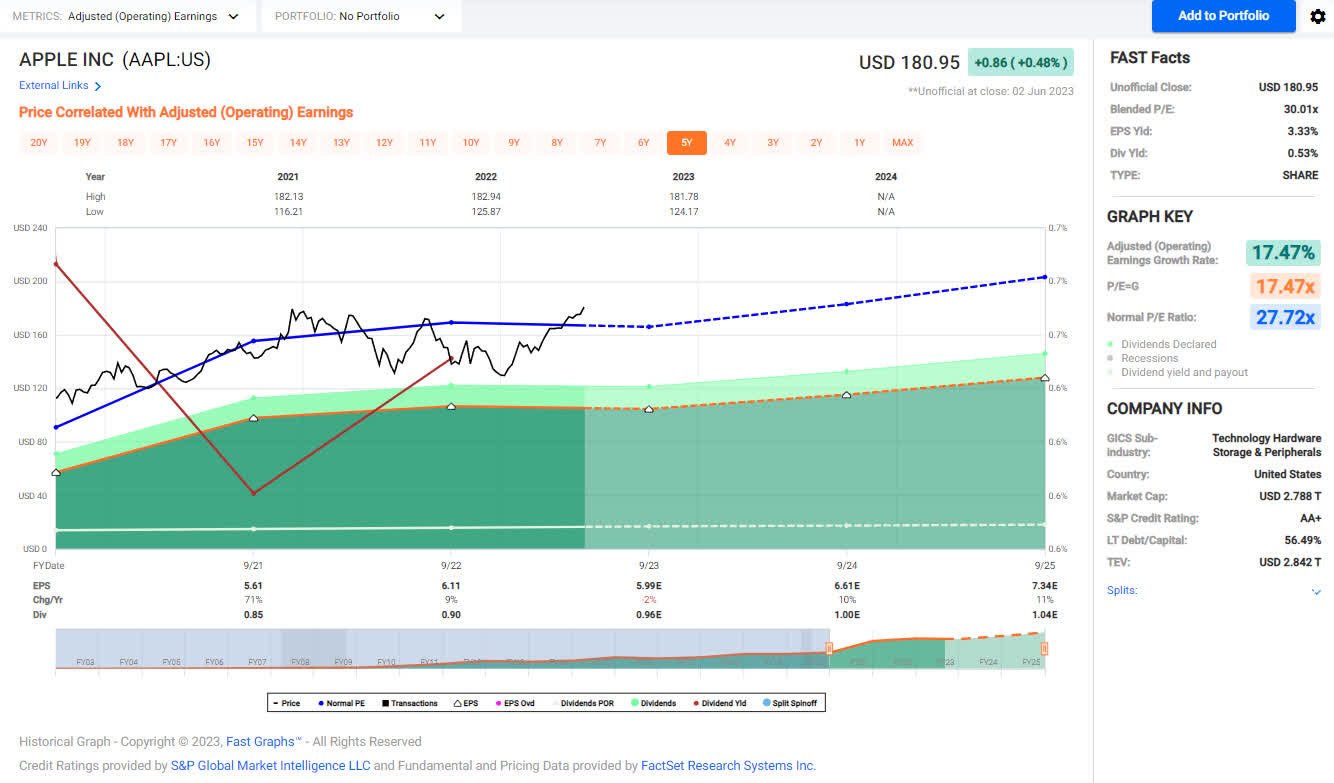
Apple - Apple's dividend increases have never been anything to celebrate (at least not in the last five years) but let's be honest that the dividend is not the primary reason why anyone owns AAPL stock. Over the last three years, the company's average increase comes in at 5.93% which is down from its 9% dividend growth CAGR over 10 years. The smaller increases have nothing to do with safety (the company currently offers a payout ratio of 15.6% and with the benefit of App Store revenue and continued purchase of consumer products the payout ratio has actually reached a low point that hasn't been seen since the dividend was instituted almost a decade ago. Where AAPL is putting its money is in its $90 billion share buyback that was announced with the dividend increase.
AAPL is definitely a hold and is a potential candidate to sell a partial holding of because at this point, I think a pullback is more likely than continued growth is that it's already at its 52-week-high. To be clear, we are not looking to sell AAPL stock but if there was a situation that made sense, we wouldn't object to it either.
AAPL - 2023-6 - FastGraphs (FastGraphs)
The dividend was increased from $.23/share per quarter to $.24/share per quarter. This represents an increase of 4.3% and a new full-year payout of $.96/share compared with the previous $.92/ share. This results in a current yield of .53% based on the current share price of $180.95.
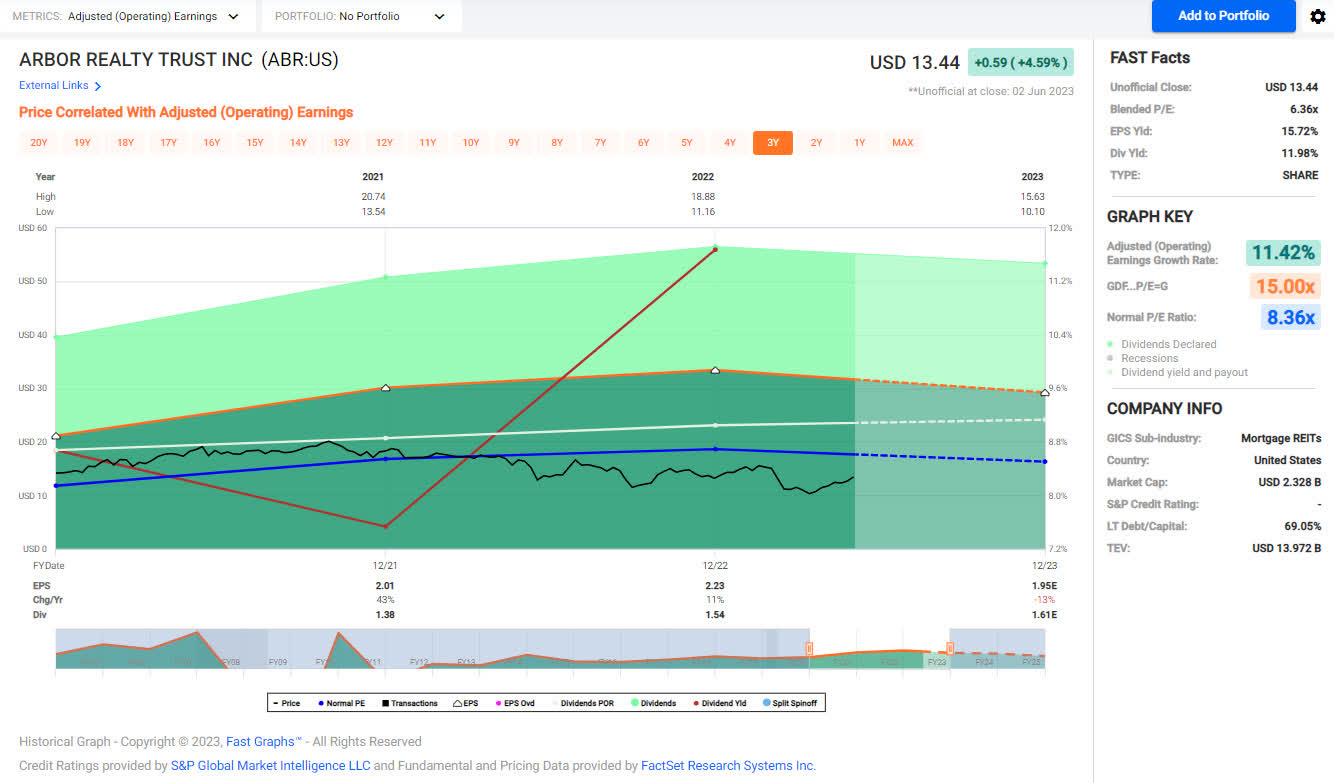
Arbor Realty - ABR stock price bounced off its 52-week-lows and is up almost 20% over the last month with the most recent pop coming after the debt ceiling was lifted. I also think that the optimism of one more rate increase by the Federal Reserve is something that is benefitting the multi-family industry. With this in mind, I think that the ceiling for the stock price is in the $16/share range because the headwinds impacting the stock (interest rates and continued expansion of the multi-family housing market) have some degree of uncertainty.
With that said, John and Jane's cost basis is approximately half of the current price so we have a lot of tolerance when it comes to holding ABR even if the headwinds become problematic. ABR has been in John and Jane's portfolio for approximately five years and we have seen the financial benefit of owning shares of a company with a rapidly growing dividend.
ABR - 2023-6 - FastGraphs (FastGraphs)
The dividend was increased from $.40/share per quarter to $.42/share per quarter. This represents an increase of 5% and a new full-year payout of $1.68/share compared with the previous $1.60/ share. This results in a current yield of 12.50% based on the current share price of $13.44.
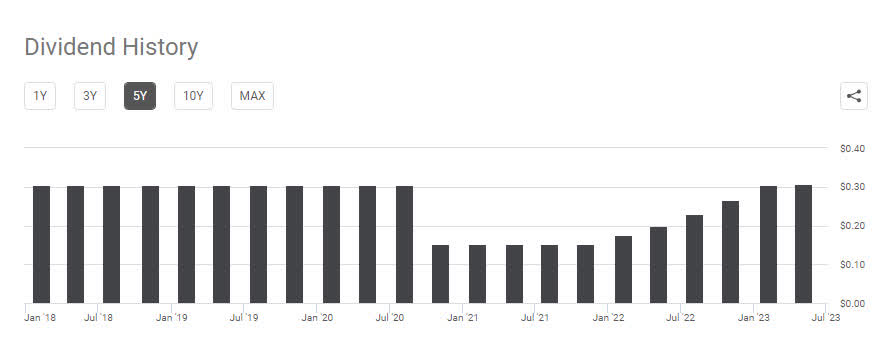
Energy Transfer - I mentioned in the February Update that the 15% dividend increases were not sustainable now that the distribution has been restored to the same level that it was back in August 2020. I am curious to see if the recent small increase will become a trend moving forward.
ET - 2023-6 - Dividend History (Seeking Alpha)
ET's current yield is very sustainable with distributable cash flow coverage expected to come in at 1.96x which is a very healthy level to maintain and commit to reasonable increases. Given the stability of its business model and the 9.5% yield, I think that ET is in a strong position to provide above-average returns over the next several years.
The dividend was increased from $.305/share per quarter to $.3075/share per quarter. This represents an increase of .8% and a new full-year payout of $1.23/share compared with the previous $1.22/ share. This results in a current yield of 9.55% based on the current share price of $12.88.
Positions
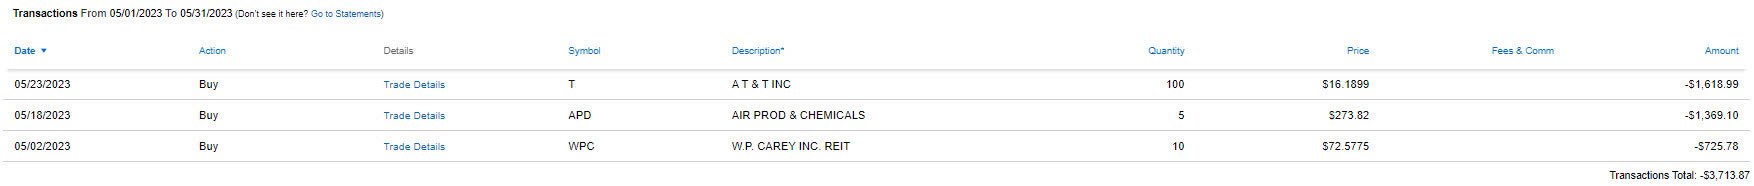
The Taxable Account currently consists of 43 unique positions (44 if you count the brokered certificate) at market close on June 2, 2023. There were three purchases total during the month of May.
2023 - May Taxable Transaction History (Charles Schwab)
May Income Tracker - 2022 Vs. 2023
The Taxable Account is expected to generate an average of $1,805.35/month of dividend income in 2023 compared to the average monthly income of $1,792.62 generated in FY-2022. Once dividend increases are factored in and the additional interest income from CDs, I expect we will see a very light increase in dividend income of 3-4% for FY-2023.
2022 also represented the first year of major withdrawals from the Taxable Account with no new funds flowing into it. The withdrawals John and Jane made were set at $1,000/month for a total of $12,000 withdrawn. After speaking with me they have decided to increase this amount to $1,700/month or a total of $20,400/year. The main reason for increasing the withdrawals from the Taxable Account is that they are taxed whether they take the money or not. This means I will need to be even more conscientious about capital deployment because I will have very limited excess funds to reinvest.
Another reason for increasing this is that I have had to talk to John and Jane about making sure they are actually spending some of their money, especially when it comes to purchasing items that they may not be able to utilize in the future such as E-Bikes since their ability to use them depends on their physical and mental health.
SNLH = Stocks No Longer Held - Dividends in this row represent the dividends collected on stocks that are no longer held in that portfolio. We still count the dividend income from stocks no longer held in the portfolio, even though it is non-recurring. All images below come from Consistent Dividend Investor, LLC. (also referred to as CDI as the source below).
The tables below represent which companies paid dividends in May and how that income source has changed relative to the same month last year.
2023 - May - Taxable Dividend Breakdown (CDI)
*The income category in the image above represents the certificate of deposit income.
The table below represents all income generated in 2022 and collected/expected dividends in 2023.
2023 - May - Taxable Annual Estimate (CDI)
Below gives an extended look back at the dividend income generated when I first began writing these articles. I find this table to be most useful when comparing how dividend income has improved for a specific month over the course of six years.
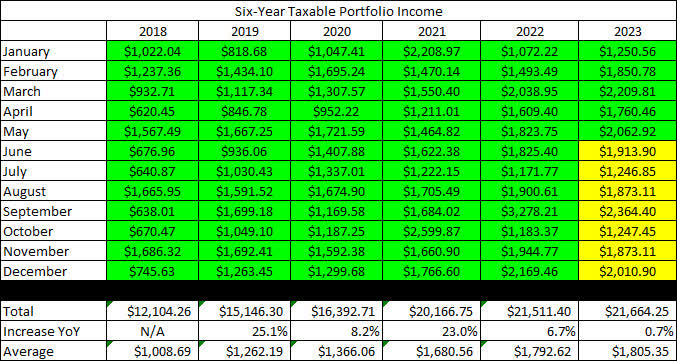
The Taxable Account balances below are from May 31st, 2023, and all previous month balances are taken from the end-of-month statement provided by Charles Schwab.
2023 - May - Taxable Month End Balance (CDI)
The next image is also pulled from the end-of-month statement provided by Charles Schwab which shows the cash balance of the account.
**Please note that cash balances may fluctuate based on CD renewal dates because I only count the cash that is 100% liquid. There were larger fluctuations in 2019 and 2020 that we the result of deposits and withdrawals being made. The Taxable Account has not had a deposit put into it since early 2020 but funds have been used for Traditional/Roth IRA Contributions and for withdrawals in 2022 and will be increasing in 2023.
2023 - May - Taxable Cash Balance (CDI)
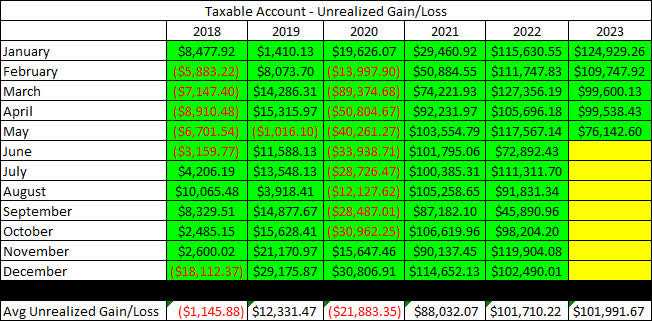
The next image provides a history of the unrealized gain/loss at the end of each month going back to the beginning of January 2018.
I think the table above is one of the most important for readers to understand because it paints a story of volatile markets and why we employ the strategy of generating consistent cash flows to overcome the uncertainty of the market. If we were dependent on selling shares to generate income for John and Jane's retirement, they would have to be much more considerate of when they withdraw and how much they choose to withdraw.
For example, a withdrawal in 2020 where shares must be sold would destroy more value by locking in losses or poor performance by stocks being sold compared to making the same withdrawal in 2021.
It appears that I forgot to include the withdrawal table in the January update. The image below shows funds that are withdrawn from the account. This is especially important to consider because now the amount of dividend income generated is just enough to cover the amount being withdrawn.
2023 - May - Taxable Withdrawals (CDI)
In an effort to be transparent about John and Jane's Taxable Account, I like to include an unrealized Gain/Loss summary. The numbers used are based on the closing prices from June 6, 2023.
2023 - May - Taxable Gain-Loss Update (CDI)
It is worth noting in the table above that the yield column is most accurate at the start of the year but if I reduce the size of positions, it may inflate the yield because it is based on how much dividend income is collected. At the same time, it may report excessively low dividends for positions added or significantly increased at the end of the year.
Conclusion
Even though May was a tough month for the objective performance (cash on hand, unrealized gains, balances, etc) the portfolio continues to do exactly what we intended. Even as I write this article there has been a significant recovery in the balance of the Taxable portfolio. This can also be seen in the improvement in the value of the three big indexes.
Although it's not fair to criticize an index without considering the parts that constitute it, I would exercise caution with the Nasdaq because the recent boost seems driven by news headlines about AI rather than actual spectacular results. Many tech companies are committing to major layoffs and that will impact their ability to innovate but have the ability to make the stock's earnings look better in the near term because of the reduced operating expenses. I am not knocking any specific stocks but I think it's worth considering that this might be one last push before we see a major pullback.
While the situation is nowhere near the tech bubble in the 2000s, I think there is some truth to blind optimism being the highest before the fall.
There are a few stocks in the list above that have become significantly more attractive and many of those are included in the watchlist link included at the end of the article.
CD rates and treasuries continue to look attractive as banks battle for deposits and with concerns about the debt ceiling being eliminated (at least for the time being).
Additional Articles
The first article is an overall review of the economy and societal trends that I think are worth keeping in mind. The second article is the most recent watchlist article with prospective companies that may or may not be John and Jane's portfolios (or my personal portfolio) already.
The Retirees Guide To An Upcoming Recession
Undervalued Dividend Stocks Watchlist - Adding LyondellBasell
In John and Jane's Taxable Account, they are currently long the following mentioned in this article: Apple ((AAPL)), Arbor Realty ((ABR)) Archer-Daniels-Midland ( ADM ), Air Products and Chemicals ( APD ), Carrier Global Corporation ( CARR ), Clorox ( CLX ), Cummins ( CMI ), Dover Corporation ( DOV ), Eaton Vance Floating-Rate Advantage Fund A ( EAFAX ), Emerson Electric ( EMR ), Enterprise Products Partners ( EPD ), EPR Properties ( EPR ), Equinix ( EQIX ), Energy Transfer ((ET)), Eaton Vance Tax-Advantaged Dividend Income Fund ( EVT ), General Mills ( GIS ), Honeywell ( HON ), Helmerich & Payne ( HP ), Hormel ( HRL ), Iron Mountain ( IRM ), McDonald's ( MCD ), Altria ( MO ), Nordson ( NDSN ), Realty Income ( O ), Old Republic International ( ORI ), Otis Worldwide Corporation ( OTIS ), Parker-Hannifin ( PH ), Ryder System ( R ), Rio Tinto ( RIO ), Rithm Capital ( RITM ), RPM International ( RPM ), Raytheon Technologies ( RTX ), Schlumberger ( SLB ), Southern Company ( SO ), Simon Property Group ( SPG ), AT&T ( T ), Texas Instruments ( TXN ), V.F. Corporation ( VFC ), Verizon ( VZ ), Washington Trust ( WASH ), Westlake Chemical ( WLKP ), W. P. Carey ( WPC ), and Exxon Mobil ( XOM ).
For further details see:
The Retirees' Dividend Portfolio: John And Jane's May 2023 Taxable Account Update